3586
Kinetic Analysis of Multi-resolution Hyperpolarized 13C Human Brain MRI1Bioengineering, UC San Francisco, UC Berkeley, San Francisco, CA, United States, 2Radiology and Biomedical Imaging, UC San Francisco, San Francisco, CA, United States
Synopsis
Utilizing a multi-resolution acquisition for hyperpolarized [1-13C]pyruvate brain MRI (7.5 mm in-plane for pyruvate and 15 mm in-plane resolution for lactate & bicarbonate) minimized partial volume effects from vascular pyruvate signals while maintaining the SNR of the downstream metabolites. In the healthy volunteers studied, higher resolution HP 13C-pyruvate multi-slice EPI images improved the quantification of kinetic rates in the brain. Selected voxels near veins and in white and gray matter showed on average >20% higher kPL using higher resolution pyruvate images, consistent with reduced partial volume contributions from vascular HP 13C-pyruvate.
Introduction
Hyperpolarized substrates have been used to non-invasively image metabolism in preclinical1 and clinical research applications2, but typically metabolites are acquired at coarse resolution (15-25 mm2 for clinical applications) to maximize SNR. Metabolic products like 13C bicarbonate, converted from [1-13C]pyruvate via pyruvate dehydrogenase, can exhibit reduced signal due to slow transport, low conversion rates, and short T1 times. For coarse resolution images however, high vascular pyruvate signals cause partial volume effects that can decrease the measured kinetic rate in nearby voxels3. Independent spatial resolution for each metabolite is feasible with metabolite-specific 13C MRI acquired with a spectral-spatial excitation pulse and single-shot echo planar readouts4. A multi-resolution acquisition, with higher resolution for pyruvate and coarser resolutions for metabolic products, could improve metabolic quantification by decreasing partial volume effects in pyruvate images while maintaining adequate SNR for metabolic products5. To explore the improvement in metabolic quantification between multi-resolution and constant resolution images, a multi-resolution [1-13C]pyruvate study was acquired in the healthy human brain and the resulting fitted kinetic rates were compared to those from a synthetic constant-resolution study.Methods
Hyperpolarized [1-13C]pyruvate data from three healthy subjects were acquired with a metabolite-selective spectral-spatial RF pulse for excitation and a single-shot symmetric echoplanar readout for encoding5. A volume transmit 13C coil was used for RF excitation with a 24 channel array for reception (RAPID Biomedical, Germany). Pyruvate was excited with a 20° flip angle, lactate and bicarbonate were excited with a 30° flip angle, and the slice thickness was 15 mm. The in-plane spatial resolution for each metabolite was changed by independently scaling the encoding gradients, resulting in 7.5 × 7.5 mm2 resolution for pyruvate and 15 × 15 mm2 resolution for lactate and bicarbonate. Twenty time points were acquired with a 3 second temporal resolution for a total scan time of one minute. For anatomic reference, 1H 3D T1 IR-SPGR and TOF MRA datasets were acquired. The EPI data was reconstructed and corrected using methods described in Gordon et al5. For comparison, and to assess the reduction in partial volume effects, a synthetic 15 × 15 mm2 pyruvate data set was obtained by convolving the 7.5 × 7.5 mm2 with an averaging kernel.Kinetic rate values for each voxel were computed using an inputless two-site model to generate quantitative maps of pyruvate-to-lactate conversion (kPL)6. With the same lactate data, two sets of kPL maps were generated: one set using the 7.5 × 7.5 mm2 resolution pyruvate data and the other set using the synthetic 15 × 15 mm2 resolution pyruvate data. Kinetic rate maps were respectively thresholded by metabolite SNR >5 and fit error <30%. Due to low SNR and high fit errors, kPB maps were not considered for this analysis.
Results
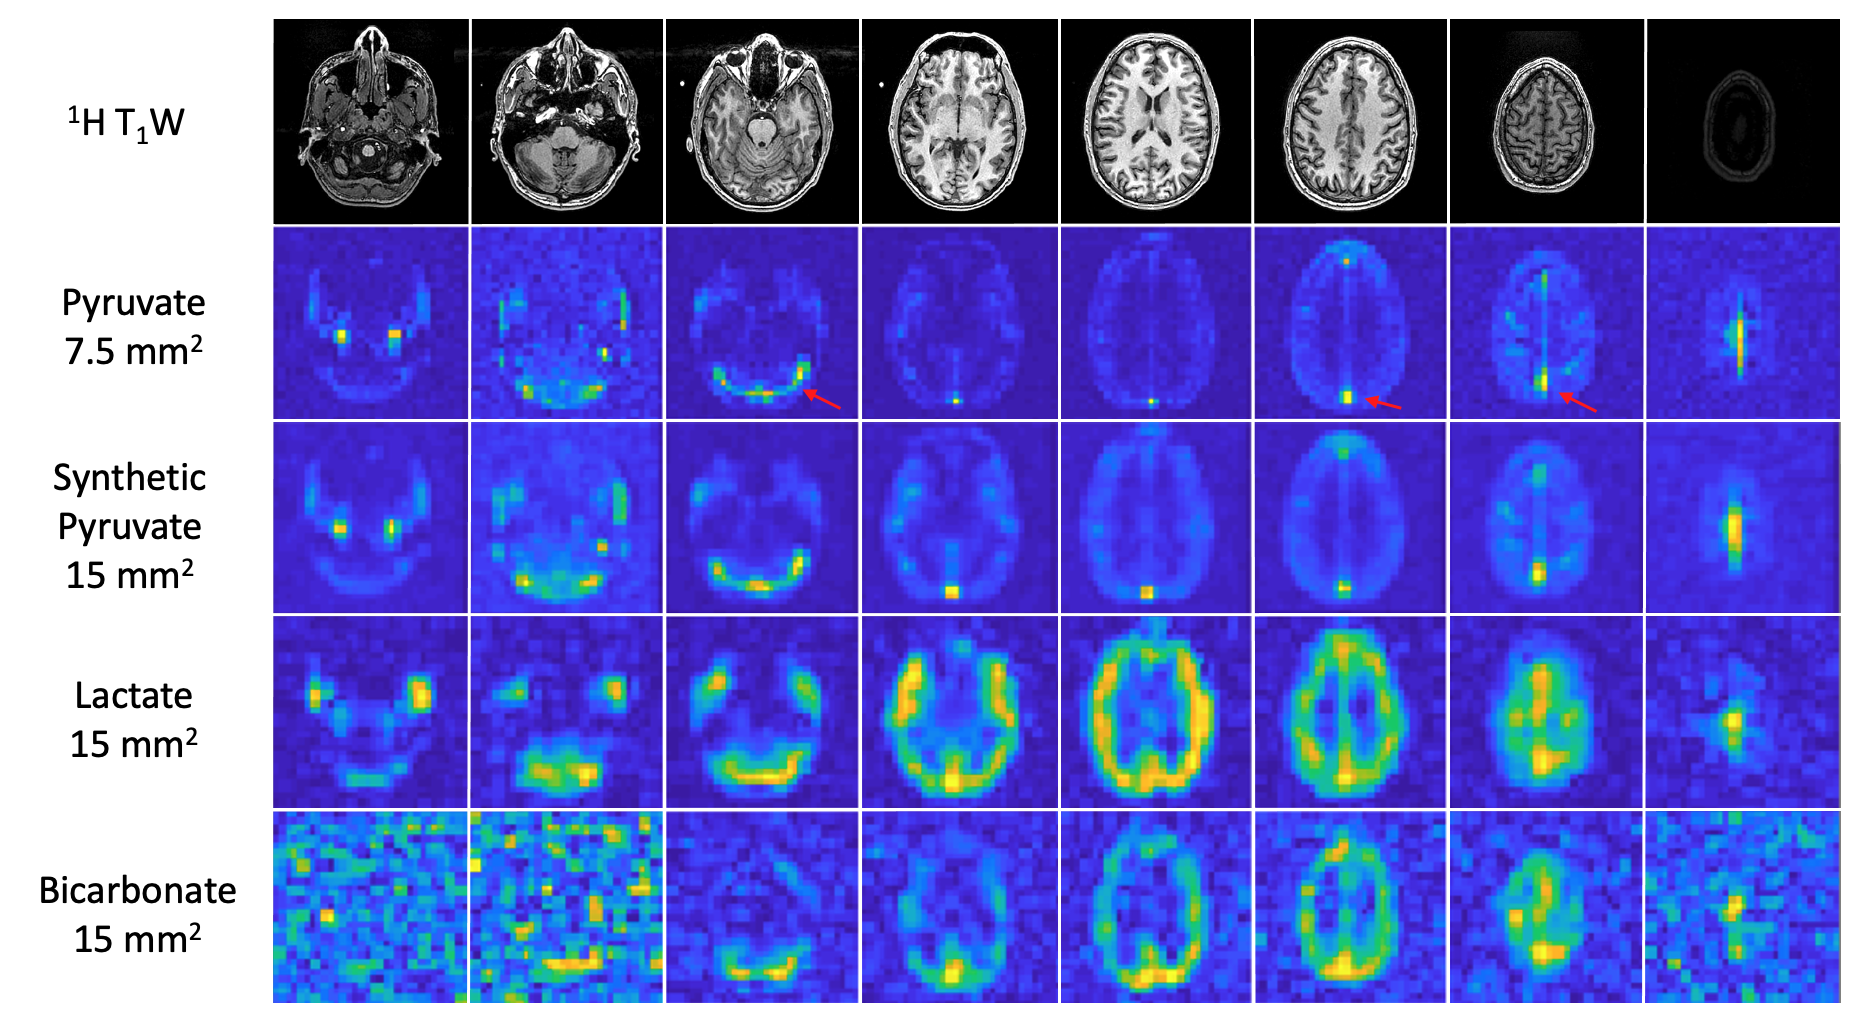
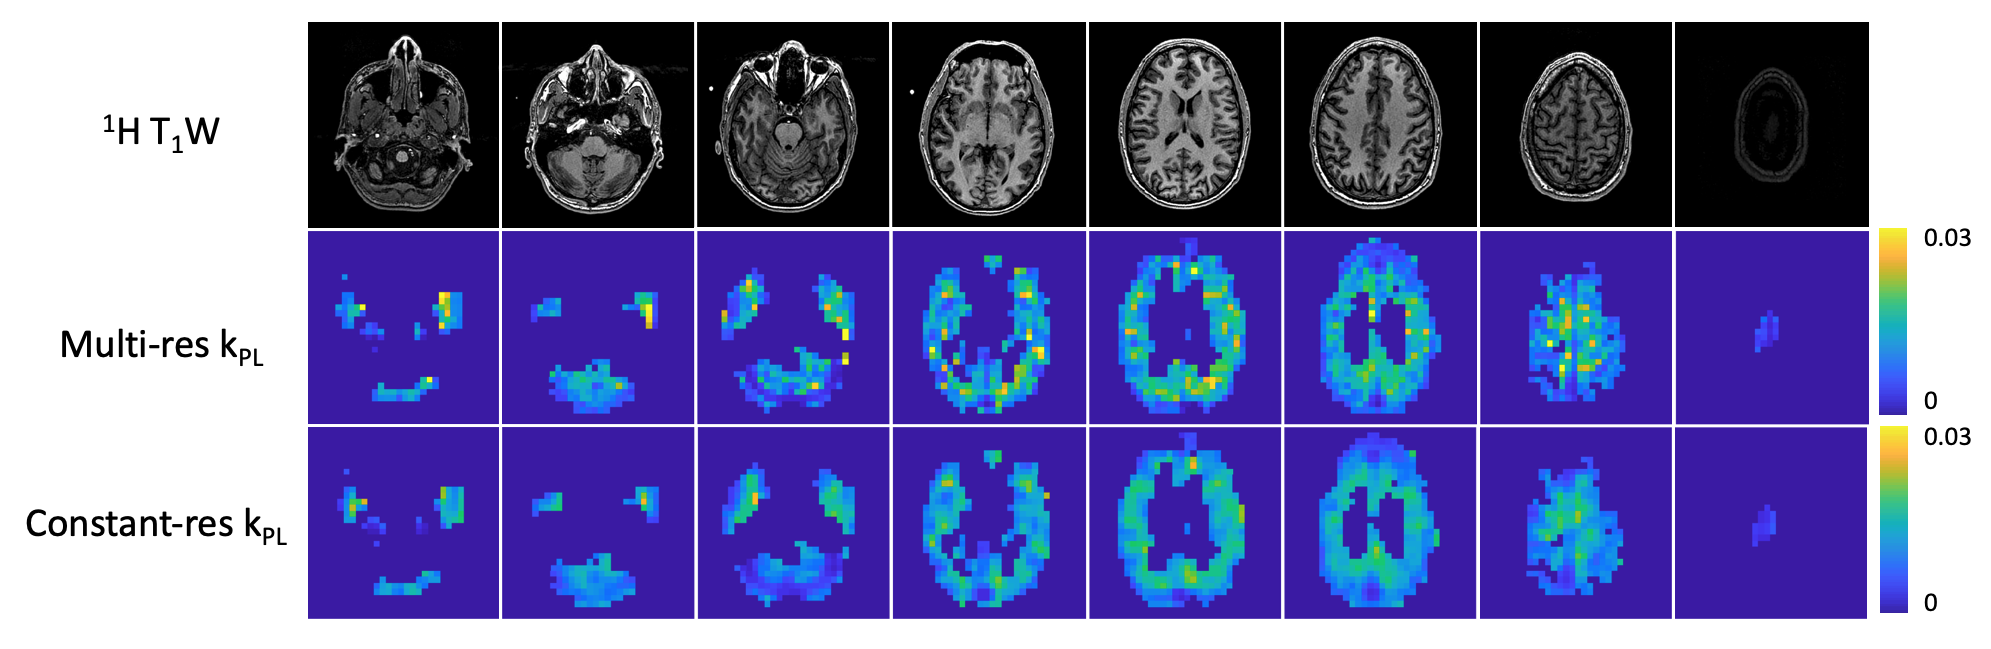
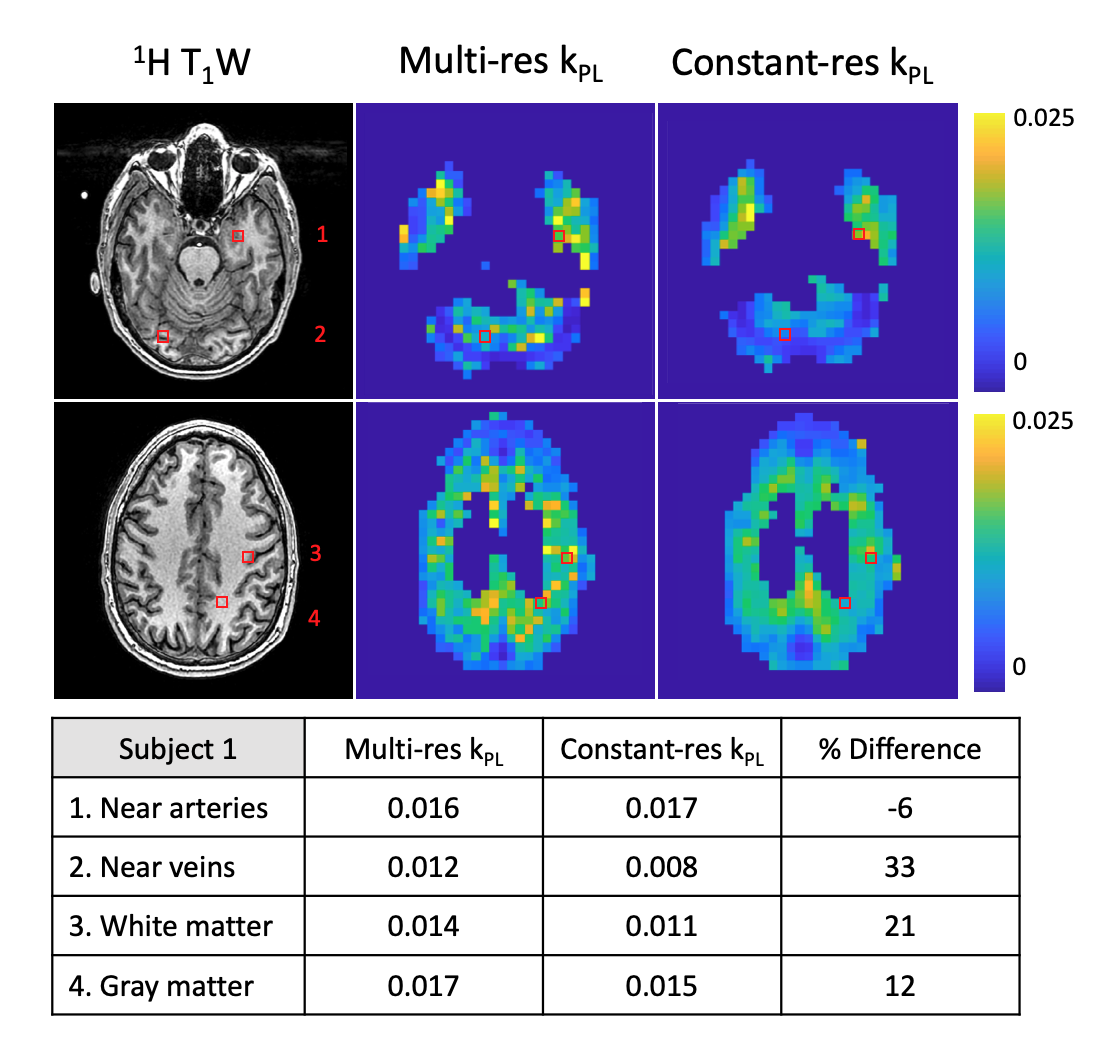
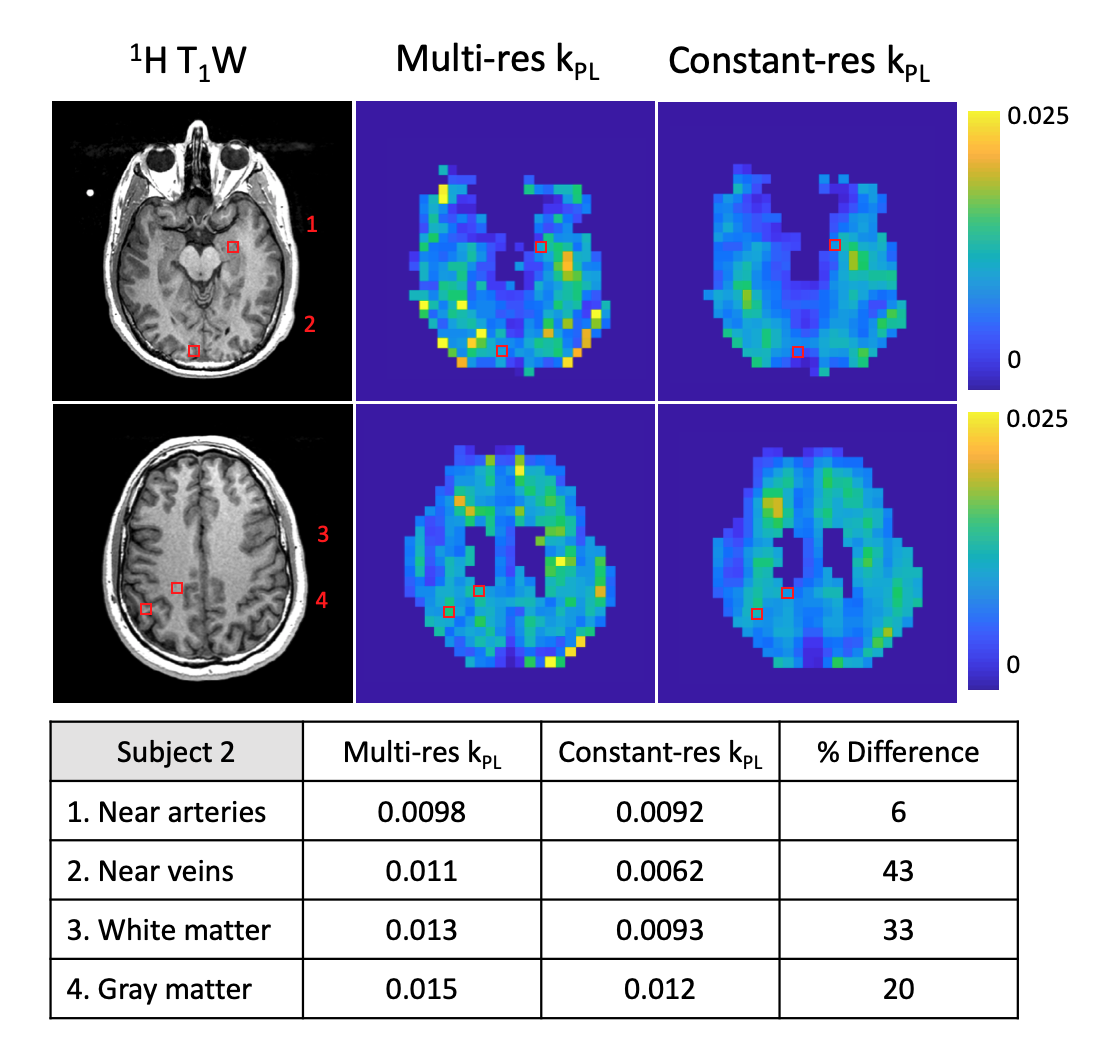
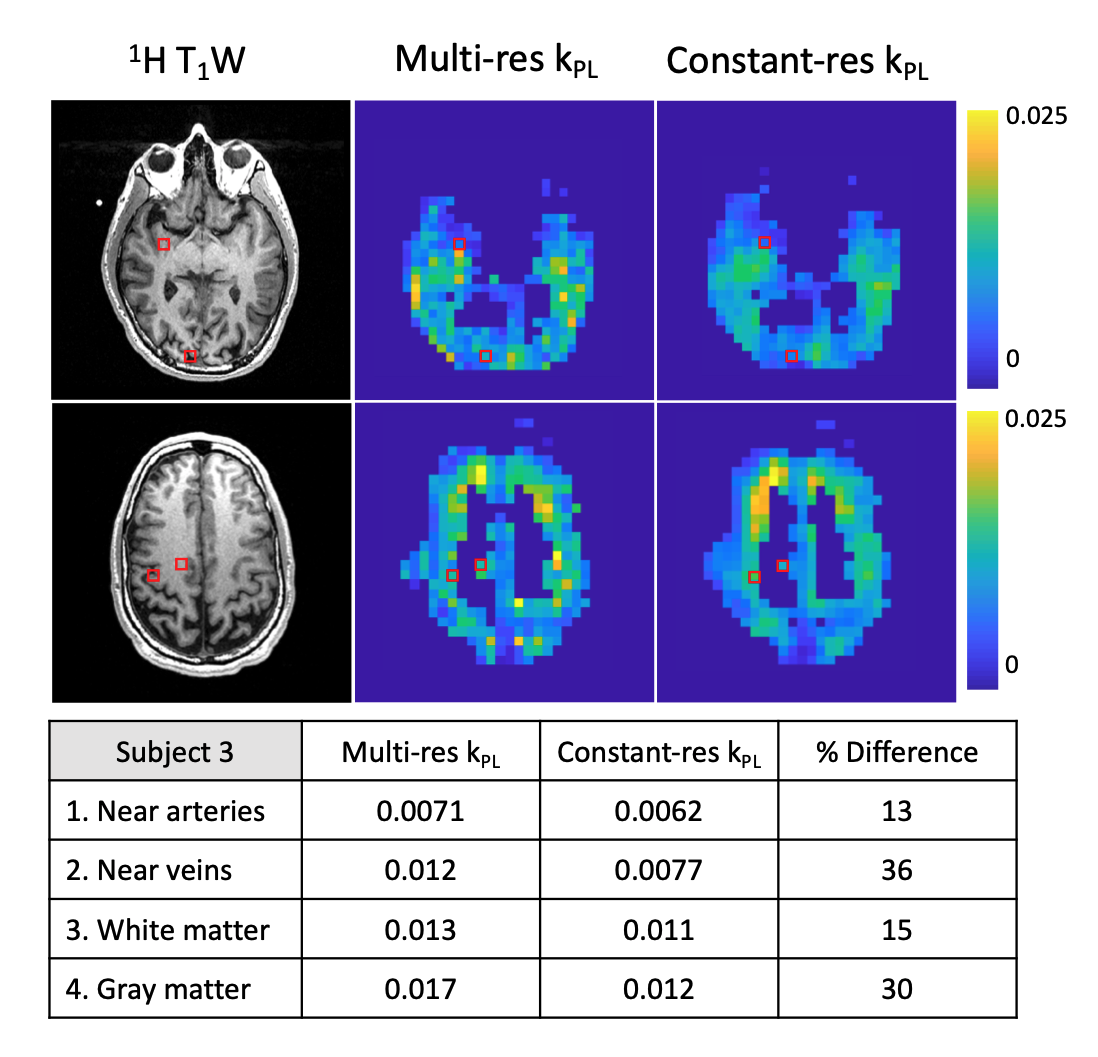
Data from a representative HP [1-13C]pyruvate study are shown in Figure 1, along with the synthetic 15 × 15 mm2 resolution pyruvate data and reference proton images. Compared to the synthetic coarser resolution images, the high-resolution pyruvate images exhibit less partial volume inclusion of high amplitude vascular signals, particularly near the transverse and superior sagittal sinuses. The lactate images had adequate SNR for voxelwise kinetic analysis, while the majority of the bicarbonate signals were below the SNR threshold of 5 needed for a reliable fit. Figure 2 shows the voxelwise kPL maps for the multi-resolution and constant-resolution data referenced in Figure 1. The constant-resolution kPL map shows smoothing of the kinetic rates in the brain as compared to the multi-resolution kPL map. In particular, the low kPL region near the superior sagittal sinus is much larger on the constant-resolution map. In Figures 3 to 5, the kPL values for selected voxels near arteries, veins, and in white and gray matter are displayed for three healthy subjects. The voxels near veins and in the white and gray matter exhibit on average >20% higher kPL for multi-resolution maps than for constant resolution maps, indicating less pyruvate signal spilling over from blood vessels. The voxels near arteries showed changed kPL, but to a lesser degree, indicating less differences in regional pyruvate signal between higher and coarser resolution.Discussion and Conclusion
Acquiring the hyperpolarized [1-13C]pyruvate study with a multi-resolution approach minimizes partial volume effects from vascular pyruvate signals while maintaining the SNR of downstream metabolites. Utilizing higher resolution pyruvate images for kinetic fitting reduced partial volume effects and increased the calculated kinetic rate values, particularly around the superior sagittal sinus and in the white matter where high pyruvate signals spill over from highly perfused regions. This hyperpolarized 13C data showed that acquiring pyruvate with finer resolution improved the quantification of kinetic rates throughout the human brain.Acknowledgements
This research was supported by NIH grants PO1 CA118816, U01 EB026412, and P41 EB013598.References
1. Golman K, Thaning M. Real-time metabolic imaging. Proceedings of the National Academy of Sciences. 2006 Jul 25;103(30):11270-5.
2. Nelson SJ, Kurhanewicz J, Vigneron DB, Larson PE, Harzstark AL, Ferrone M, Van Criekinge M, Chang JW, Bok R, Park I, Reed G. Metabolic imaging of patients with prostate cancer using hyperpolarized [1-13C] pyruvate. Science translational medicine. 2013 Aug 14;5(198):198ra108-.
3. Gordon JW, Niles DJ, Adamson EB, Johnson KM, Fain SB. Application of flow sensitive gradients for improved measures of metabolism using hyperpolarized 13C MRI. Magnetic resonance in medicine. 2016 Mar;75(3):1242-8. 3.
4. Gordon JW, Chen H-Y, Autry A, Park I, Van Criekinge M, Mammoli D, Milshteyn E, Bok R, Xu D, Li Y, Aggarwal R, Chang S, Slater JB, Ferrone M, Nelson S, Kurhanewicz J, Larson PEZ, Vigneron DB. Translation of Carbon-13 EPI for hyperpolarized MR molecular imaging of prostate and brain cancer patients. Magnetic Resonance in Medicine 2018;0(0).
5. Gordon JW, Autry AW, Tang S, Graham JY, Bok RA, Zhu X, Villanueva‐Meyer JE, Li Y, Ohilger MA, Abraham MR, Xu D. A variable resolution approach for improved acquisition of hyperpolarized 13C metabolic MRI. Magnetic Resonance in Medicine. 2020 Dec;84(6):2943-52.
6. Mammoli D, Gordon J, Autry A, Larson PE, Li Y, Chen HY, Chung B, Shin P, Van Criekinge M, Carvajal L, Slater JB. Kinetic modeling of hyperpolarized carbon-13 pyruvate metabolism in the human brain. IEEE transactions on medical imaging. 2019 Jul 2;39(2):320-7.
Figures