3585
In Vivo T2* of Hyperpolarized 13C-Metabolites in Human Brain, Heart, Kidney, and Spleen: An Imaging Approach1Advanced Imaging Research Center, UT SOUTHWESTERN MEDICAL CENTER, Dallas, TX, United States, 2GE Healthcare, Dallas, TX, United States, 3GE Healthcare, Munich, Germany, 4Internal Medicine, UT Southwestern Medical Center, Dallas, TX, United States, 5Radiology, UT Southwestern Medical Center, Dallas, TX, United States, 6Electrical and Computer Engineering, UT Dallas, Richardson, TX, United States
Synopsis
Multi-echo 13C spiral imaging sequence combined with a spectral-spatial radiofrequency pulse can measure T2* of 13C-labeled metabolite signals in vivo. In this study, we measured T2*s of hyperpolarized [1-13C]pyruvate and products in human heart, brain, kidney and spleen.
Background
Hyperpolarized (HP) [1-13C]pyruvate imaging is rapidly being translated to humans. Detection of metabolic products such as [1-13C]lactate, [13C]bicarbonate and [1-13C]alanine from HP pyruvate provides direct access to metabolic conditions in organs of interest.1–3 Although the T2s of 13C-labeled pyruvate and the products are reportedly long,4,5 the in vivo T2*s, which are critical for gradient-recalled echo (GRE)-based data acquisitions, are yet poorly understood. Previously, we implemented a metabolite-selective multi-echo spiral imaging (MESI) sequence for measuring T2*s of in vivo HP signals in rats.6 In this study, we compared T2*s of HP [1-13C]pyruvate, [1-13C]lactate, [1-13C]alanine, and [13C]bicarbonate in human heart, brain, kidney, and spleen of healthy subjects.Methods
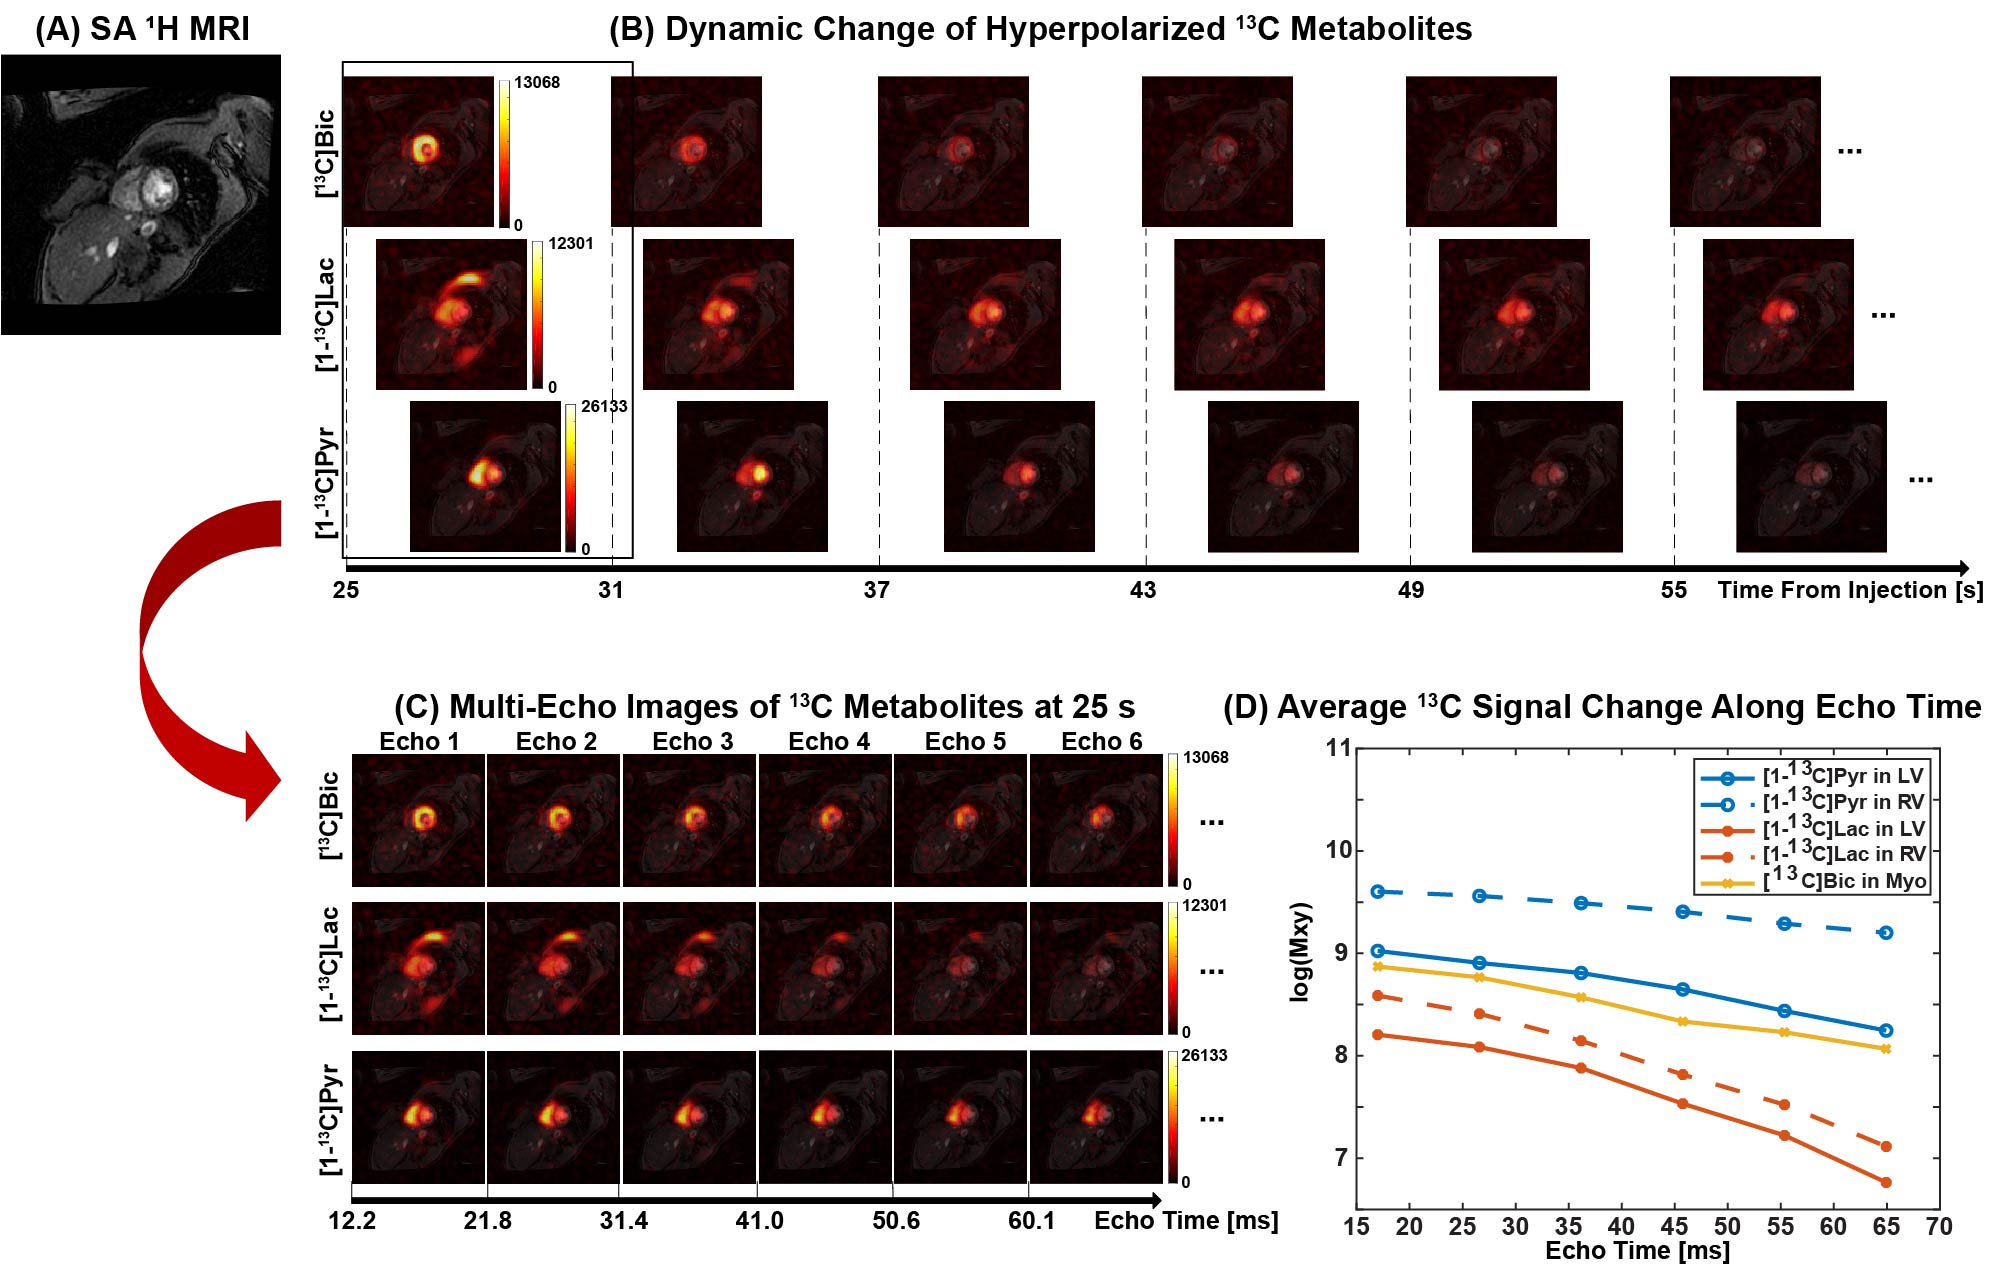
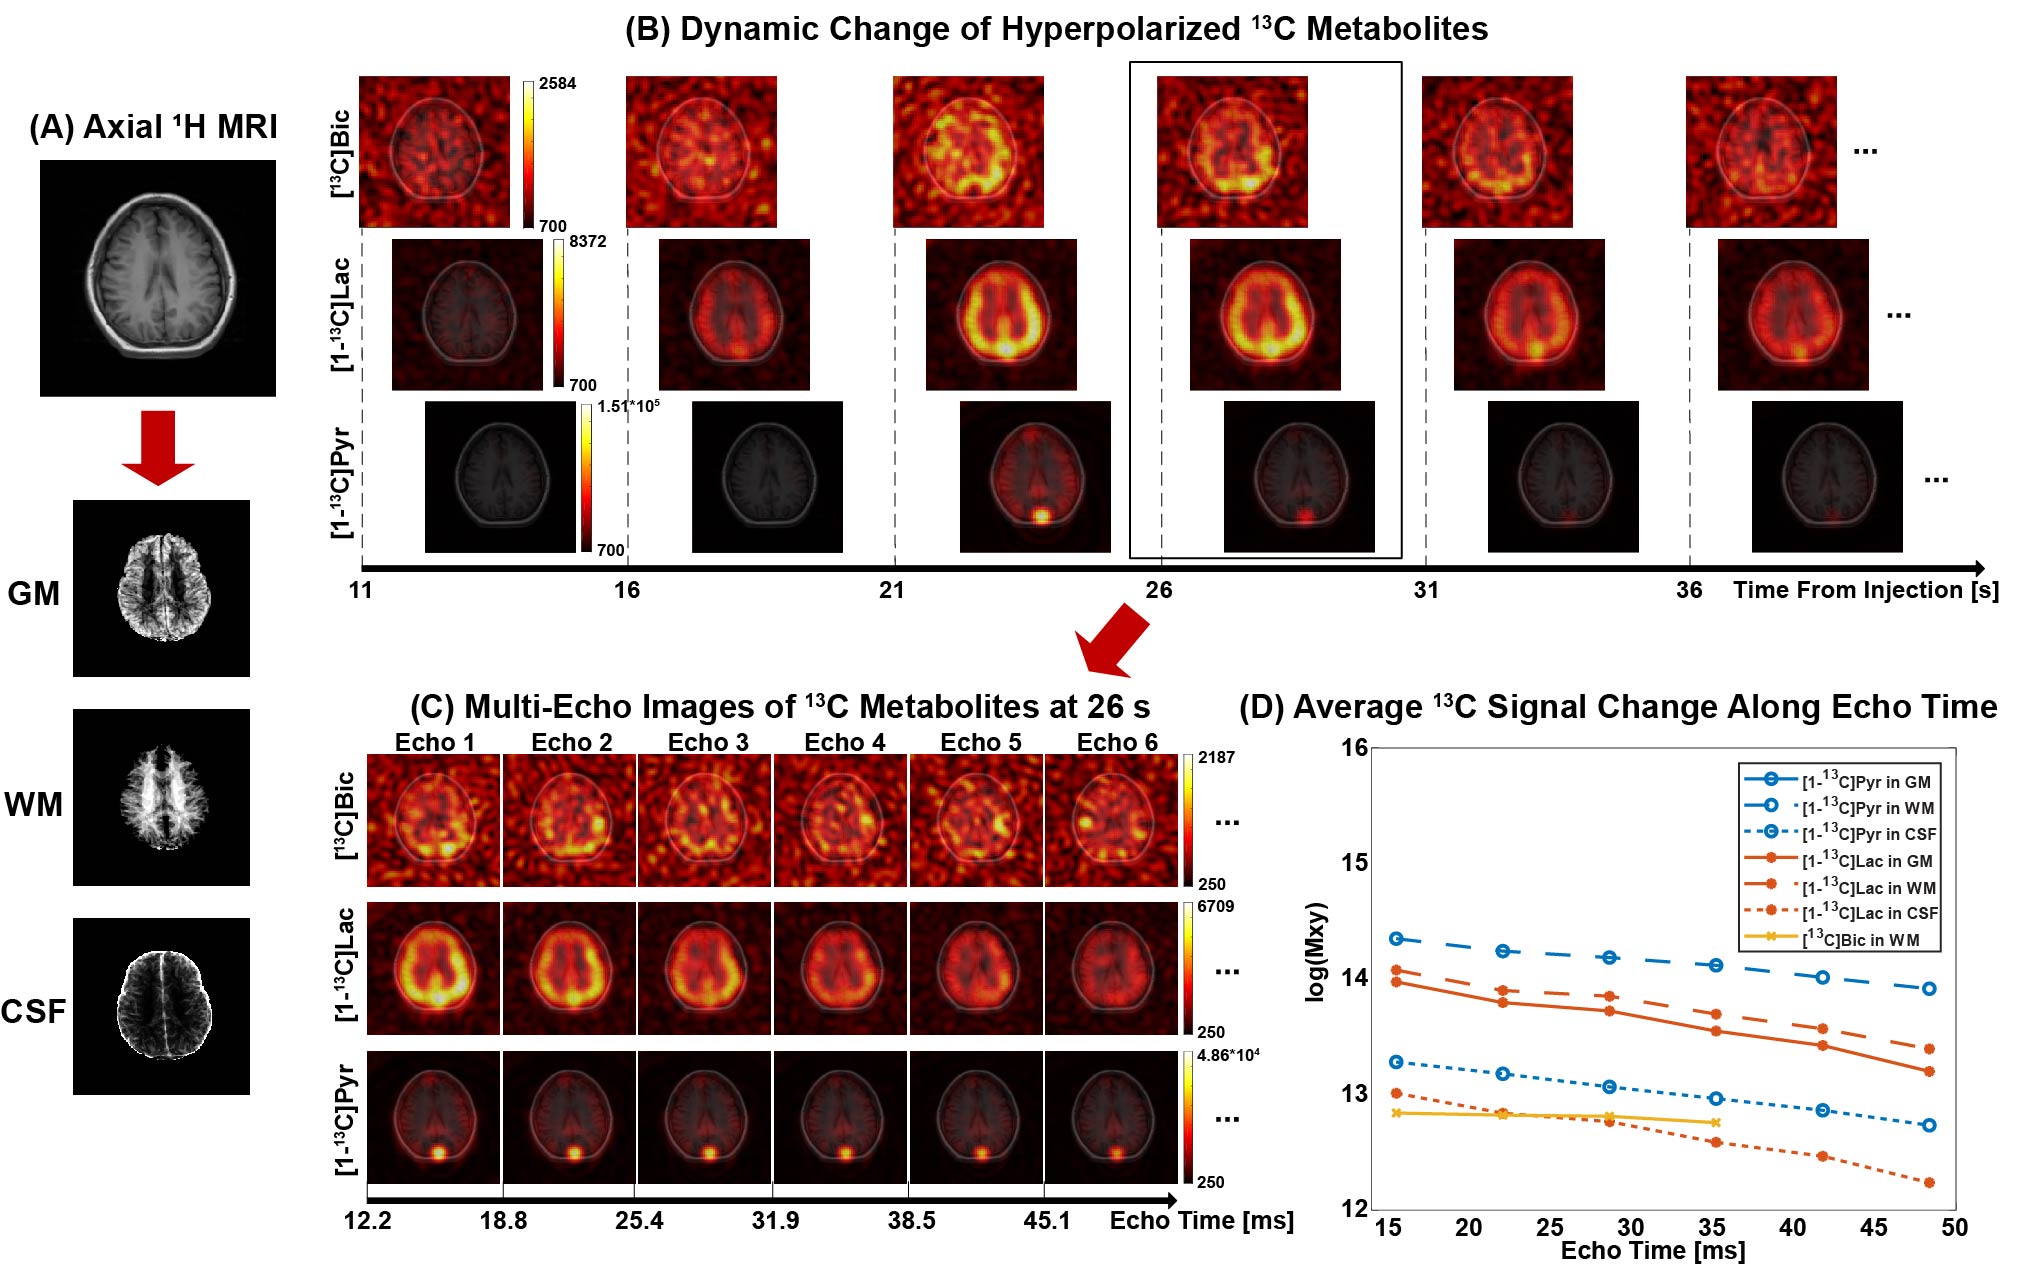
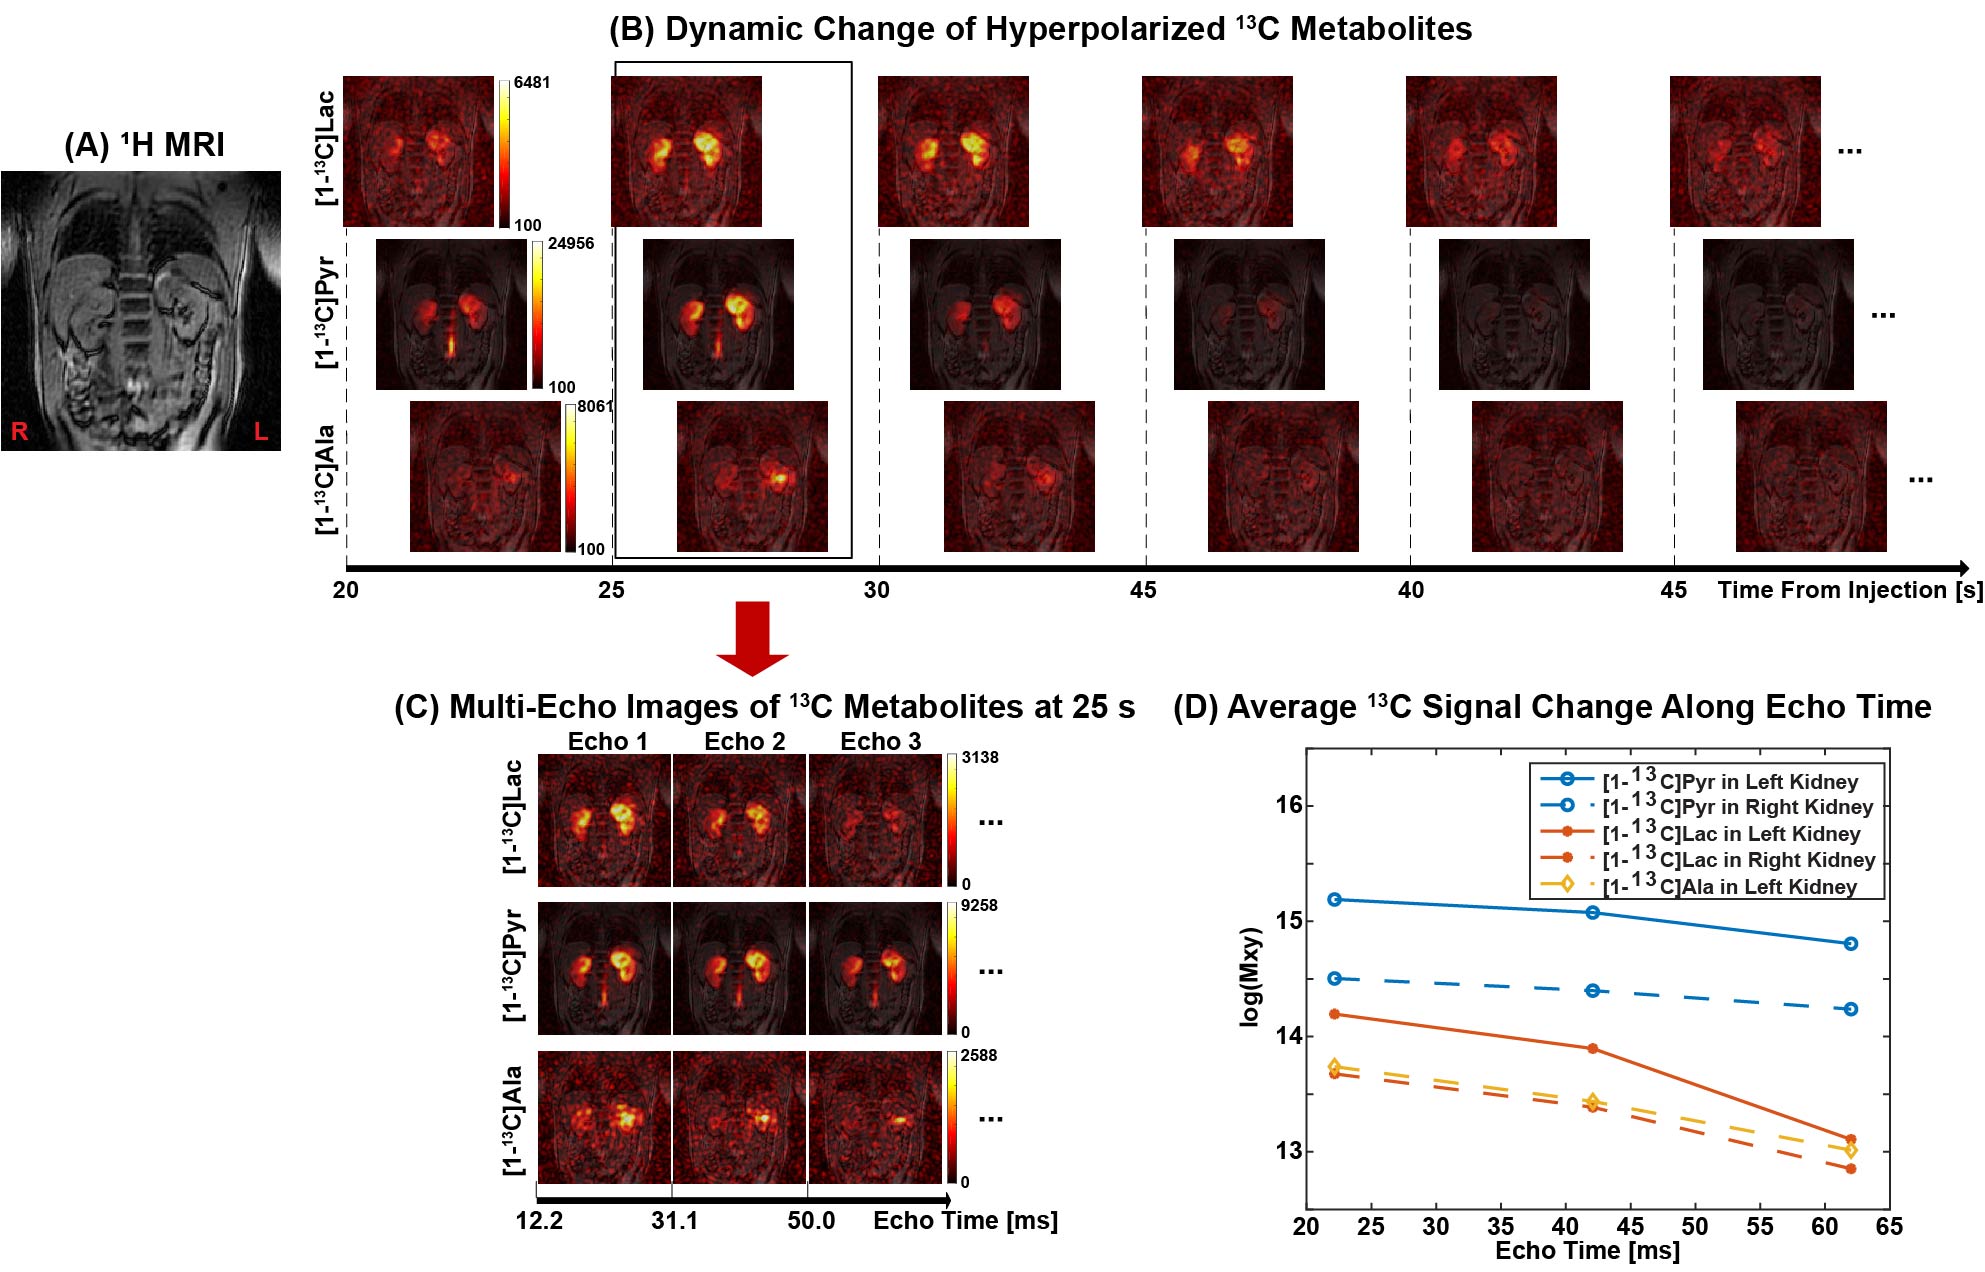
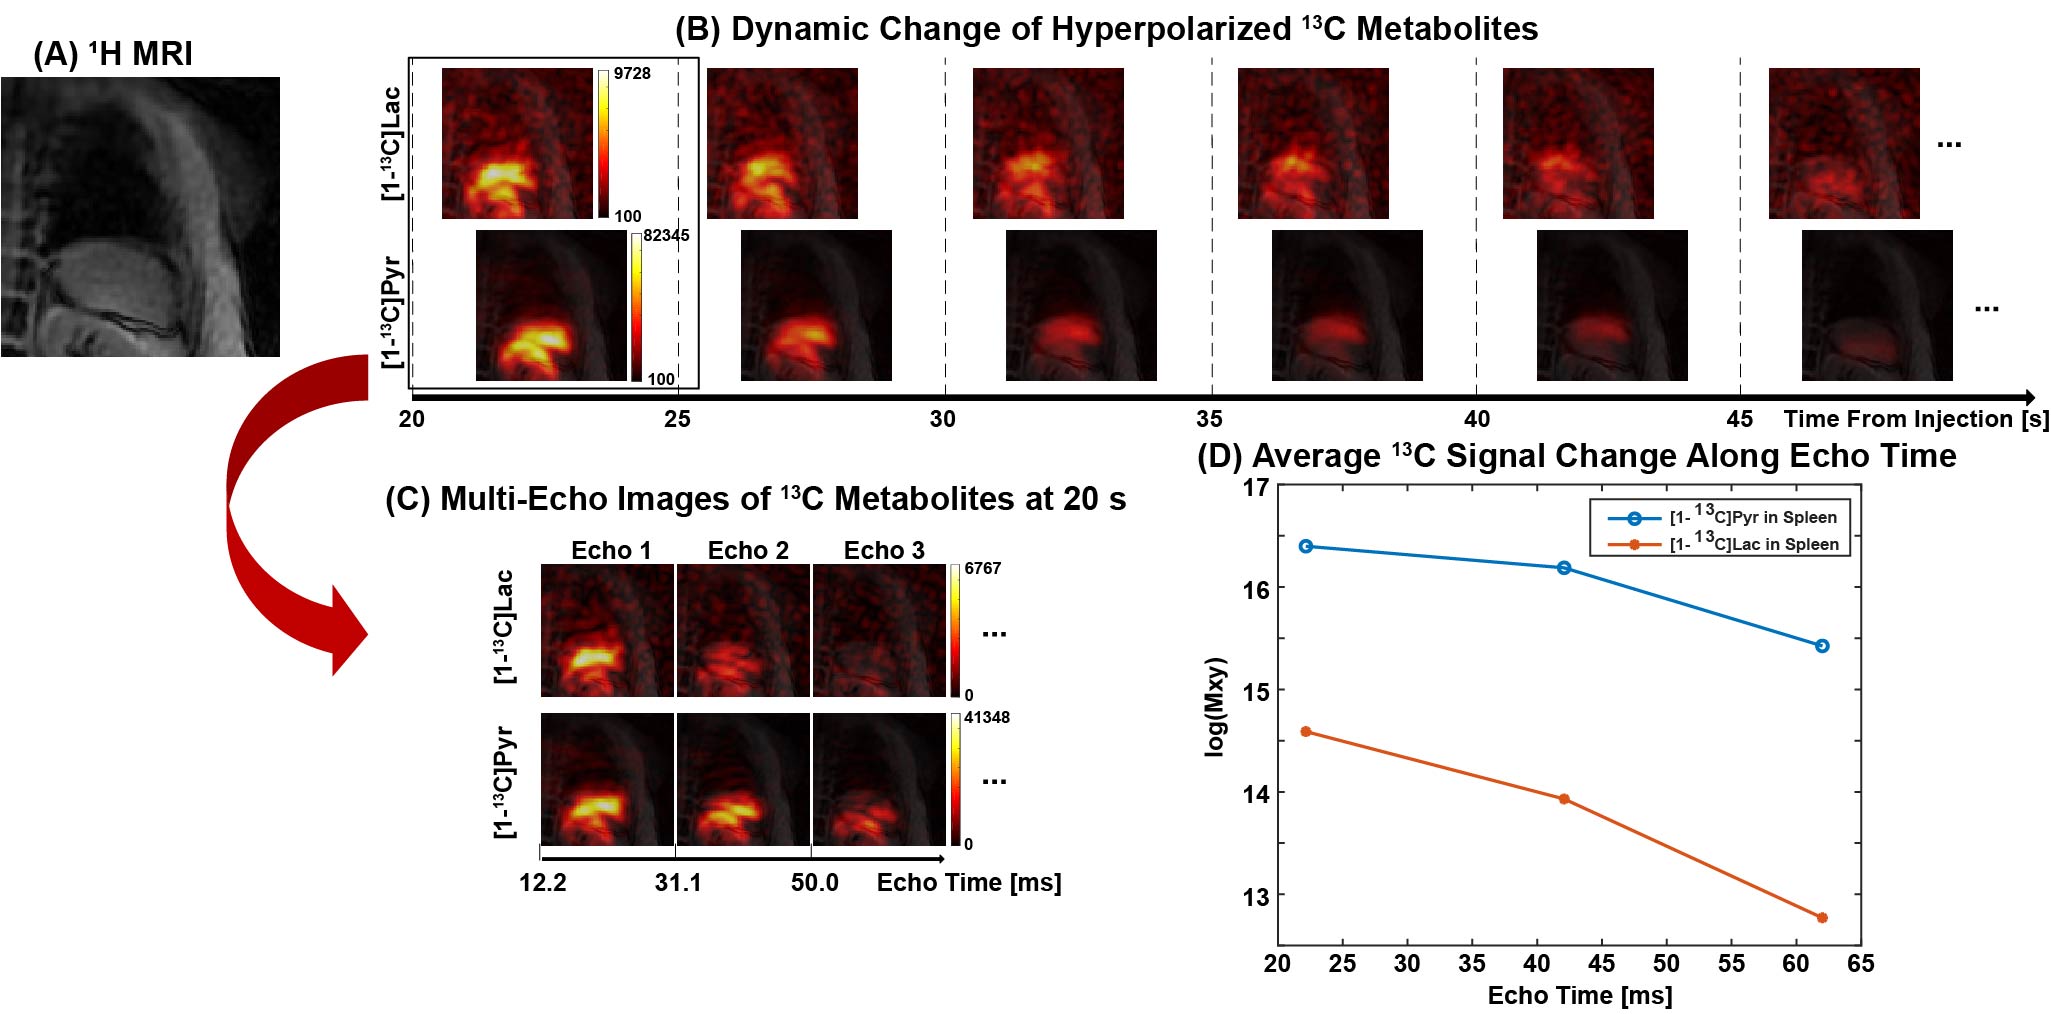
The MESI acquisition consists of a spectral-spatial RF pulse and subsequent multiple short spiral readouts. In this study, 4 healthy subjects were recruited and imaged by the MESI for HP [1-13C]pyruvate imaging of heart (female, 38 y.o.), brain (female, 19 y.o.), kidney (male, 33 y.o.) and spleen (female, 57 y.o.), respectively. All the data were acquired using a 3T 750w wide-bore MR scanner and a SPINlab polarizer (GE Healthcare, Waukesha, WI USA). For heart, kidney and spleen imaging, a two-loop 13C transmit-receive Helmholtz coil was used (diameter = 20 cm; PulseTeq Limited, Chobham, Surrey, UK). Brain imaging was conducted with a 13C/1H dual-frequency birdcage RF coil (Clinical MR Solutions, Brookfield, WI USA).7 GMP-grade [1-13C]pyruvic acid (Sigma Aldrich, St. Louis, MO USA) was prepared in clinical fluid paths (0.40 mL/kg body weight of 250-mM HP [1-13C]pyruvate solution). After 3 – 4 hrs of polarization, the dissolved HP [1-13C]pyruvate solution was validated by the QC and administered intravenously to subjects (injection rate = 5 mL/s), followed by a 25-mL saline flush. Multi-echo images were acquired using the MESI sequence in the order of [13C]bicarbonate, [1-13C]lactate, [1-13C]pyruvate and [1-13C]alanine (kidney only) at each timepoint. Field-of-view (FOV), nominal spatial resolution and #echoes were prescribed differently for each organ: FOV = 40 cm × 40 cm (heart, kidney and spleen) and 24 cm × 24 cm (brain), spatial resolution = 1.6 cm × 1.6 cm (heart), 1.0 cm × 1.0 cm (kidney and spleen) and 1.5 cm × 1.5 cm (brain), # echoes = 6 (heart), 3 (kidney and spleen) and 8 (brain). For all organs, slice thickness was set to 30 mm and flip angles were 90° for products and 10° for pyruvate. For brain, kidney and spleen, 16 timepoints were acquired with temporal resolution of 5 s with 15 s of delay between the start of HP injection and the start of data acquisition. For cardiac imaging, the subject was instructed to hold their breath in expiration for ~20 s, followed by a shallow breathing to minimize the respiratory motion, and the images were acquired with ECG gating. T2*s of HP metabolites from each timepoint were calculated by fitting the decay rate of the spatially-averaged signal within structurally identified tissue compartments (heart: left ventricle (LV), right ventricle (RV) and myocardium (Myo); brain: grey matter (GM), white matter (WM) and cerebrospinal fluid (CSF); kidney: left kidney and right kidney) along the echo times as mono-exponential functions using MATLAB, and at least the first 3 echoes were used for the fitting depending on the signal to noise ratios (SNRs).Results and Discussion
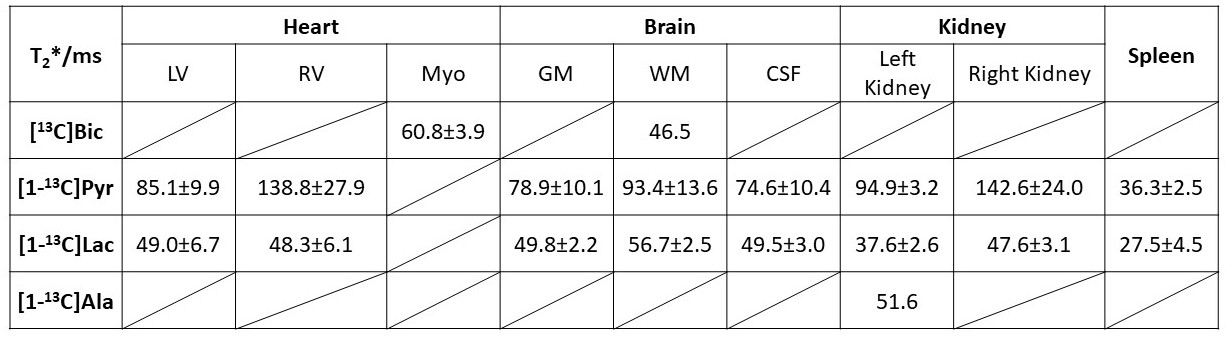
Fig. 1 shows the T2* measurement of HP 13C-labeled metabolites for human heart in a short-axis ventricle view. The multi-echo images of each metabolite were fitted along echo times mono-exponentially in LV, RV and Myo to measure the T2*s. Similarly, the results from T2* measurement of the in vivo HP 13C-labeled metabolites in brain, kidney and spleen are shown in Fig. 2, Fig. 3 and Fig. 4, respectively. Time-averaged T2*s of HP metabolites for each organ are summarized in Table 1. For all of the 13C-labeled metabolites, T2*s measured from different timepoint for each organ were consistent along time (coefficients of variation < 0.20). [1-13C]Pyruvate exhibited the longest T2* in all these organs, ranging from 36.3 ms to 142.6 ms. The T2* of in vivo [1-13C]lactate also varied in different organs from 27.5 ms to 56.7 ms. Due to the low SNR, the T2*s of HP [13C]bicarbonate could be measured only from Myo (60.8±3.9 ms) in heart and WM (46.5 ms) in brain, and T2* of [1-13C]alanine was measured only in the left kidney (51.6 ms). The largely varying T2*s of HP 13C-metabolites in different organs/compartments are likely due to various contributing factors such as off-resonance effects and blood flow. In future studies, more subjects will be recruited to investigate the in vivo T2*s of HP 13C-labeled metabolites in each organ, with acquisition of additional information such as B0 map and perfusion.Conclusion
In summary, we measured the in vivo T2*s of HP [13C]bicarbonate, [1-13C]lactate, [1-13C]pyruvate and [1-13C]alanine from human heart, brain, kidney, and spleen. The T2*s of 13C-labeled signals will provide insights of in vivo pyruvate metabolism and play critical roles in designing k-space readout trajectories and quantifying the HP metabolites.Acknowledgements
Personnel Support: We appreciate the clinical research team and the supporting staffs of the Advanced Imaging Research Center at UT Southwestern – Jeff Liticker, PharmD, Ronald G. Hall, PharmD, Jaffar Raza, PharmD, Jeannie Baxter, RN, Kelley Derner, RN, Salvador Pena, Corey Mozingo, Maida Tai, and Richard Martin.
Funding: The Texas Institute for Brain Injury and Repair; National Institutes of Health of the United States (R01 NS107409, P41 EB015908); The Welch Foundation (I-2009-20190330); UT Dallas Collaborative Biomedical Research Award (UTD 1907789); The Cancer Prevention and Research Institute of Texas (RP180404).
References
- Cunningham, C. H., et al. Hyperpolarized 13C Metabolic MRI of the Human Heart. Initial Experience.Circulation Research. 2016;119:1177–1182.
- Grist, J. T., et al. Quantifying normal human brain metabolism using hyperpolarized 1-13Cpyruvate and magnetic resonance imaging. NeuroImage. 2019;189:171–179.
- Park, I. et al. Development of methods and feasibility of using hyperpolarized carbon-13 imaging data for evaluating brain metabolism in patient studies. Magnetic resonance in medicine. 2018;80:864–873.
- Yen, Y.-F., et al. T2 relaxation times of 13C metabolites in a rat hepatocellular carcinoma model measured in vivo using 13C-MRS of hyperpolarized [1-13C]pyruvate. NMR in biomedicine. 2010;23:414–423.
- Joe, E., et al. An indirect method for in vivo T2 mapping of [1-13C]pyruvate using hyperpolarized 13C CSI. NMR in biomedicine. 2017;30.
- J. Ma, et al. In Vivo T2* Mapping of Hyperpolarized 13C-Labeled Metabolites Using a Metabolite-Selective Multi-Echo Spiral Imaging Sequence. Proceedings of the ISMRM 2020. #3051.
- J. Ma, et al. Development of 1H/13C RF Head Coil for Hyperpolarized 13C Imaging of Human Brain. Proceedings of the ISMRM 2019, Montreal, Canada. #568.
Figures