3584
Magnetic Resonance Imaging Comparisons of Renal Cell Carcinoma Patient-derived Xenografts1Department of Radiology and Biomedical Imaging, University of California San Francisco, University of California San Francisco, San Francisco, CA, United States, 2Department of Urology, Stanford University, Stanford, CA, United States
Synopsis
We demonstrated substantial morphologic and glycolytic metabolic differences using proton and hyperpolarized 13C magnetic resonance imaging, respectively between and within RCC patient derived xenografts (PDXs). Our findings showed substantial inter-PDX differences in tumor growth rates, as well as the cystic and necrotic components. Furthermore, the xenograft (XEN) established from cell lines derived from the PDX showed significant morphological differences from the parent PDX. Interestingly, upon comparison of two subsequent passages of the same PDX, we found that while the morphological similarities persisted, the glycolytic capacity was significantly increased in the latter passage, implying natural selection of the more aggressive cells.
Introduction
Renal cell carcinoma (RCC) is the 16th most common cause of cancer death globally1. Predictive preclinical models of RCC are needed to improve all aspects of RCC clinical management from diagnosis to prognosis to treatment. Clear cell RCC (ccRCC), the most common type of RCC (~70% of all RCC cases), is a genetically heterogeneous and complex disease necessitating the use of patient derived xenografts (PDX) as they have been shown to retain histopathologic, immunophenotypic, and genotypic features of the original patient tissues. Patient-derived models of RCC exhibit upregulated glycolysis, one of the hallmarks strongly implicated in the development and progression of RCC. Our study focused on phenotypic comparisons of metabolism and morphology in PDXs using hyperpolarized 13C and proton magnetic resonance (1H-MR), respectively. Hyperpolarization, achieved through the dynamic nuclear polarization technique, provides unprecedented gain in sensitivity for imaging in real time the classic Warburg effect, an elevation of glycolysis in the presence of oxygen that is exhibited by RCC, and has already been shown to assess RCC aggressiveness noninvasively2. These PDXs established from both serially passaged patient tissue in mice as well as PDX-derived cell culture xenografts (XEN), which once fully characterized using MR will help choose optimal models for imaging to accelerate drug screening and imaging biomarker discovery.Methods
All MR studies were performed on a preclinical 3T Bruker system. PDXs were established from RCC tissues obtained from nephrectomized3,4 samples as previously described in immunodeficient mice. XENs were generated from harvested PDXs that were subsequently cultured after single-cell digestion in petri dishes and reimplanted in the renal capsule5. The histogram analysis of the proton signals were used to assess the cystic and necrotic composition (greater or lesser than 3 standard deviations from the mean tumor intensity, respectively).1H diffusion and dynamic 13C HP MR post [1-13C]Pyruvate infusion were acquired using a dual tuned 1H/13C volume coil once the tumor volume reached ~0.8cc monitored using weekly T2-weighted images. Then, 400uL 80mM [1-13C]Pyruvate was injected intravenously over 12s, and images were acquired beginning 10s after the start of the injection. Fifteen dynamic 13C spectra points were acquired over 45s by using 2D chemical shift images (CSI) and the following parameters: slice thickness of 8mm, FOV 32mm x 32mm, matrix 8 x 8, flip 10°. SIVIC was used to obtain lactate and pyruvate maps. MR imaging analysis was performed using MATLAB. Kruskal-Wallis tests with Dunn’s multiple comparisons post-test were used for comparisons amongst PDXs. Mann-Whitney tests were used to compare a PDX and its xenograft.Results and Discussion
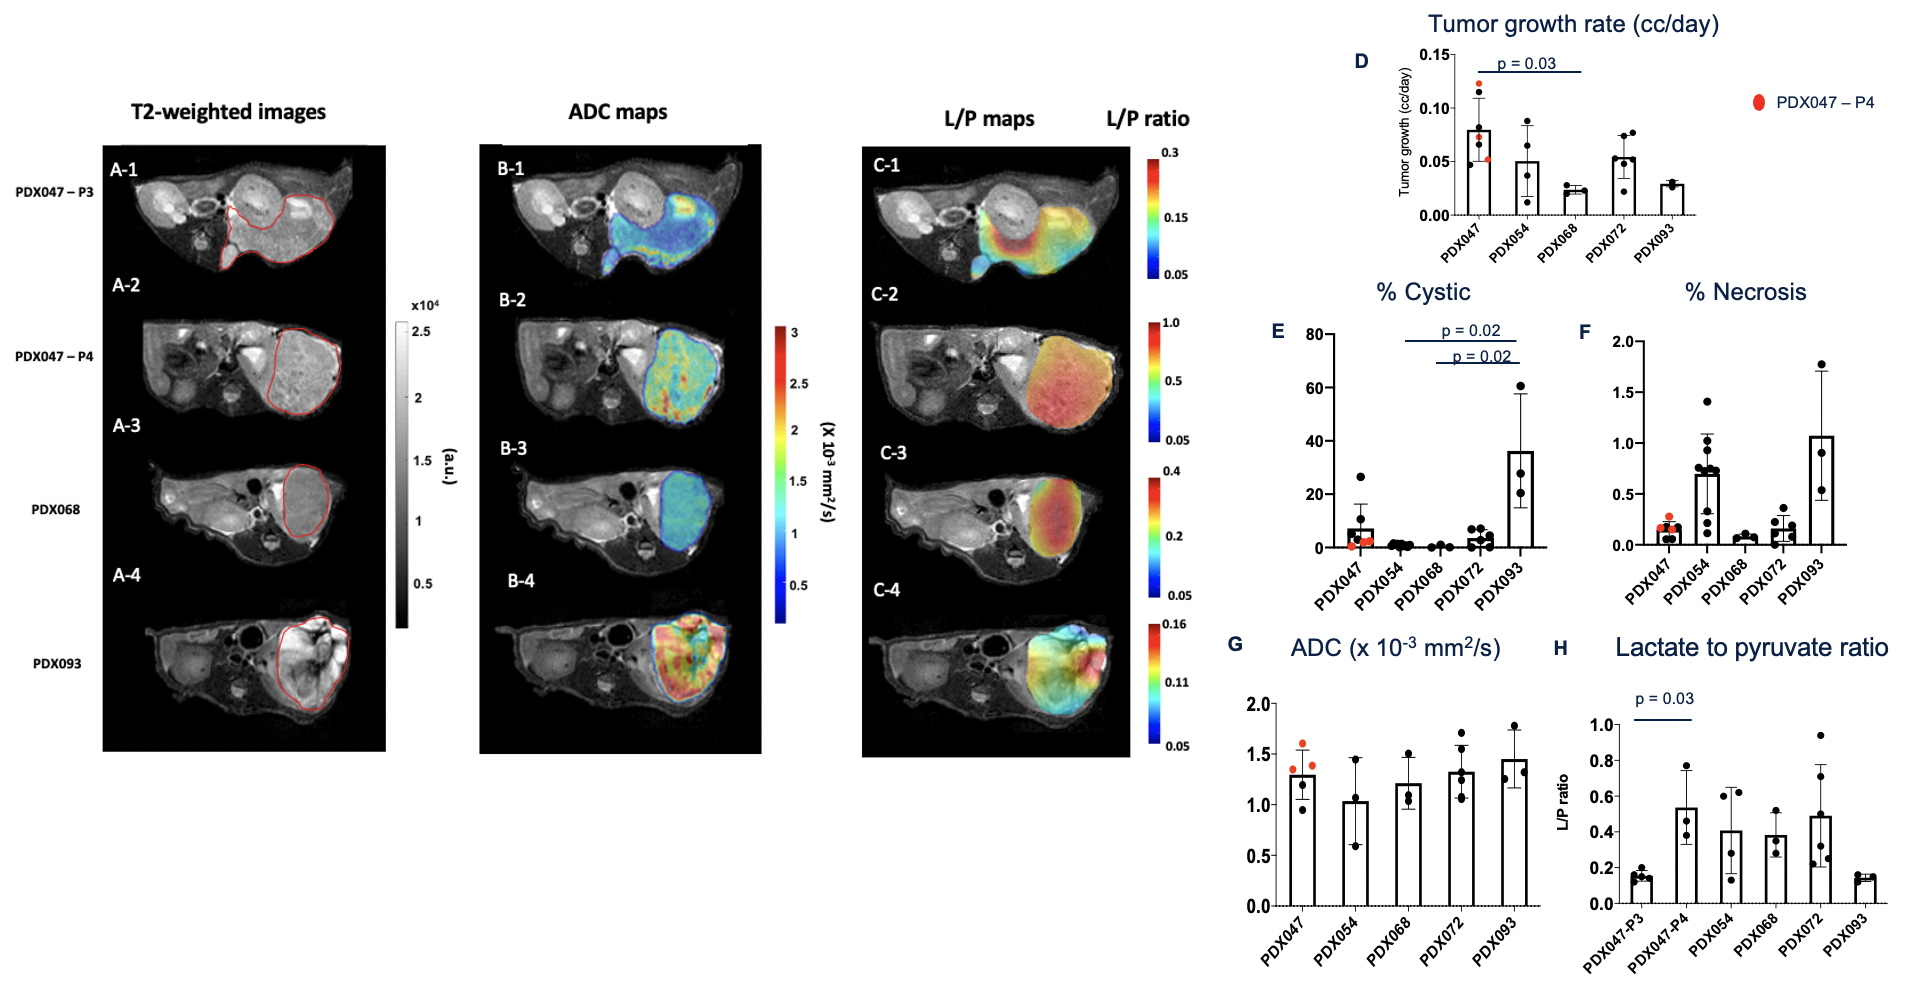
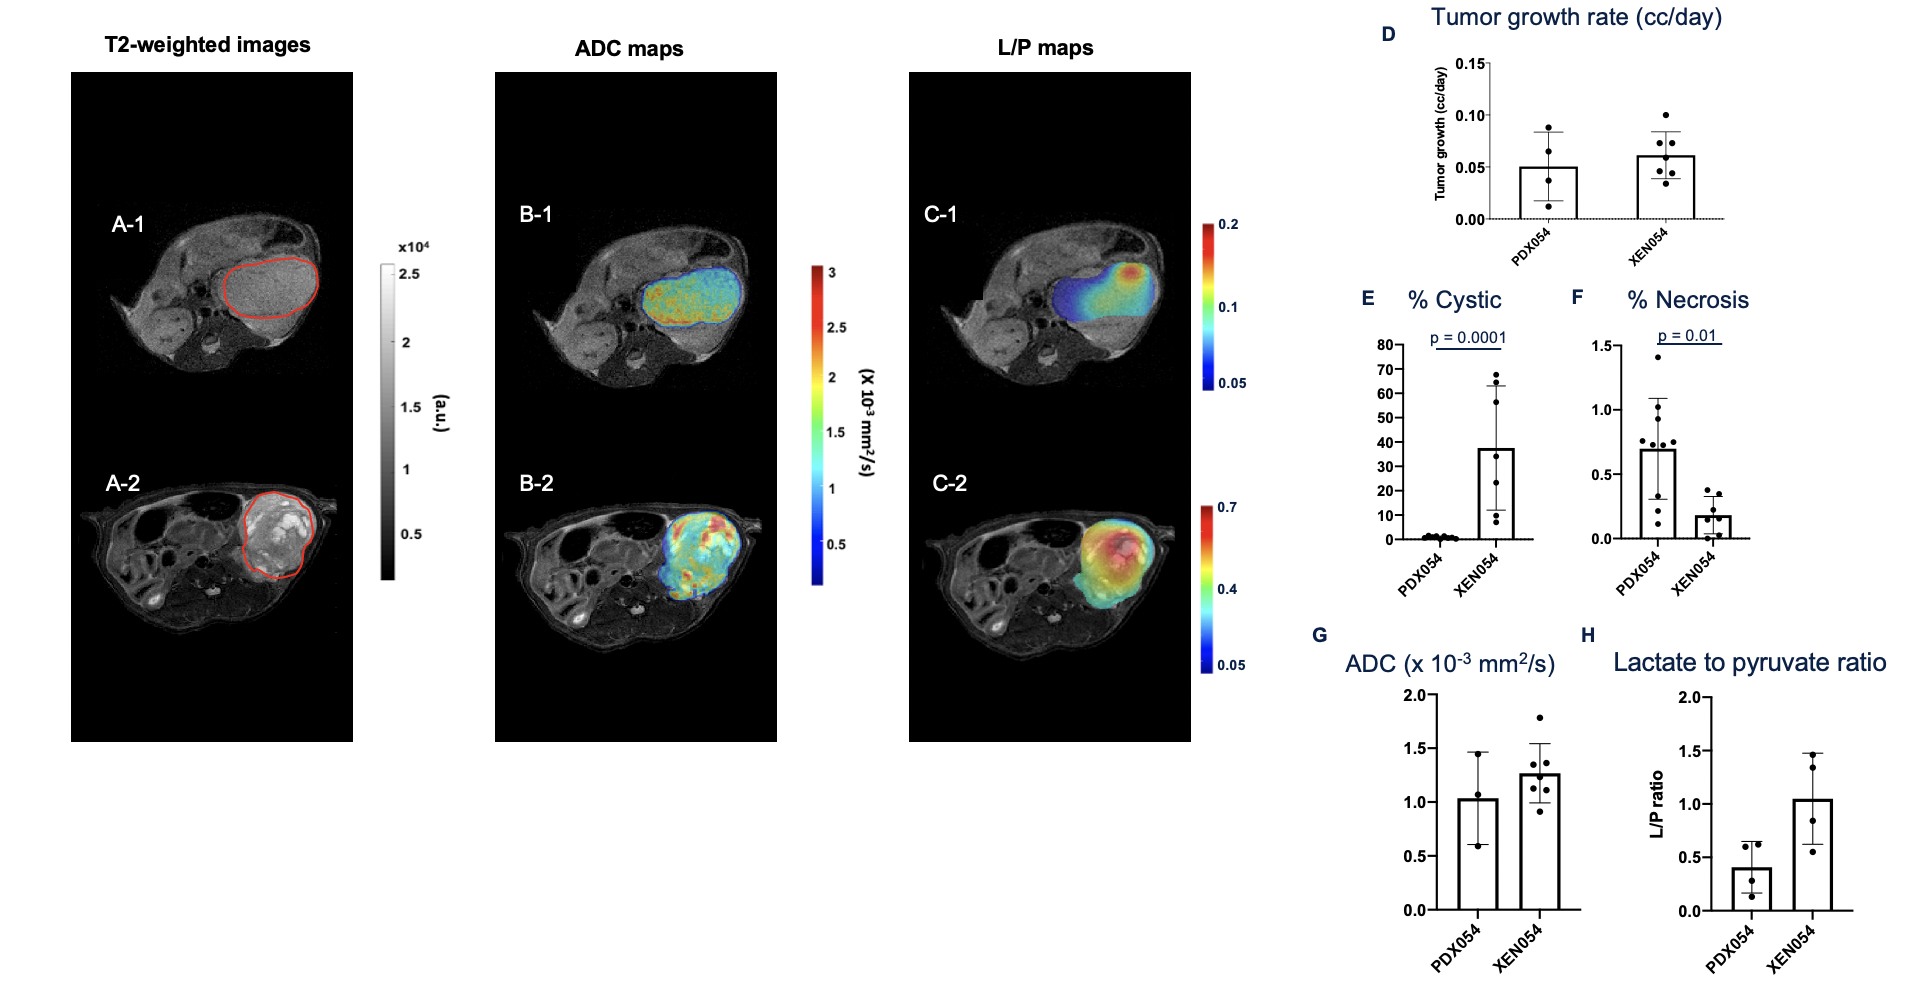
Figures 1 and 2 A-C show representative 1H-and-13C images of tumors from different PDXs and between a PDX and its XEN, respectively, showcasing the remarkable morphologic and metabolic heterogeneity of these models. The tumor growth rate was different between PDXs (p = 0.035) with PDX047 being the fastest growing (Fig1.D). PDX093 was significantly more cystic than PDX054 (p = 0.023) and PDX068 (p = 0.018) (Fig1.E) while the necrosis was heterogeneous across the PDXs with no significant differences (Fig1. F). Mean ADC values were similar between the different PDXs (~1.26 x 10⁻³ mm2/s) and similar to clinical values observed for RCC1 (Fig1.G). Interestingly, the conversion of pyruvate to lactate was different amongst the PDXs (p = 0.019)(Fig1.H). As expected PDX093, which had high cystic and necrotic components, showed the least glycolysis (L/P ratio 0.14 ± 0.02). Upon comparison of two different generations of PDX047, while the tumor growth rates and ADC remained similar, over 3- fold differences in the L/P ratio was observed for the latter passage implying natural selection of aggressive cells (p = 0.035). Comparisons between PDX054 and its xenograft XEN054 showed similar tumor growth rate and cellularity (as reflected by ADC) (Fig2.D,G). XEN054 showed a significantly higher cystic components (p = 0.0001) and lower necrosis (p = 0.013) relative to its PDX054 (Fig2.E, F). Although XEN054 showed increased glycolysis relative to PDX054, there was no significant difference (p = 0.114)(Fig2.H). Currently, proton imaging studies are underway in other XENs, as well as correlative studies of immunochemistry, metabolomics, transcriptomic, and enzymatic assays to better interpret the imaging findings.Conclusion
This baseline characterization of in vivo PDX and XEN models will assist in the optimal choice of model selection to study RCC disease progression and therapeutic efficacy to develop robust non-invasive imaging biomarkers.Acknowledgements
No acknowledgement found.References
1. Ahmad MIM, Sabr, M., Roshy, E. Assessment of apparent diffusion coefficient value as prognostic factor for renal cell carcinoma aggressiveness. Egypt J Radiol Nucl Med 2019;50.
2. Sriram R, Gordon J, Baligand C, et al. Non-Invasive Assessment of Lactate Production and Compartmentalization in Renal Cell Carcinomas Using Hyperpolarized (13)C Pyruvate MRI. Cancers (Basel) 2018;10.
3. Thong AE, Zhao H, Ingels A, et al. Tissue slice grafts of human renal cell carcinoma: an authentic preclinical model with high engraftment rate and metastatic potential. Urol Oncol 2014;32:43 e23-30.
4. Zhao H, Nolley R, Chen Z, Peehl DM. Tissue slice grafts: an in vivo model of human prostate androgen signaling. Am J Pathol 2010;177:229-39.
5. Xiao Y, Zhao H, Tian L, et al. S100A10 Is a Critical Mediator of GAS6/AXL-Induced Angiogenesis in Renal Cell Carcinoma. Cancer Res 2019;79:5758-68.
Figures