3581
Imaging Treatment Response with Hyperpolarized Pyruvate in Anaplastic Thyroid Carcinoma1Imaging Physics, MD Anderson Cancer Center, Houston, TX, United States, 22. Department of Radiology and Biomedical Imaging, University of California San Francisco, San Francisco, San Francisco, CA, United States, 3Center for Advanced Biomedical Imaging, MD Anderson Cancer Center, Houston, TX, United States, 4Nuclear Medicine, MD Anderson Cancer Center, Houston, TX, United States, 5Nueroradiology, MD Anderson Cancer Center, Houston, TX, United States, 6Head and Neck Surgery, MD Anderson Cancer Center, Houston, TX, United States
Synopsis
This case report presents the detection of hyperpolarized lactate production in a patient with anaplastic thyroid carcinoma. Lactate signal was observed following injection of hyperpolarized pyruvate and the signal was well localized to the tumor. The normalized lactate signal was reduced eight days following the onset of systemic therapy with Pembro and Lenvatinib.
Introduction
Anaplastic thyroid carcinoma (ATC) is a rare but deadly disease accounting for only 2% of thyroid cancers yet is responsible for more than 50% of thyroid cancer-related mortality.1 Recently, treatment of ATC has shifted from primarily palliative care to more targeted therapy which has resulted in an improvement in overall survival. Despite this improvement, ATC is still challenging to treat, and enhanced characterization of an individual tumor could help guide treatment decisions. Metabolic imaging, afforded by hyperpolarized MR, has been shown in animal models to provide evidence of therapy response.2,3 Therefore, hyperpolarized pyruvate could provide novel insight into the metabolic state of an ATC tumor for initial staging or monitoring treatment response. To our knowledge, this case study presents the first measurement of hyperpolarized pyruvate in a clinical setting for ATC.Methods
All scanning was performed on a GE 3T scanner using a clamshell transmit coil and an 8-channel paddle array.4 Hyperpolarized pyruvate was polarized in a 5T GE SPINlab polarizer. Hyperpolarized images of pyruvate and lactate were acquired using a spectral-spatial excitation and a multi-slice echoplanar readout.5 Images had a 1.5 cm in-plane resolution, 8 mm slice thickness, 3s temporal resolution, and excitation angles $$$\theta_{pyr} = 20^{\circ}; \theta_{lac} = 30^{\circ}$$$. The patient was 66 year old male with biopsy-proven ATC of the left lobe of the thyroid. A baseline hyperpolarized study was performed as well as an identical imaging study eight days after starting systemic therapy using Pembro and Lenvatinib. This imaging protocol was approved by our Institutional Review Board.Area under the curve (AUC) images were calculated for each metabolite and overlaid over T2w Images for anatomical reference. Lactate production was evaluated semi-quantitatively using the normalized lactate signal from all voxels with detectable lactate signal. $$nLac = \frac{AUC_{lac}}{AUC_{lac}+AUC_{pyr}} $$
Results and Discussion
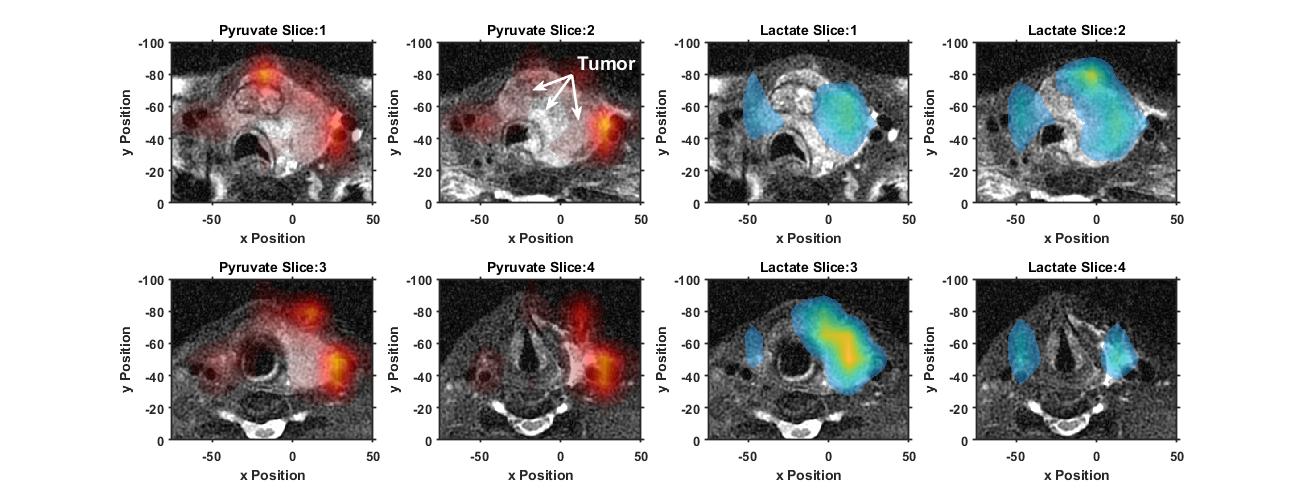
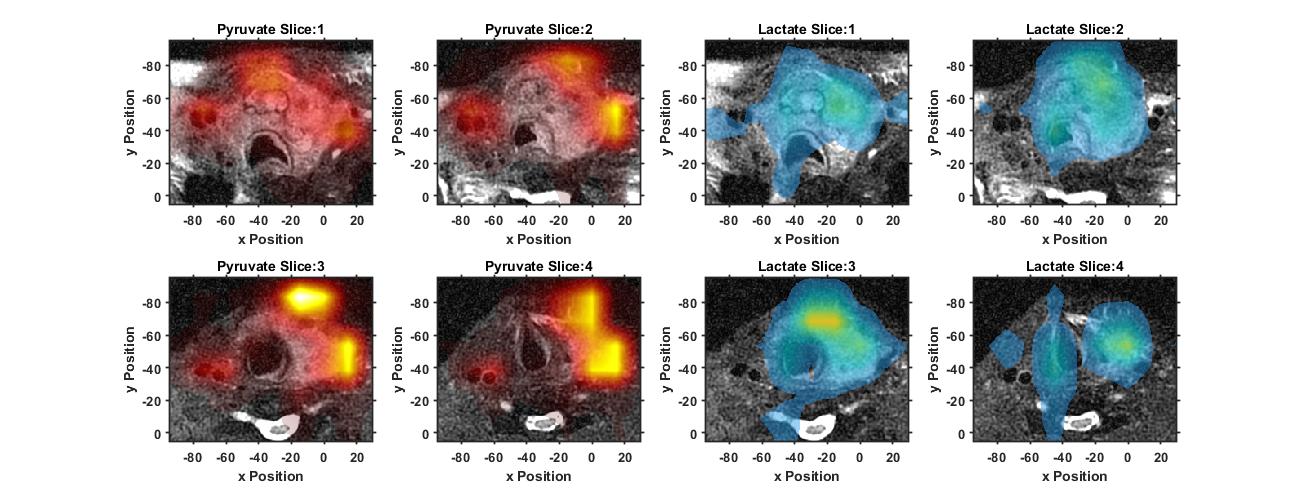
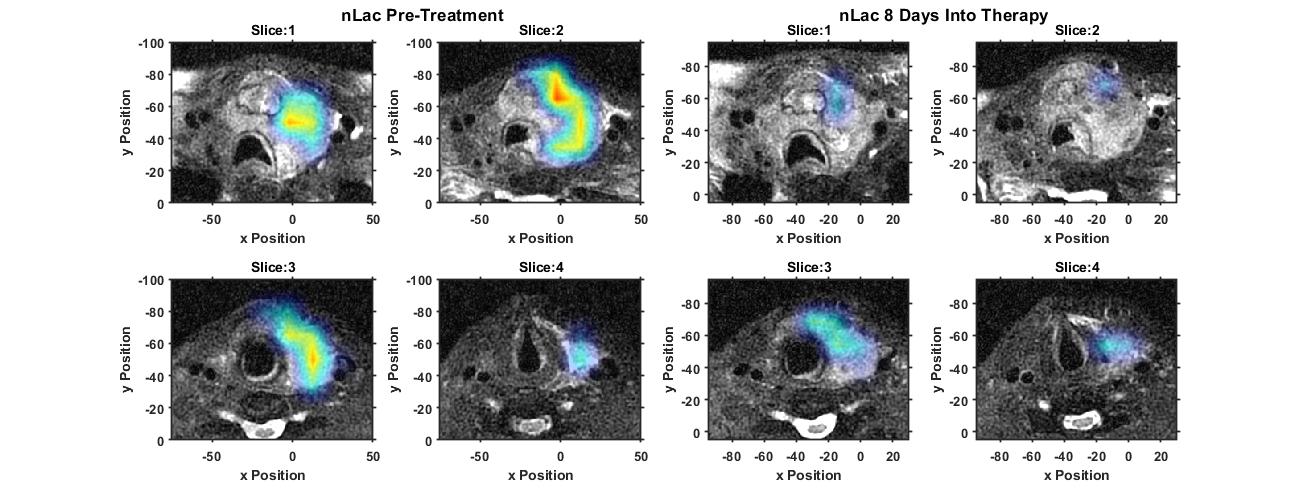
The hyperpolarized imaging data shows high pyruvate signal primarily in the left internal and external carotid arteries, Figures 1&2. The tumor was metabolically active as demonstrated by the well-localized lactate signal, Figure 1&2. The lactate signal was heterogenous in the tumor with a lack of lactate signal detected in the anterior region of hemorrhage, best visualized on slice 1 of Figure 1. While lactate production was still observed eight days after the onset of therapy, the amount of lactate production was reduced which is clearly visualized by the nLac maps in Figure 3. Detected nLac was reduced by 31%, $$$0.50\pm0.16$$$ to $$$0.34\pm0.09$$$.Conclusion
The conversion of hyperpolarized pyruvate to lactate was visualized in the setting of an ATC patient. The overall lactate signal was decreased following eight days of systemic therapy with Pembro and Lenvatinib.Acknowledgements
This work was supported in part by the National Cancer Institute and National Institute of Biomedical Imaging and Bioengineering of the National Institutes of Health (P30CA016672, R01CA211150, P41EB013598, U01EB026412), American Cancer Society Research Scholar Grant RSG‐18‐005‐01‐CCE, and GE Healthcare. The content is solely the responsibility of the authors and does not necessarily represent the official views of these agencies.References
1. Maniakas, A. et al. Evaluation of Overall Survival in Patients With Anaplastic Thyroid Carcinoma, 2000-2019. JAMA Oncol 6, 1397-1404, doi:10.1001/jamaoncol.2020.3362 (2020). \
2. Sandulache, V. C. et al. Evaluation of hyperpolarized [1-(1)(3)C]-pyruvate by magnetic resonance to detect ionizing radiation effects in real time. PLoS One 9, e87031, doi:10.1371/journal.pone.0087031 (2014).
3. Sandulache, V. C. et al. Glycolytic inhibition alters anaplastic thyroid carcinoma tumor metabolism and improves response to conventional chemotherapy and radiation. Mol Cancer Ther 11, 1373-1380, doi:10.1158/1535-7163.MCT-12-0041 (2012).
4. Tropp, J. et al. Multi-channel metabolic imaging, with SENSE reconstruction, of hyperpolarized [1-(13)C] pyruvate in a live rat at 3.0 tesla on a clinical MR scanner. J Magn Reson 208, 171-177, doi:10.1016/j.jmr.2010.10.007 (2011).
5. Gordon, J. W. et al. Translation of Carbon-13 EPI for hyperpolarized MR molecular imaging of prostate and brain cancer patients. Magn Reson Med 81, 2702-2709, doi:10.1002/mrm.27549 (2019)
Figures