3580
Dependency of glycolytic factors in HCC lactate and alanine flux as measured by hyperpolarized 13C MRI1Radiology, Beth Israel Deaconess Medical Center, Boston, MA, United States
Synopsis
This study investigated the feasibility of hyperpolarized 13C (h13C) MRI as diagnostic tool to monitor hepatocellular carcinoma (HCC) activity. h13C MRI showed significant increase in pyruvate-lactate conversion and decrease in pyruvate-alanine in N1S1 HCC tumors following stimulation from nearby hepatic radiofrequency ablation, while no such changes were seen with the MCA-RH7777 HCC tumors, despite increased tumor burden or proliferation in both cell lines. The h13C measurements matched mRNA expression patterns of glycolysis-related genes, which were relatively lower for MCA-RH7777. h13C pyruvate MRI may provide insight into malignant tumor behavior but is contingent on the activity of key glycolytic regulators.
Introduction
Liver cancer is the 5th most common cancer worldwide and the 3rd leading cause of cancer-related death. Hepatocellular carcinoma (HCC) represents more than 90% of primary liver cancer and is a major public health problem.1 Despite advances in new technologies in treatment, a significant proportion of patients develop tumor recurrence, highlighting the need for the development of potential diagnostic approach to monitor tumor response to therapy. Cancer cells typically favor glycolysis for energy production, a phenomenon known as the Warburg effect, resulting in elevated lactate production.2 This glycolytic/metabolic phenotype confers selective advantage to cancer cells through acidification of the microenvironment and support of uninterrupted growth. Hyperpolarized 13C MRI (h13C MRI) is capable of imaging of the uptake and metabolism of tracer molecules such as pyruvate, lactate, and alanine.3,4 Prior studies showed the application of h13C MRI in various cancers, such as prostate cancer, breast cancer.5–9 In this study we sought to determine whether glycolytic changes in HCC as detected by h13C MRI could provide insight into tumor aggression. We tested this hypothesis by using an off-target locoregional treatment model using hepatic radiofrequency ablation (RFA), exploiting a known phenomenon where hepatic thermal ablation therapy induces aggression of untreated tumors.10–12 Our goal was to see if this stimulation is modulated by glycolytic factors, and, if so, if this could be detectable with h13C MRI.Method
Two orthotopic HCC tumor models were developed using Fischer 344 rats. N1S1 was used to create a single-lesion model and MCA-RH7777 was used to create a metastatic model. 2x10⁶ N1S1 cells or 5x10⁶ MCA-RH7777 cells were implanted into the left hepatic lobe. Rats with MCA-RH7777 also received five doses of cyclosporine A (20 mg/kg/d) from implantation to ensure initial tumor establishment. When implanted tumors reached 10 mm as measured by ultrasound, the rats were randomized into a sham (control) group versus a radiofrequency (RFA) group. RFA was performed at 70 ℃ for 5 min on normal tissue within the right hepatic lobe. In the sham group all of the steps of RFA were performed except the treatment probe was not energized. h13C MRI was performed prior to treatment and 72 hours post-treatment. N1S1 tumors were harvested immediately after 2nd h13C MRI. MCA-RH7777 tumors were harvested 14 days later to observe the metastasis burden.Hyperpolarized 13C pyruvate solution was prepared by dynamic nuclear polarization (DNP) using a commercial polarizer (Hypersense, Oxford Instruments). [1-13C] pyruvic acid was combined with 15mM OX063 radical (GE Healthcare, London UK) and 1mM gadoteridol (ProHance, Bracco, Milan Italy) and polarized for 40 minutes or more at 1.4K and 100mW microwave power. The hyperpolarized material was then dissolved in saline containing 50mM TRIS and 125mg/l EDTA and adjusted to physiological pH with sodium hydroxide to obtain a 96mM hyperpolarized pyruvate solution. 2.5ml were administered via tail vein. Imaging was performed on a 9.4 T magnet (Biospec, Bruker). Data were acquired in the axial plane across the tumor using an echo planar spectroscopic imaging (EPSI) sequence with FOV of 5 cm, 4° tip angle, 16x16 matrix, 10mm slice thickness, 512 spectral points, and 4kHz spectral width. 64 repetitions were acquired with 2s temporal resolution.
Results
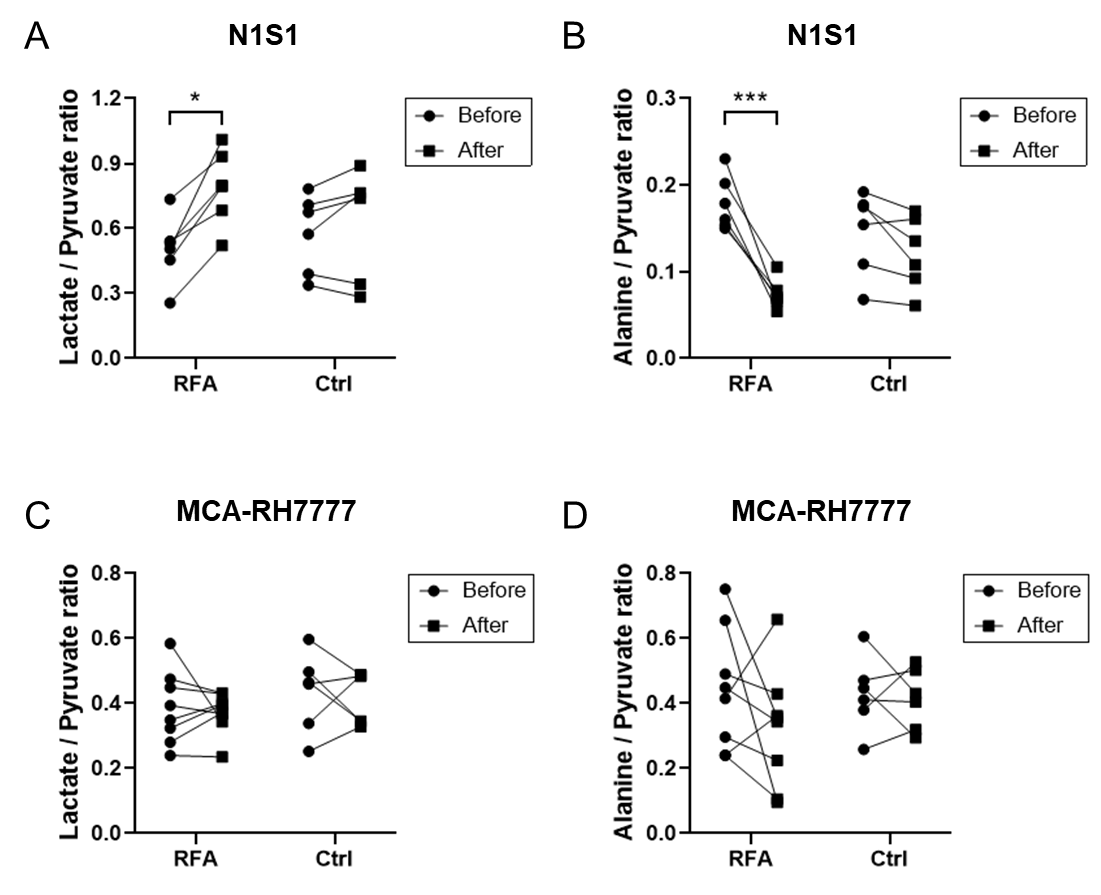
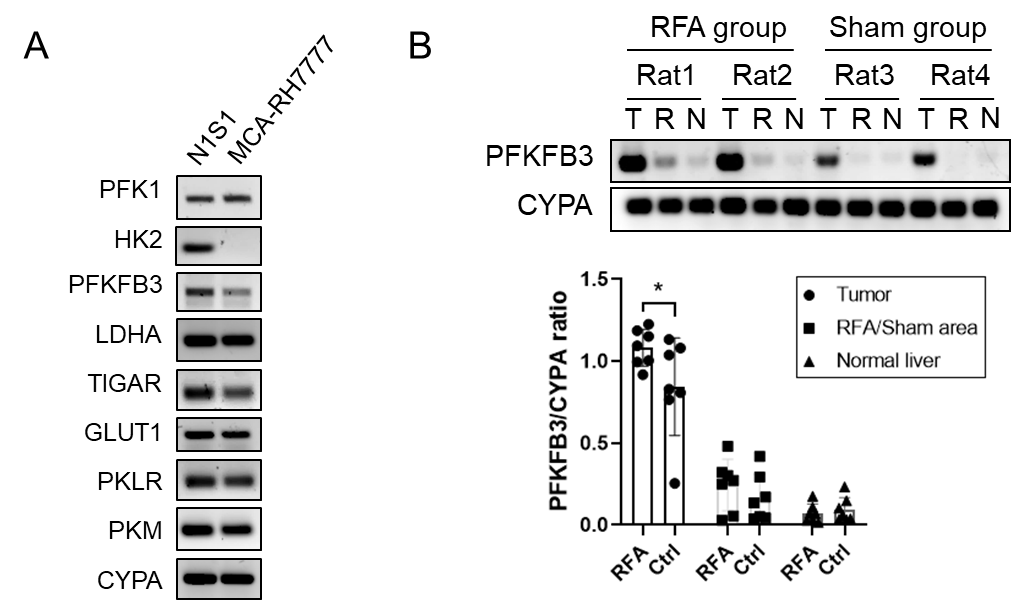
Hyperpolarized 13C MRI imaging demonstrated increased N1S1 tumor 13C lactate flux and decreased 13C alanine flux in RFA arm relative to the control group (Fig. 1A and 1B). However, there was no such change in MCA-RH7777 13C lactate or alanine flux between RFA and control arms (Fig. 1C and 1D).Glycolysis-related genes were less expressed in MCA-RH7777 than N1S1 (Fig. 2A). Following RFA, mRNA expression of PFKFB3 was significantly increased in N1S1 tumors (Fig. 2B), while remaining minimally present in MCA-RH7777 tumors.
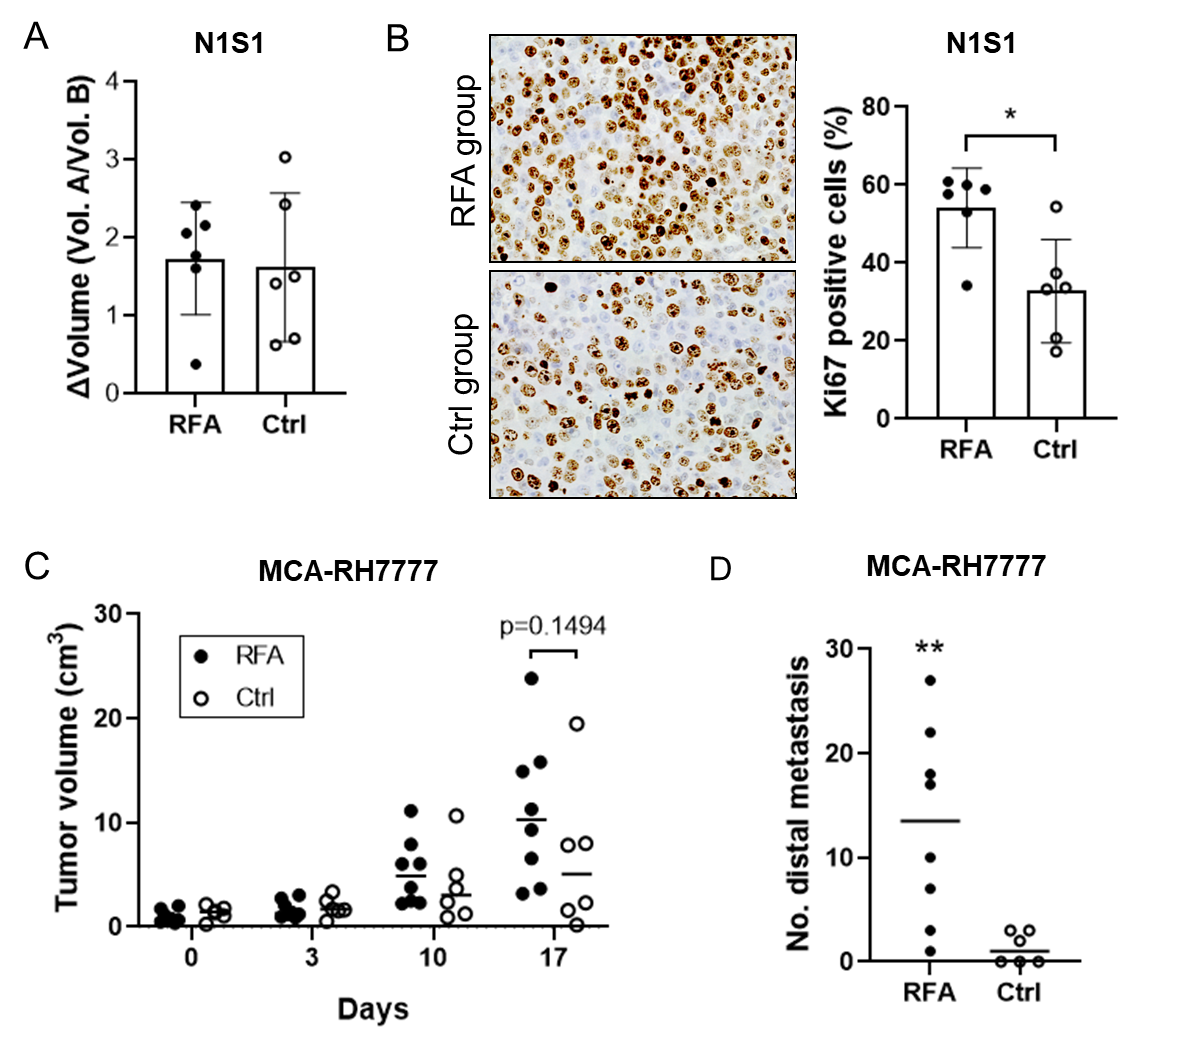
Tumor growth/proliferation was increased in both rat HCC models following ablation (Fig. 3A-3C). In addition, MCA-RH7777 metastatic burden was greater in the RFA arms compared to control (Fig.3D).
Discussion
Both HCC models demonstrated increased proliferation or metastases following off-target hepatic thermal ablation, however h13C MRI showed changes in lactate and alanine flux only within N1S1 tumors expressing glycolytic modulators, in particular PFKFB3. In contrast, MCA-RH7777 tumors demonstrated minimal PFKFB3 expression and lactate and alanine flux were unaffected by RFA. This showed that a link between PFKFB3 and HCC proliferation is necessary for h13C MRI-measured lactate flux and alanine flux to be used as an in vivo assessor of tumor aggression.Conclusion
HCC assessment with h13C MRI is feasible, but requires tumor growth to be dependent on key glycolytic regulators, which may not be present across all cell lines. Clinical translation of h13C MRI therefore requires caution given the heterogeneous nature of HCC.Acknowledgements
We are grateful for support from the Society of Abdominal Radiology and the Radiologic Society of North America.References
1. Ghouri Y, Mian I, Rowe J. Review of hepatocellular carcinoma: Epidemiology, etiology, and carcinogenesis. Journal of Carcinogenesis. 2017;16(1):1–1. doi:10.4103/jcar.JCar_9_16
2. Deberardinis RJ, Lum JJ, Hatzivassiliou G, Thompson CB. The Biology of Cancer: Metabolic Reprogramming Fuels Cell Growth and Proliferation. Cell Metabolism. 2008;7(1):11–20. doi:10.1016/j.cmet.2007.10.002
3. Zhang H. The Potential of Hyperpolarized 13C MRI in Assessing Signaling Pathways in Cancer. Academic Radiology. 2014;21(2):215–222. doi:10.1016/j.acra.2013.11.015
4. Kurhanewicz J, Vigneron DB, Ardenkjaer-Larsen JH, et al. Hyperpolarized 13C MRI: Path to Clinical Translation in Oncology. Neoplasia (New York, NY). 2019;21(1):1–16. doi:10.1016/j.neo.2018.09.006
5. Albers MJ, Bok R, Chen AP, et al. Hyperpolarized 13C lactate, pyruvate, and alanine: noninvasive biomarkers for prostate cancer detection and grading. Cancer research. 2008;68(20):8607–8615. doi:10.1158/0008-5472.CAN-08-0749
6. Woitek R, McLean MA, Gill AB, et al. Hyperpolarized 13C MRI of Tumor Metabolism Demonstrates Early Metabolic Response to Neoadjuvant Chemotherapy in Breast Cancer. Radiology Imaging cancer. 2020;2(4):e200017-. doi:10.1148/rycan.2020200017
7. Gallagher FA, Woitek R, McLean MA, et al. Imaging breast cancer using hyperpolarized carbon-13 MRI. Proceedings of the National Academy of Sciences - PNAS. 2020;117(4):2092–2098. doi:10.1073/pnas.1913841117
8. Chen H-Y, Aggarwal R, Bok RA, et al. Hyperpolarized 13C-pyruvate MRI detects real-time metabolic flux in prostate cancer metastases to bone and liver: a clinical feasibility study. Prostate cancer and prostatic diseases. 2019;23(2):269–276. doi:10.1038/s41391-019-0180-z
9. Kishimoto S, Brender JR, Crooks DR, et al. Imaging of glucose metabolism by 13C-MRI distinguishes pancreatic cancer subtypes in mice. eLife. 2019;8. doi:10.7554/eLife.46312
10. Ng K, Poon R, Lo C-M, Yuen J, Tso W, Fan S-T. Analysis of Recurrence Pattern and Its Influence on Survival Outcome After Radiofrequency Ablation of Hepatocellular Carcinoma. Journal of Gastrointestinal Surgery. 2008;12(1):183–191. doi:10.1007/s11605-007-0276-y
11. Kang TW, Kim JM, Rhim H, et al. Small Hepatocellular Carcinoma: Radiofrequency Ablation versus Nonanatomic Resection--Propensity Score Analyses of Long-term Outcomes. Radiology. 2015;275(3):908-919. doi:10.1148/radiol.15141483
12. Liao H, Ahmed M, Markezana A, et al. Thermal Ablation Induces Transitory Metastatic Growth by Means of the STAT3/c-Met Molecular Pathway in an Intrahepatic Colorectal Cancer Mouse Model. Radiology. 2020;294(2):464–472. doi:10.1148/radiol.2019191023
Figures