3578
Metabolic response of radiotherapy in patient-derived glioblastoma xenografts using hyperpolarized magnetic resonance1Radiation Oncology, University of Texas MD Anderson Cancer Center, Houston, TX, United States, 2Cancer Systems Imaging, University of Texas MD Anderson Cancer Center, Houston, TX, United States, 3Neurosurgery, University of Texas MD Anderson Cancer Center, Houston, TX, United States, 4Pathology, University of Texas MD Anderson Cancer Center, Houston, TX, United States, 5Genitourinary Medical Oncology, University of Texas MD Anderson Cancer Center, Houston, TX, United States
Synopsis
Glioblastoma is an aggressive cancer with a median survival of 16 months. Thus, waiting for changes in tumor volume to determine prognosis is too slow to benefit the patient. In this study, we show that in vivo measurements of tumor metabolism with hyperpolarized magnetic resonance can detect changes more rapidly and reliably than conventional anatomic MRI throughout all stages of tumor progression. These data are supported through ex vivo metabolic profiling. Interpretation of these results demonstrate the value that hyperpolarized magnetic resonance can bring to the clinic by addressing specific challenges encountered throughout the the care of glioblastoma patients.
Introduction
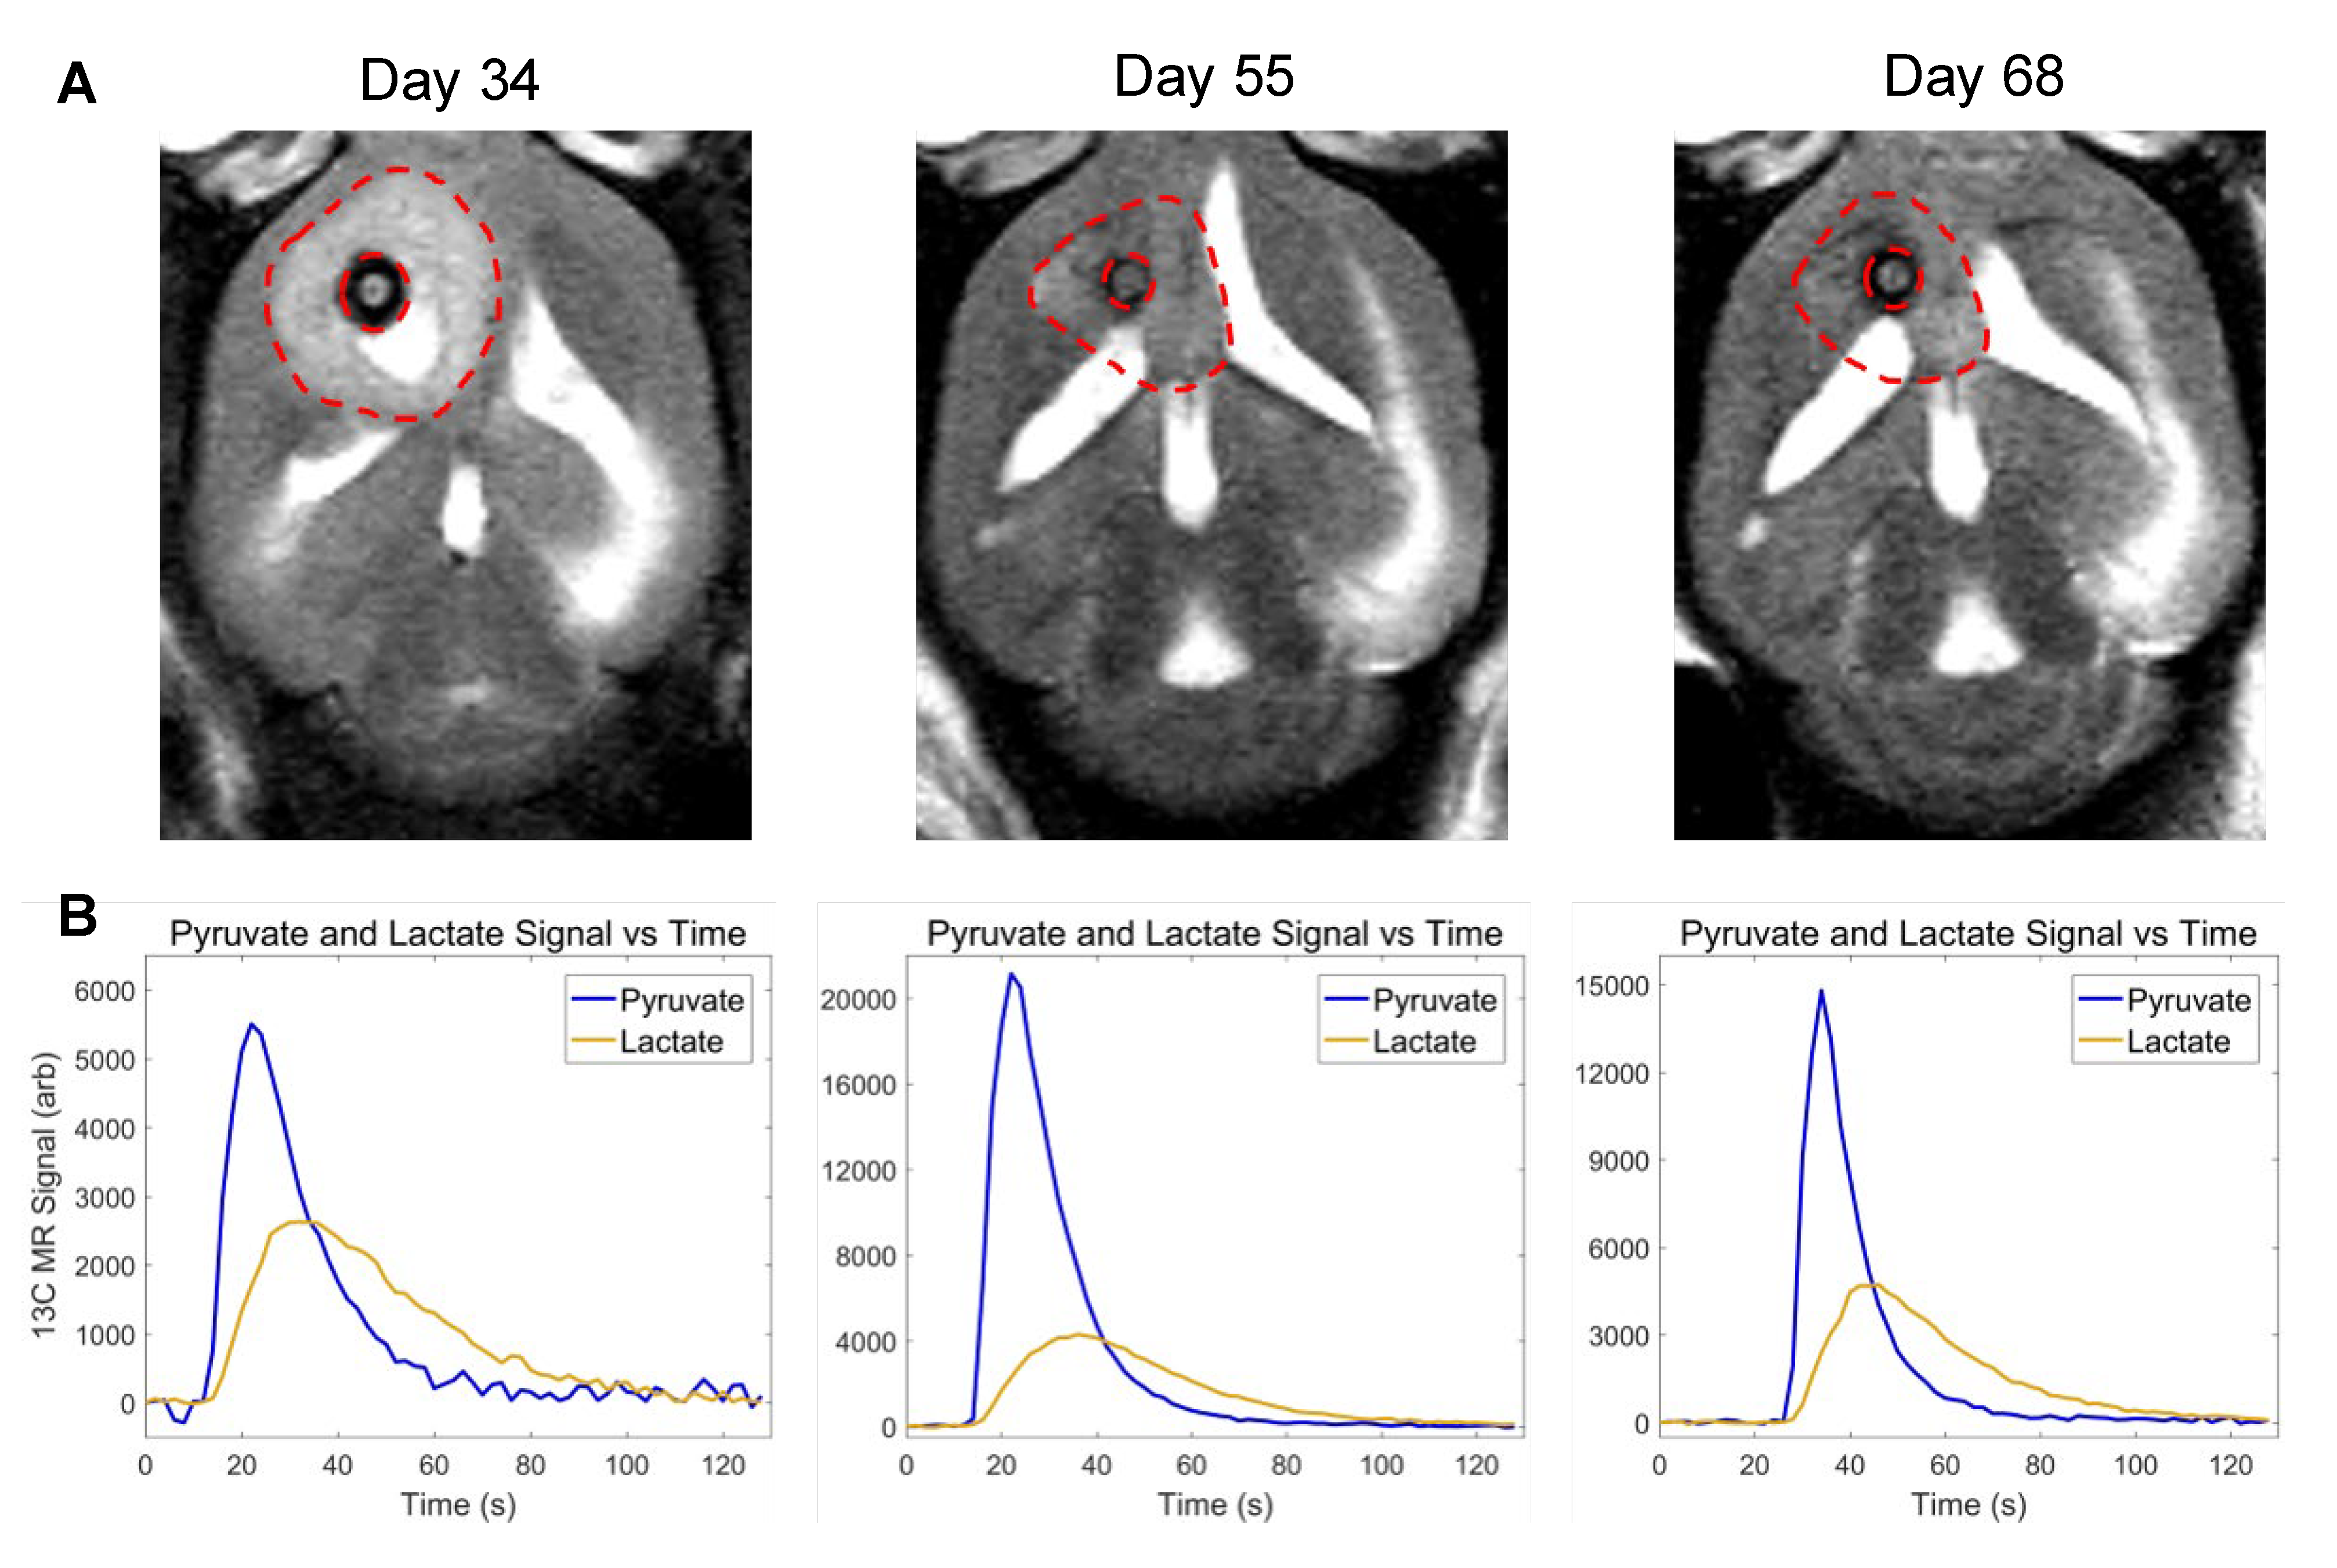
Molecular imaging, especially by probing tumor metabolism, has shown great promise in augmenting conventional clinical imaging for the diagnosis, prognosis, and treatment monitoring of brain tumors1,2. Hyperpolarized magnetic resonance is one such technique that has found success over the past several years3–6. Tumor metabolism is heterogeneous and evolves over the course of tumor development suggesting that the time-point of the measurement can significantly impact the results7–9. Therefore, we sought to implement for the first time, a series of serial hyperpolarized MRS measurements at multiple time-points over the course of tumor growth and treatment regimen. The purpose of this study was to compare hyperpolarized pyruvate-to-lactate conversion values from the serial hyperpolarized MRS experiments with tumor volume changes that were acquired with anatomic MRI during each stage of tumor progression (Fig. 1). The results demonstrate the value of adding hyperpolarized MR to conventional imaging protocols by addressing several challenges commonly encountered in the clinical setting. To build from my ISMRM abstracts in prior years, this presentation will focus on results from post-radiation therapy (regression and recurrence).Methods
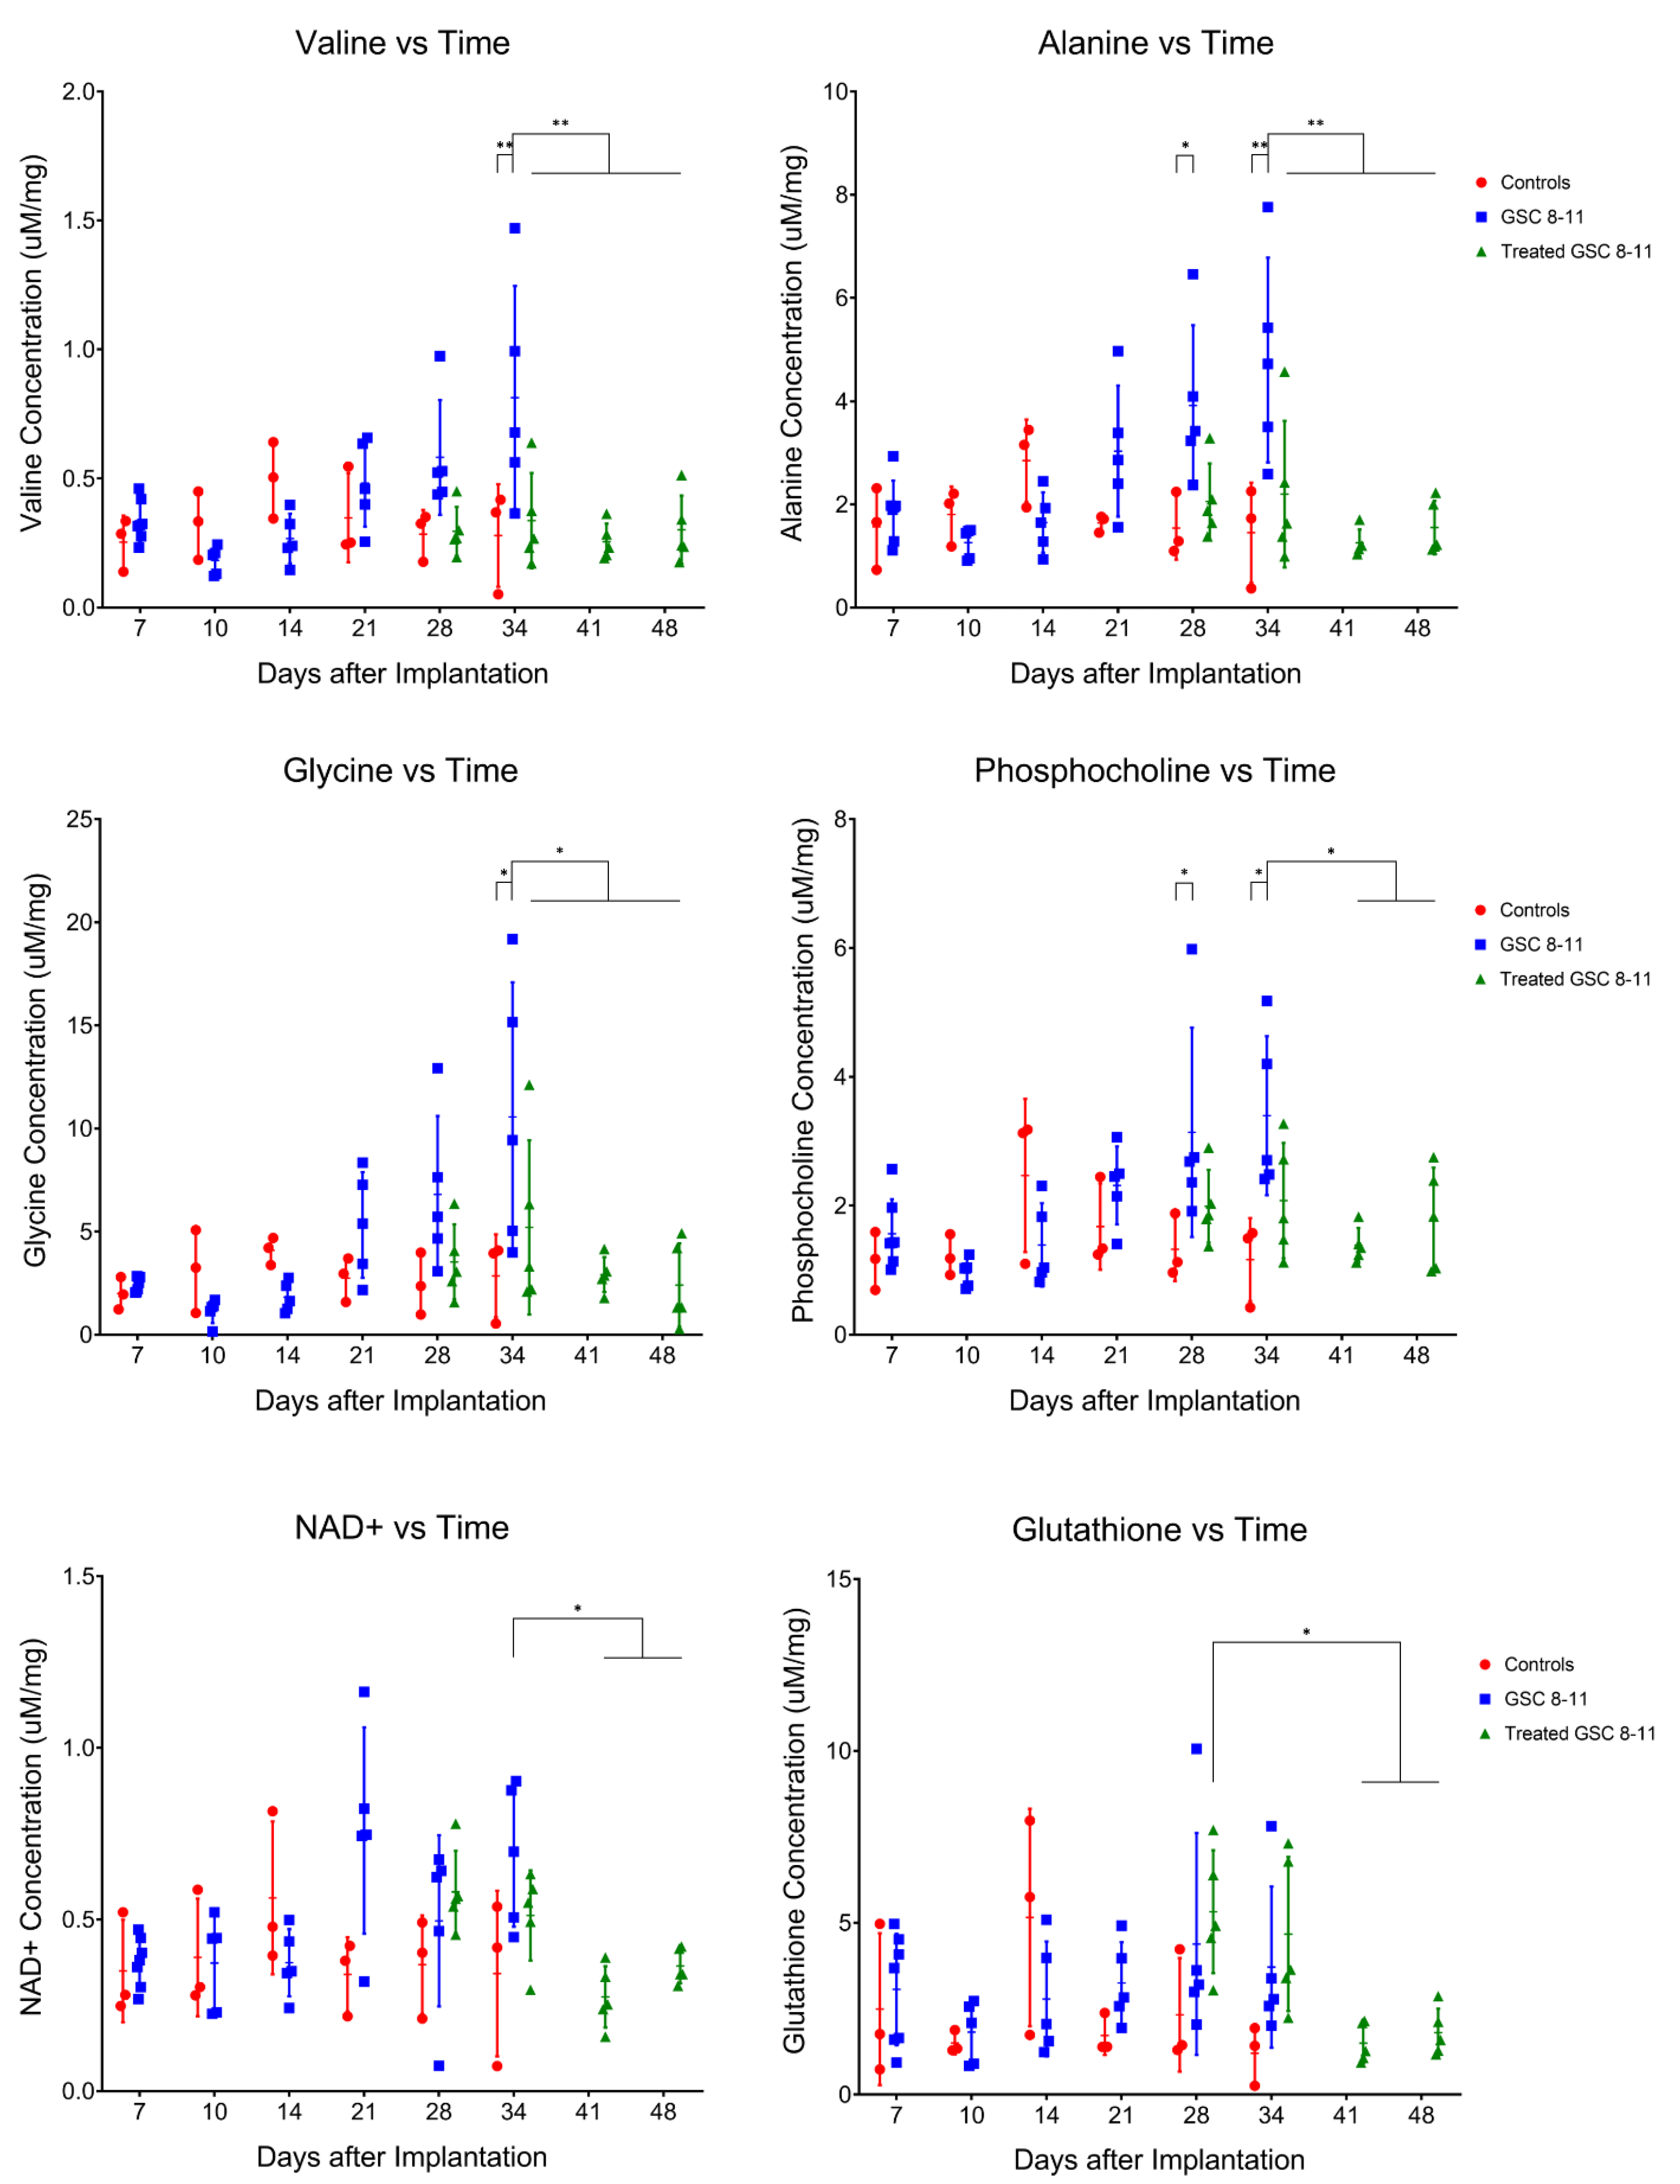
Athymic nude mice were intracranially implanted with patient-derived glioblastoma sphere-forming cells (GSC 8-11) in accordance with regulations of the Institutional Animal Care and Use Committee. During three stages of tumor progression (development, regression following radiotherapy, and recurrence), tumor volume, in vivo pyruvate-to-lactate conversion, and ex vivo metabolite pool sizes were measured. Tumor volume was measured every 3 days with T2-weighted MRI. Pyruvate-to-lactate conversion was evaluated every 7 days with 13C MRS through a hyperpolarized [1-13C]pyruvate bolus injection and quantification of subsequent lactate production using nLac (lactate:lactate+pyruvate). For tumor development and regression stages, tumors were excised at the same time-points as hyperpolarized MRS experiments and prepared for global metabolic profiling with nuclear magnetic resonance (NMR) spectroscopy. Metabolite pool sizes were quantified per mg of tissue. Whole brain irradiation was administered in 2 fractions of 5Gy on Days 25 and 27. At least N=5 tumors were measured at each time-point. Statistical analysis was performed with ordinary one-way ANOVA and follow-up Fisher’s Least Significant Difference tests. The false discovery rate from the large number of comparisons in the NMR analysis was corrected with two-stage step-up method of Benjamini, Krieger and Yekutieli. Comparisons with resultant p and q values < 0.05 were deemed significant.Results
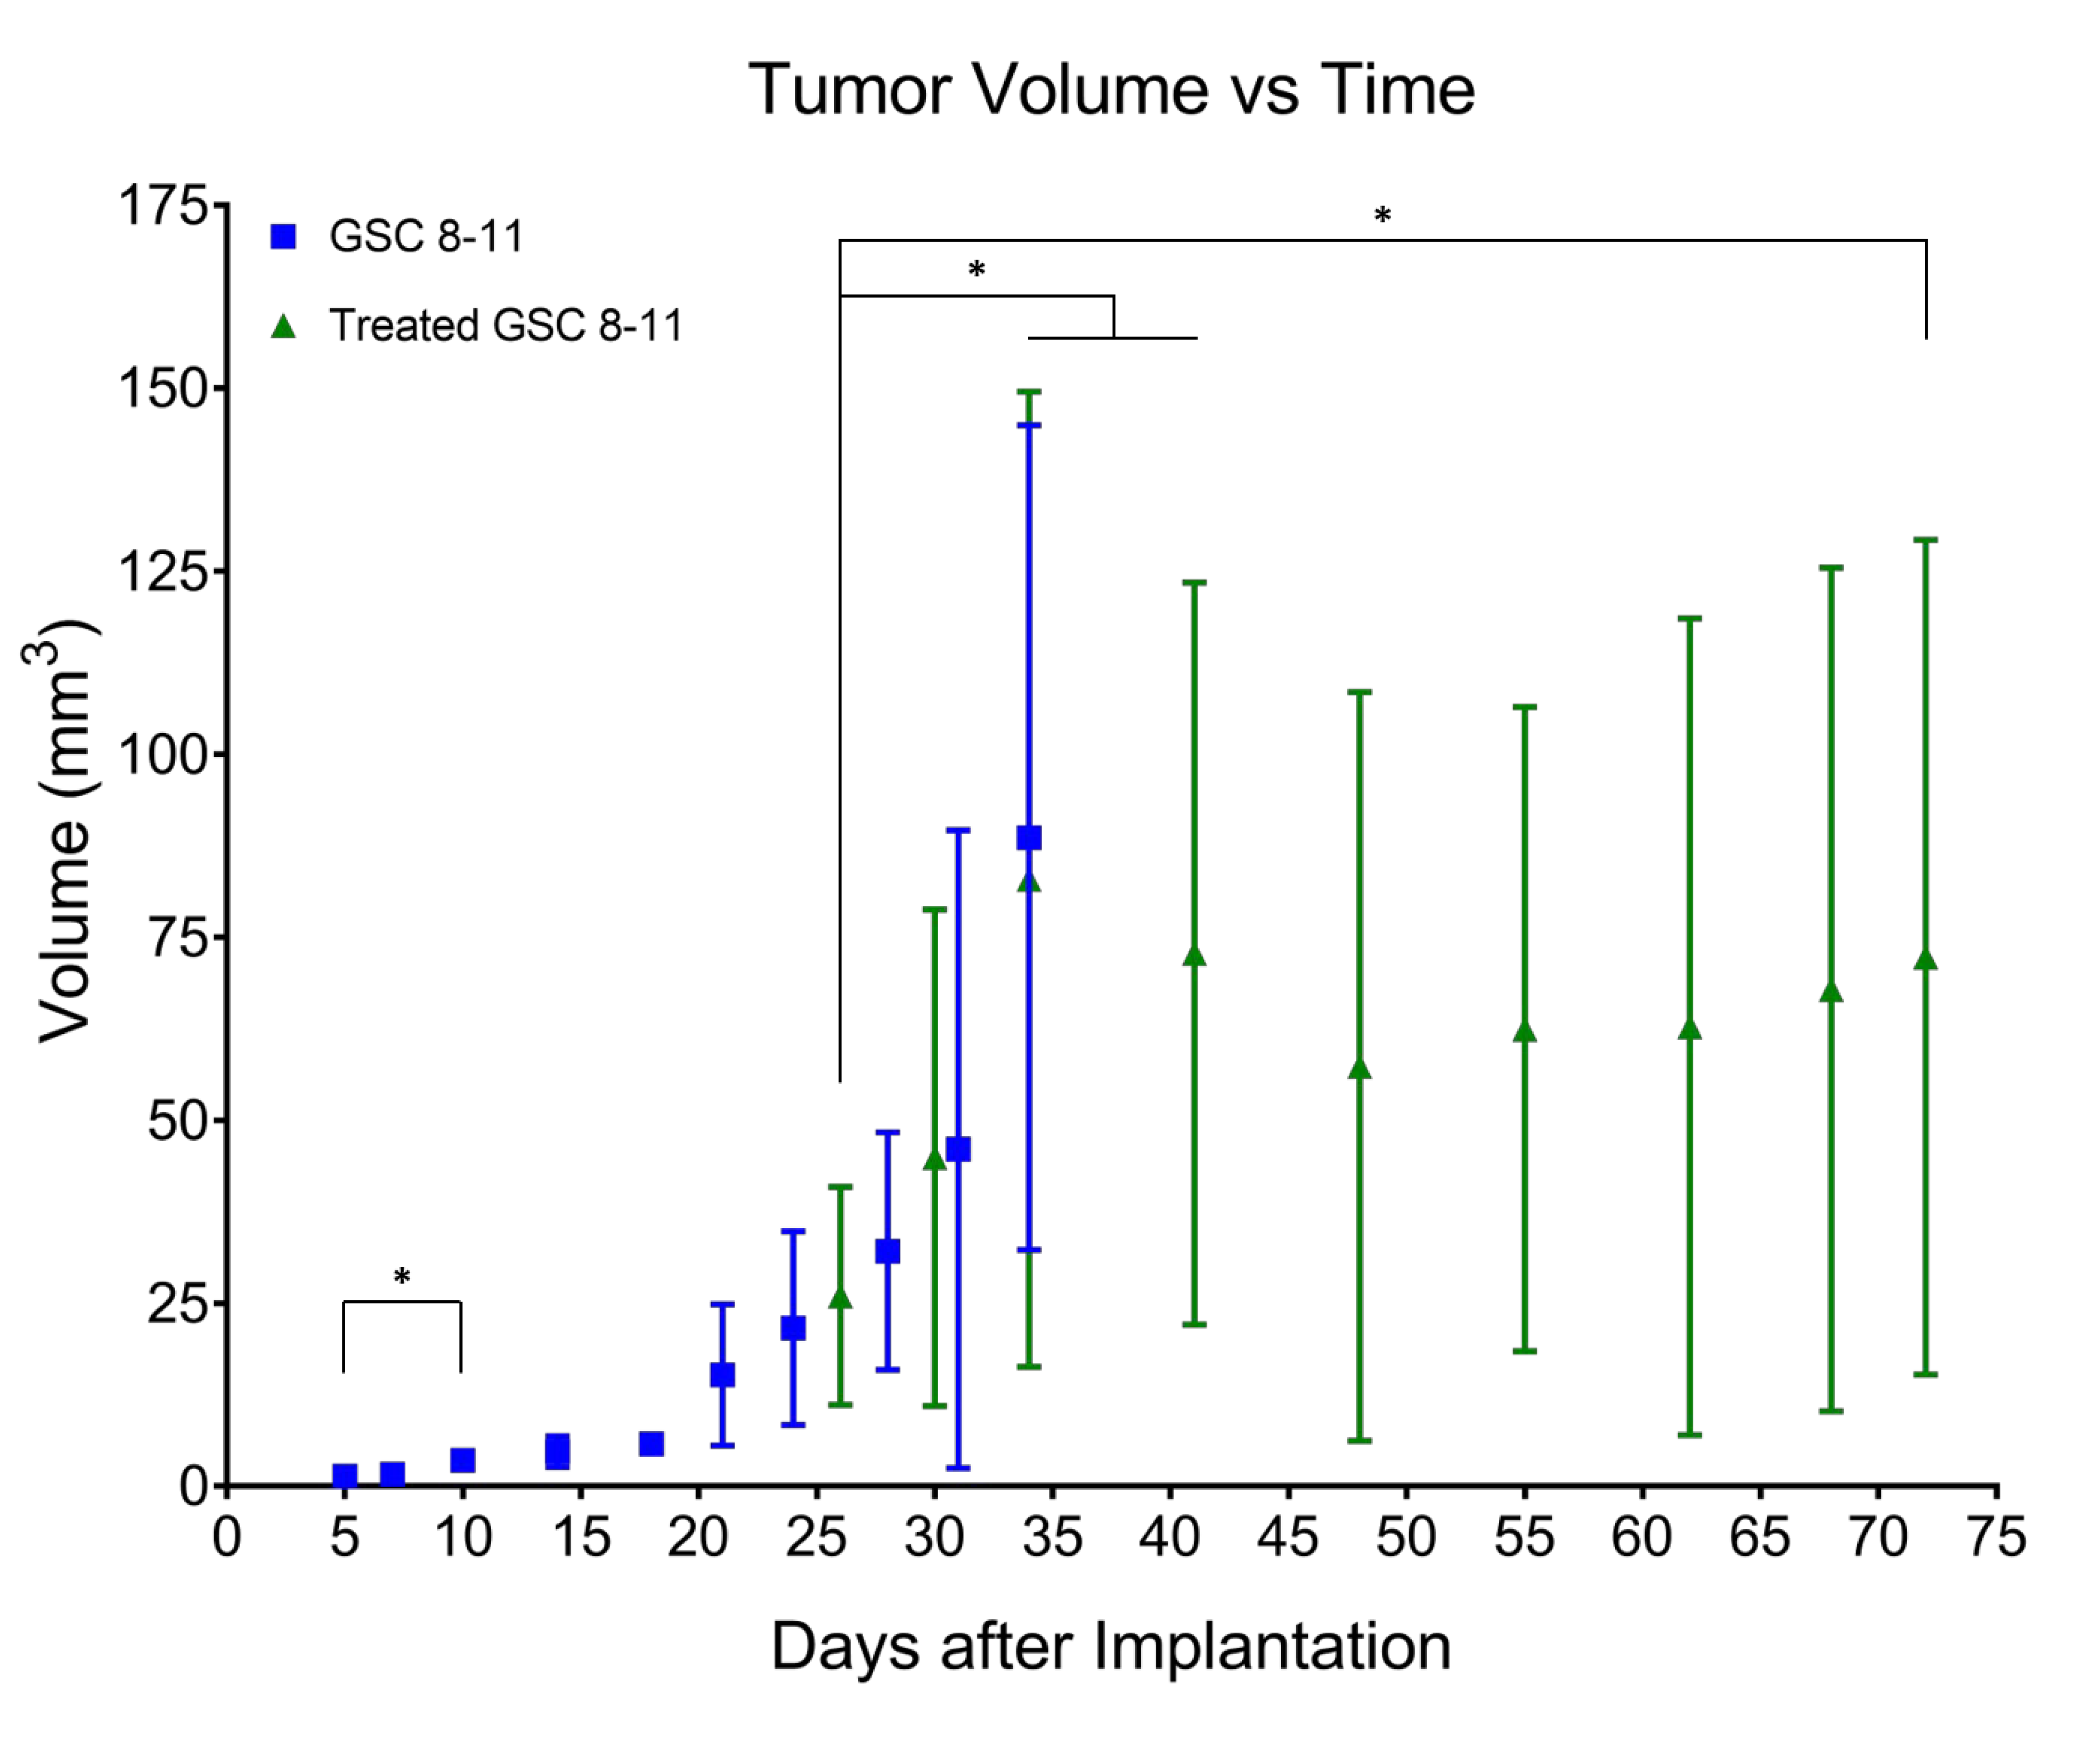
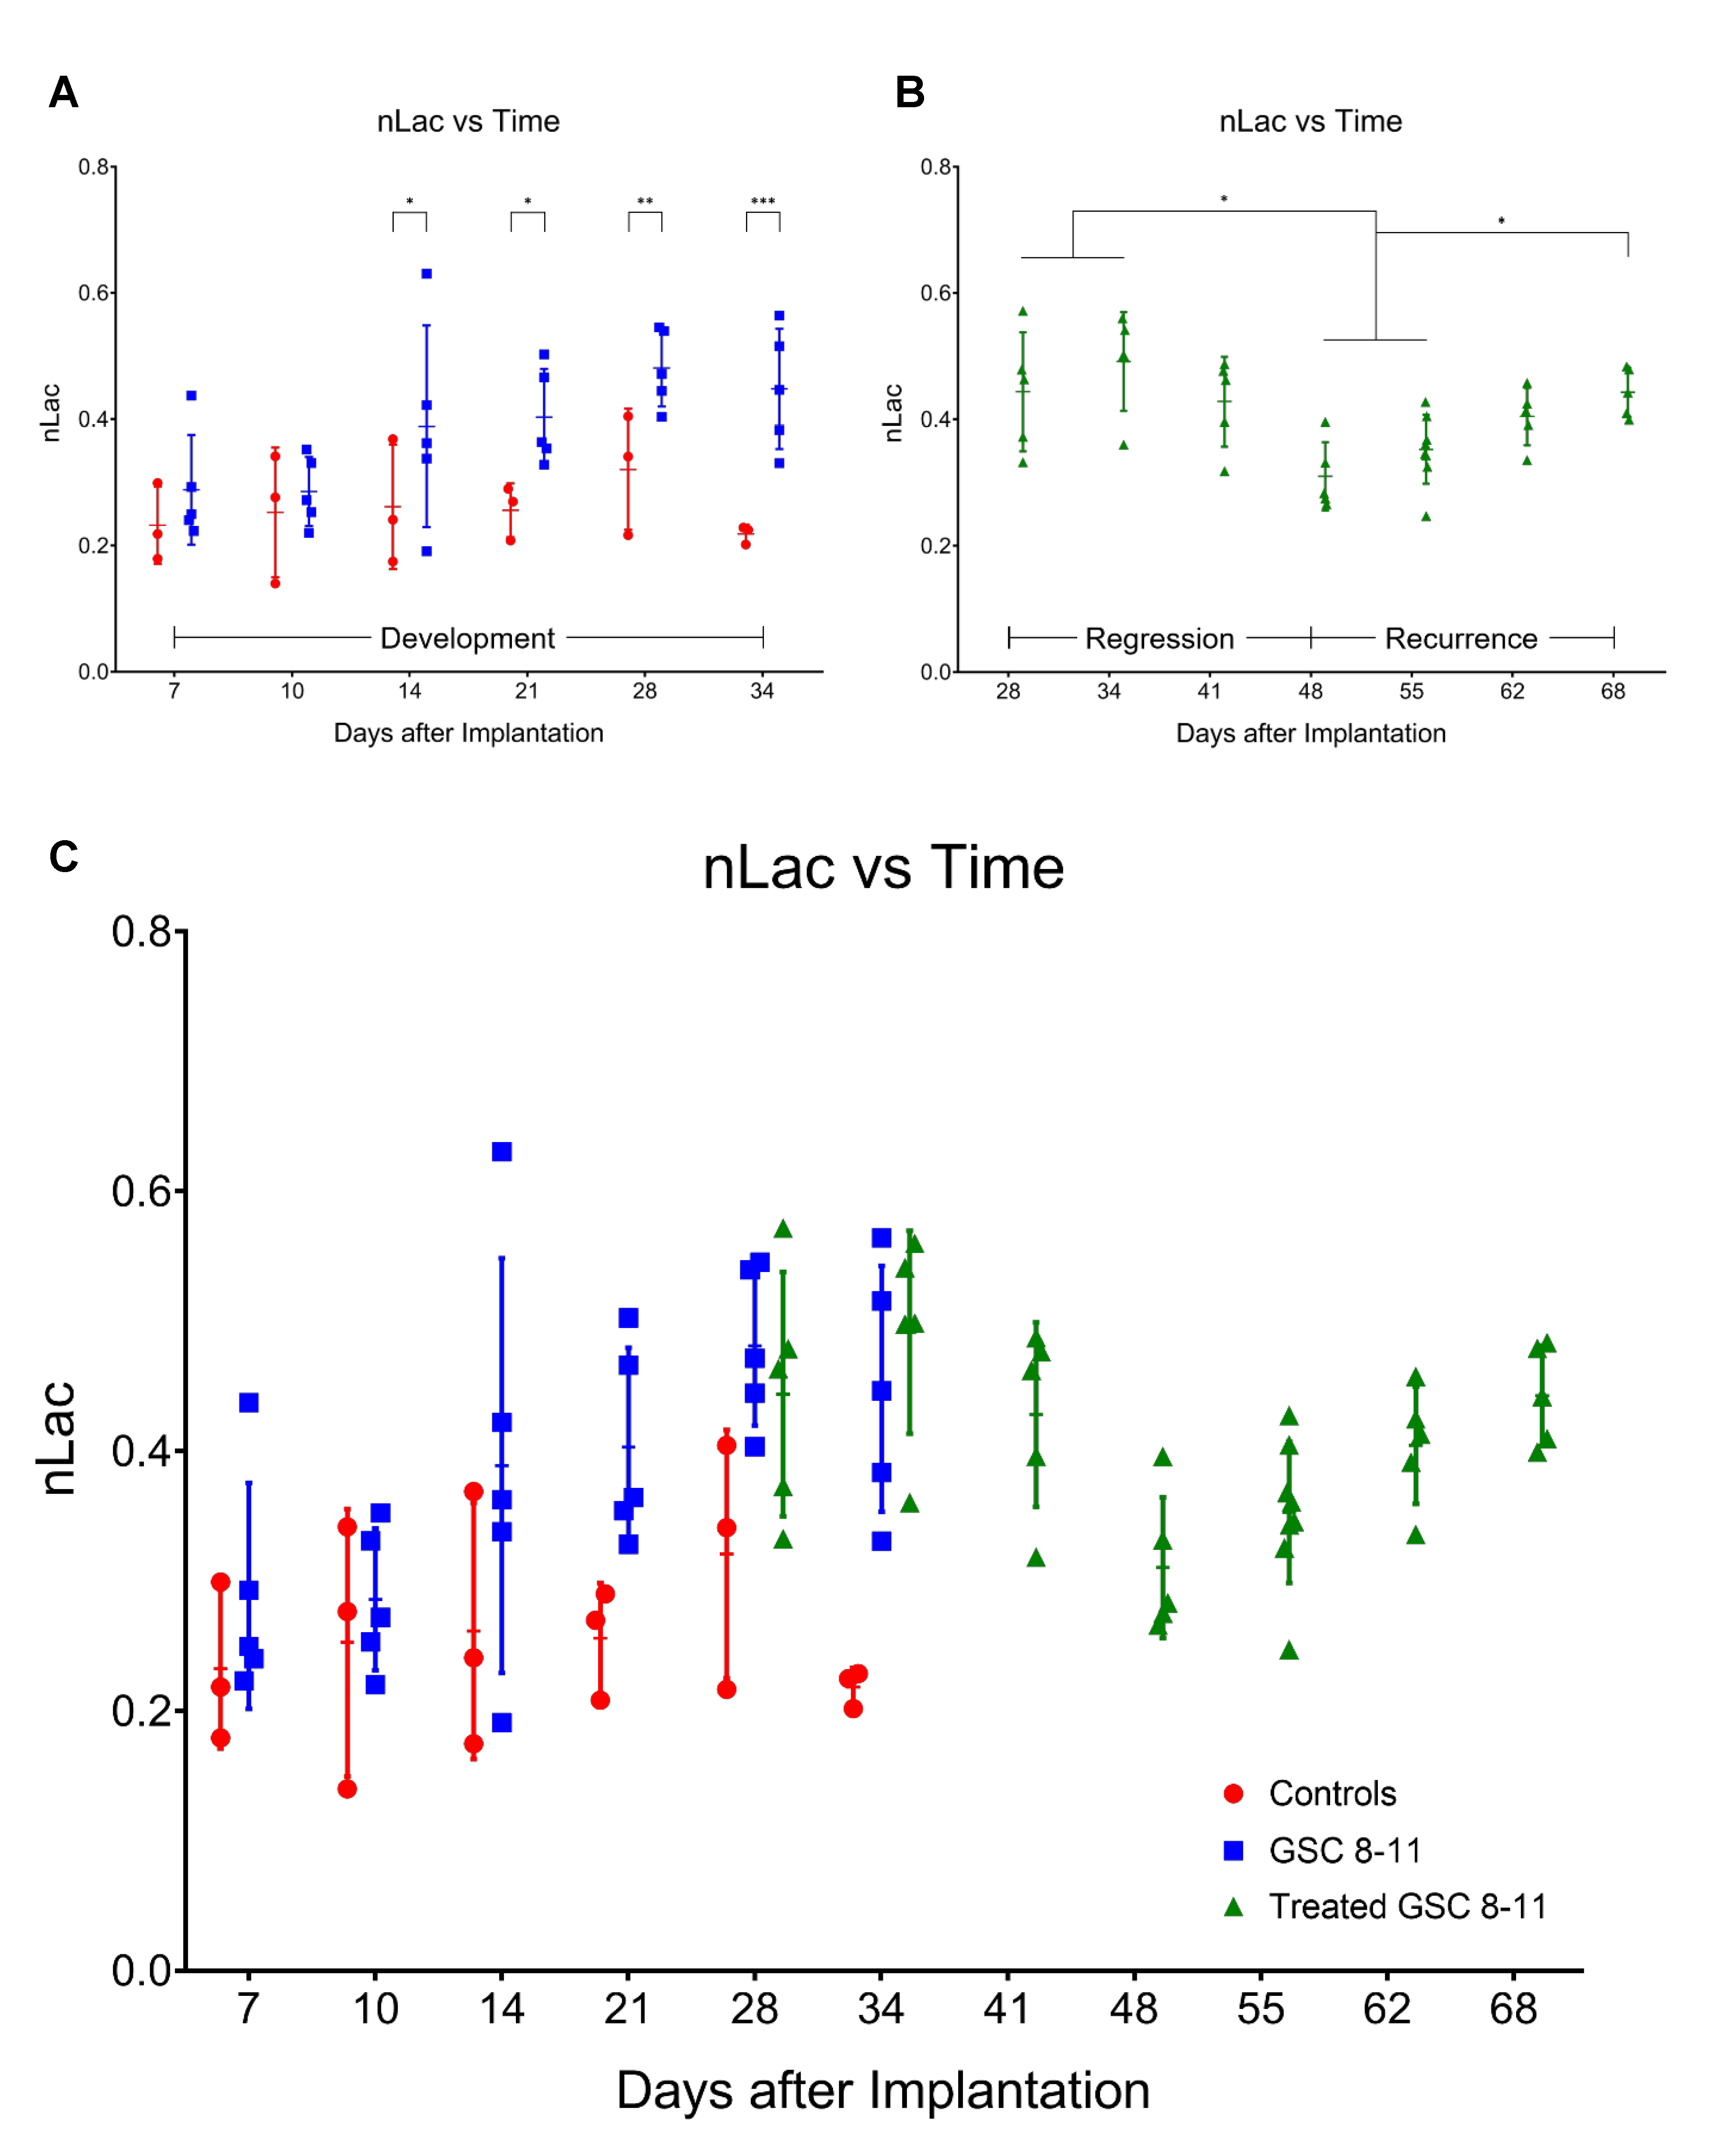
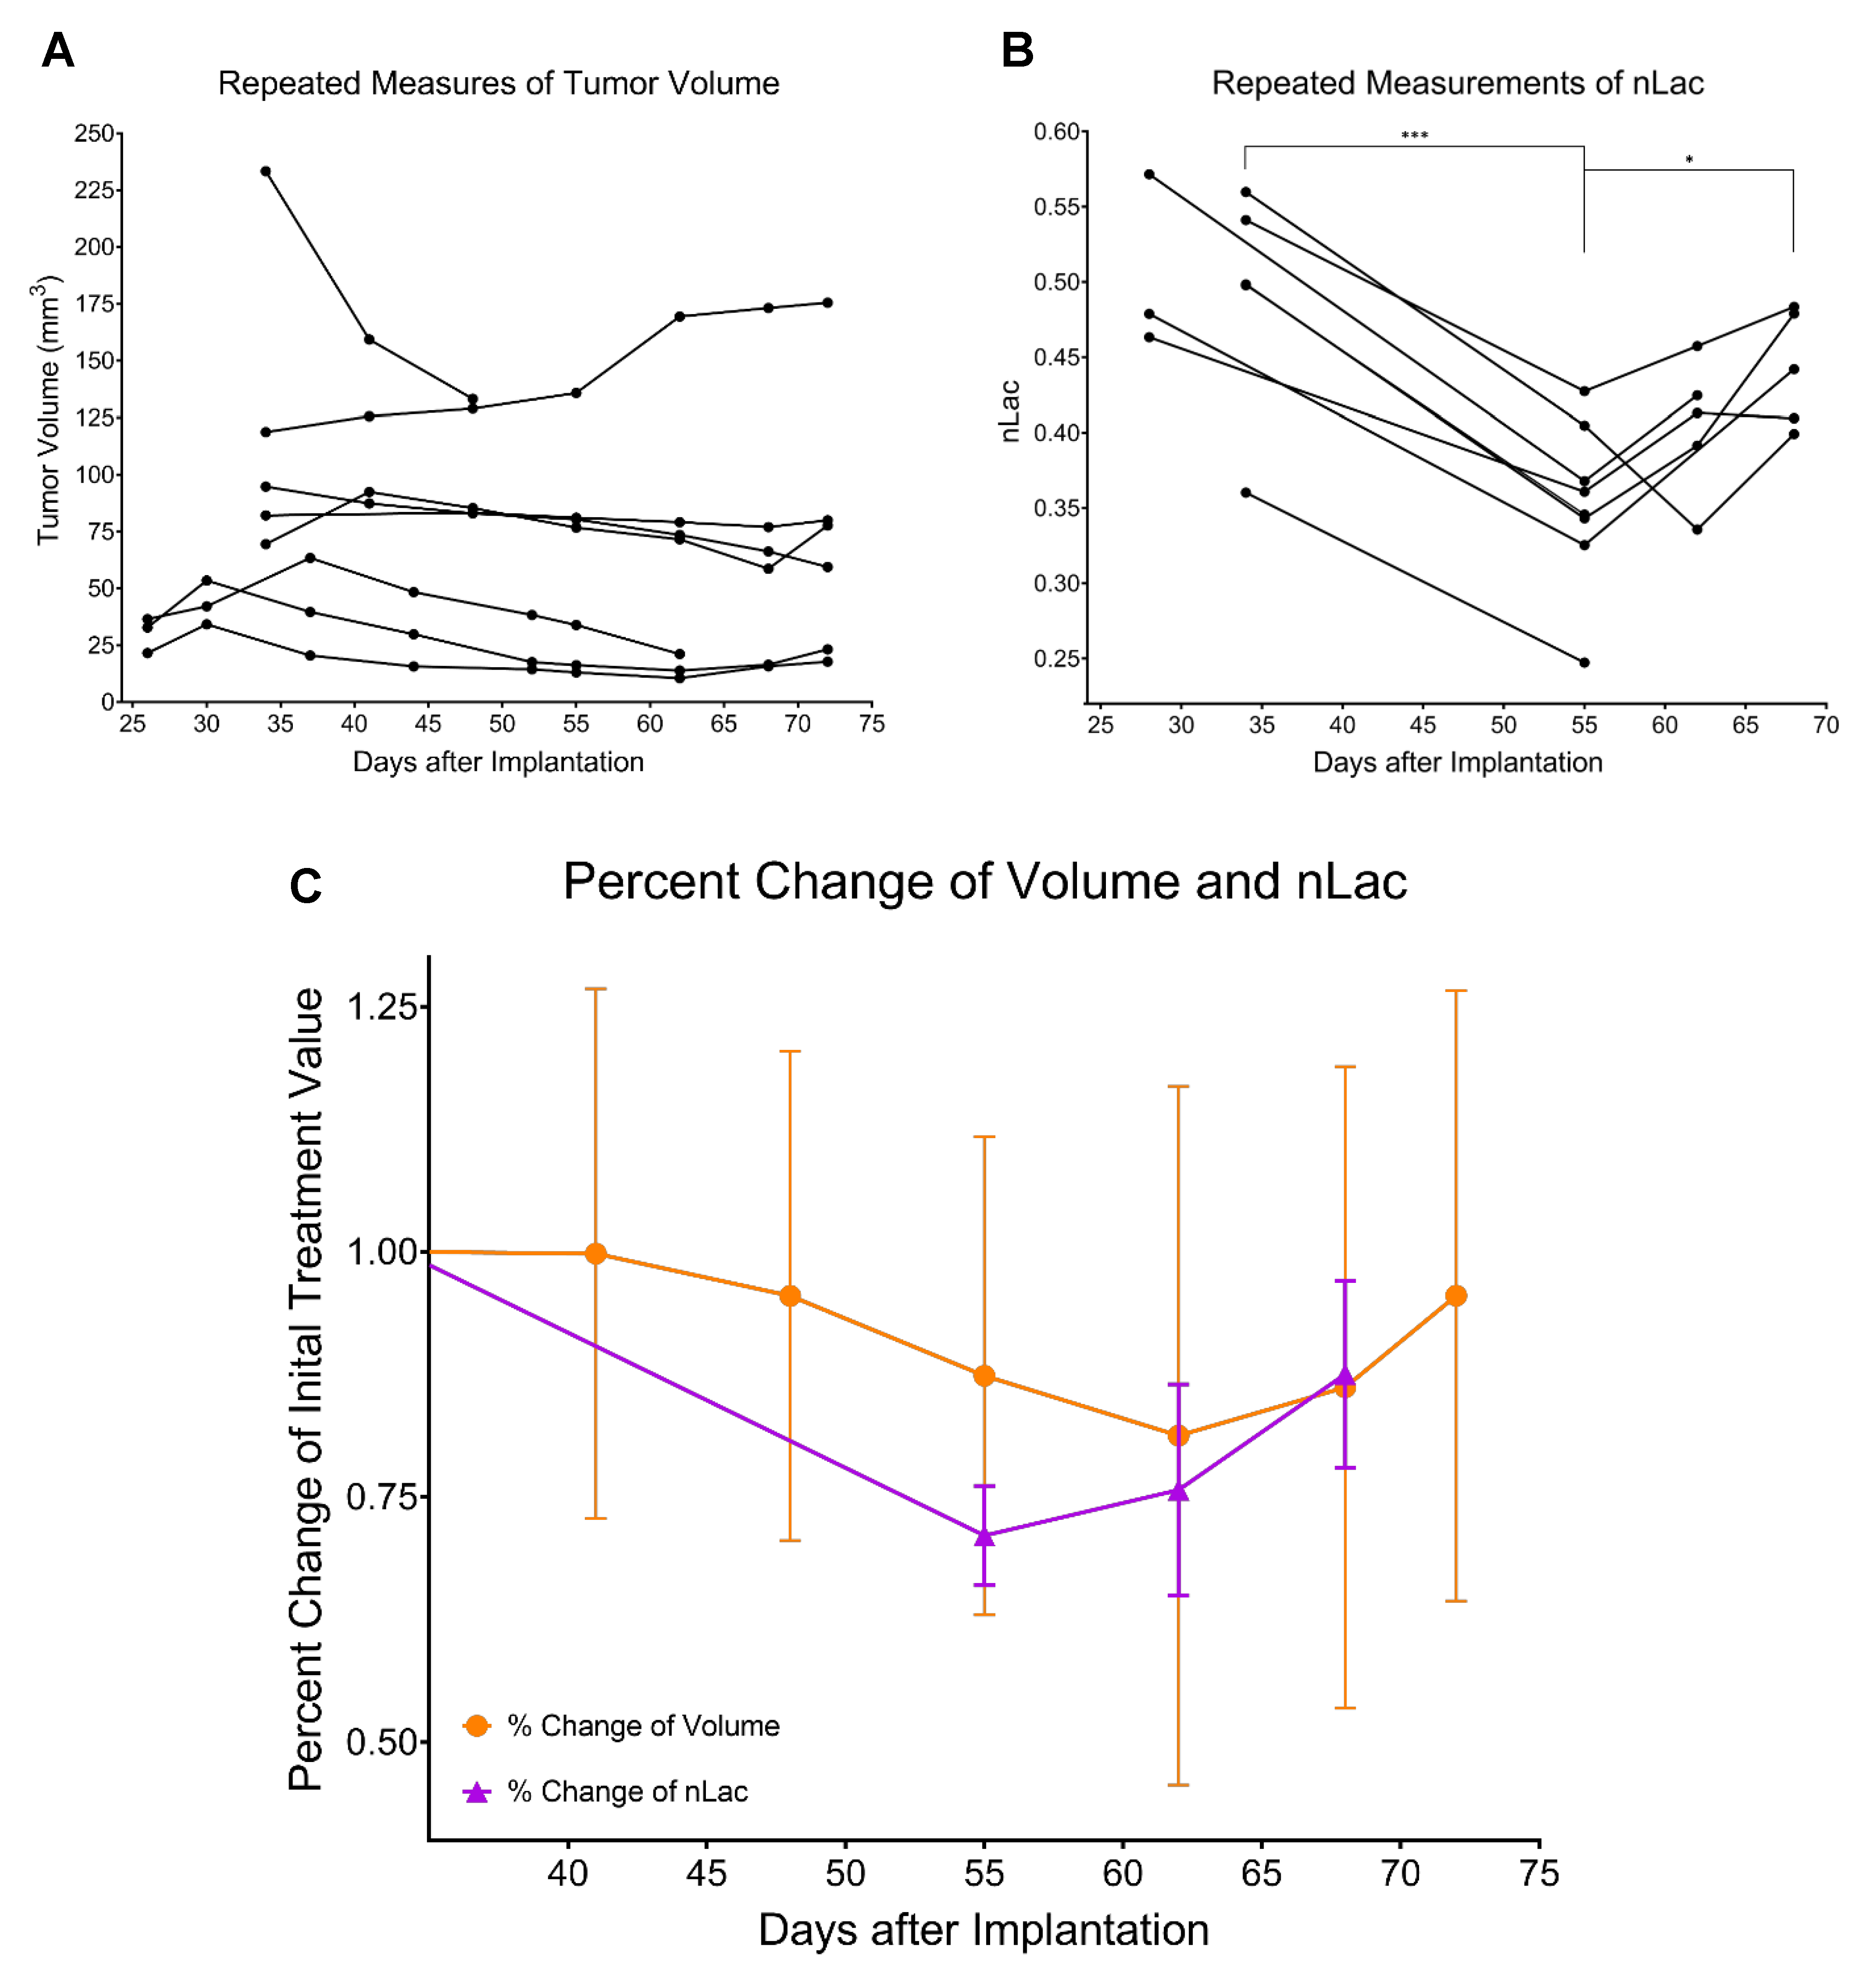
Untreated GSC 8-11 tumor-bearing mice possessed median survival of 34 days, and radiotherapy significantly extended median survival to 88 days (p<0.0001). In tumor-bearing mice following completion of radiotherapy on Day 28, tumor volume significantly increased immediately following radiotherapy by Day 34 (p=0.0090) before beginning to regress to its minimum value on Day 48 (p>0.05) (Fig. 2). In contrast, in vivo nLac was significantly decreased by Day 48 (p=0.0008) (Fig. 3). The following ex vivo metabolite pool sizes (associated with amino acid and phospholipid metabolism) were also significantly decreased by Day 48: valine (q=0.0027), alanine (q=0.0011), glycine (q=0.0021), phosphocholine (q=0.0457), and phosphoethanolamine (q=0.0401) (Fig. 4). Following regression, tumors began to recur after Day 48. Tumor volume began to increase, though no significant increase in volume was observed by Day 72 during this period. In contrast, in vivo nLac was significantly increased by Day 68 (p=0.0085). Additionally, the increasing slope of nLac over time during recurrence was nearly identical to that during initial development (0.0067 vs. 0.0069 days-1, p = 0.9415) (Fig. 5). Correlating survival data with nLac, we observed that initial nLac values after treatment could serve as a potential biomarker. Of the mice with nLac<0.4 immediately following treatment, 0/3 died from tumor burden by the Day 94 endpoint of the study. In contrast, 5/7 of the treated mice with nLac>0.4 died from tumor burden before reaching the Day 94 time-point. This led to a 100% sensitivity and 60% specificity in this limited cohort.Discussion
This is the first study to report the complete evolution of tumor metabolism with hyperpolarized magnetic resonance at multiple time-points throughout all stages of tumor progression (development, regression, and recurrence). Additionally, this is the first study to report metabolic changes during glioblastoma recurrence with this technique. These results suggest that hyperpolarized magnetic resonance can help address several challenges encountered during clinical radiotherapy treatment of glioblastoma. These include discriminating pseudoprogression from true progression shortly after radiotherapy, predicting whether patient survival will be improved shortly after administration of a treatment, quantifying tumor response to radiotherapy, and determining whether a patient is on the verge of relapse during a follow-up exam. Furthermore, these results can be combined with changes in ex vivo amino acid and phospholipid metabolism measured from tumor biopsies to further predict outcomes. Each of these scenarios would give physicians the time to take appropriate interventional action, improving the chances of patient survival.Conclusion
The value of hyperpolarized magnetic resonance is demonstrated in this study. While tumor volume is relatively slow to change significantly, measurements of tumor metabolism have proven to be a sensitive and reliable technique to monitor tumor regression and recurrence. As this technique continues through clinical trials, our hope is that this study motivates new clinical studies, and that this technique can be utliized in a variety of ways to improve overall survival of cancer patients.Acknowledgements
This research was supported by grants from the U.S. National Cancer Institute (FFL, JG, PKB; 2P50CA127001, DPW; 5 P50 CA094056-14, PKB; R21 CA185536), Institutional Research Grant (PKB and NMZ), CDMRP PC110065 (NMZ), startup grant from the University of Texas MD Anderson Cancer Center (PKB), G.E. In-kind Multi-investigator Imaging (MI2) Research Award (PKB) and generous philanthropic contributions to Koch Foundation Genitourinary Medical Oncology Funds (to PKB. DPW and CJL) and the University of Texas MD Anderson Moon Shots Program (PKB). This work was also supported by a CPRIT Research Training Grant Award (RP170067 to TCS) This work was supported by the National Institutes of Health/NCI Cancer Center Support Grant under award number P30 CA016672 and the small animal imaging facility (SAIF), and the NMR core facility at MD Anderson Cancer Center.References
1. Salzillo, T. C. et al. Interrogating Metabolism in Brain Cancer. Magn. Reson. Imaging Clin. N. Am. 24, 687–703 (2016).
2. Hu, J., Salzillo, T. C., Sailasuta, N., Lang, F. F. & Bhattacharya, P. Interrogating IDH Mutation in Brain Tumor: Magnetic Resonance and Hyperpolarization. Top. Magn. Reson. Imaging 26, 27–32 (2017).
3. Miloushev, V. Z. et al. Metabolic Imaging of the Human Brain with Hyperpolarized 13 C Pyruvate Demonstrates 13 C Lactate Production in Brain Tumor Patients. Cancer Res. 78, 3755–3760 (2018).
4. Gordon, J. W. et al. Translation of Carbon‐13 EPI for hyperpolarized MR molecular imaging of prostate and brain cancer patients. Magn. Reson. Med. 81, 2702–2709 (2019).
5. Park, I. et al. Development of methods and feasibility of using hyperpolarized carbon-13 imaging data for evaluating brain metabolism in patient studies. Magn. Reson. Med. 80, 864–873 (2018).
6. Mammoli, D. et al. Kinetic Modeling of Hyperpolarized Carbon-13 Pyruvate Metabolism in the Human Brain. IEEE Trans. Med. Imaging 39, 320–327 (2020).
7. Seyfried, T. N. et al. Metabolic management of brain cancer. Biochim. Biophys. Acta - Bioenerg. 1807, 577–594 (2011).
8. Libby, C. J., Tran, A. N., Scott, S. E., Griguer, C. & Hjelmeland, A. B. The pro-tumorigenic effects of metabolic alterations in glioblastoma including brain tumor initiating cells. Biochim. Biophys. Acta - Rev. Cancer 1869, 175–188 (2018).
9. Robertson-Tessi, M., Gillies, R. J., Gatenby, R. A. & Anderson, A. R. A. Impact of Metabolic Heterogeneity on Tumor Growth, Invasion, and Treatment Outcomes. Cancer Res. 75, 1567–1579 (2015).
Figures