3577
Dual-Phase Imaging of Cardiac Metabolism using Hyperpolarized [1-13C]Pyruvate
Junjie Ma1, Craig R. Malloy1,2,3, Crystal E. Harrison1, James Ratnakar1, Galen D. Reed4, Vlad G. Zaha1,2, and Jae Mo Park1,3,5
1Advanced Imaging Research Center, UT SOUTHWESTERN MEDICAL CENTER, Dallas, TX, United States, 2Internal Medicine, UT Southwestern Medical Center, Dallas, TX, United States, 3Radiology, UT Southwestern Medical Center, Dallas, TX, United States, 4GE Healthcare, Dallas, TX, United States, 5Electrical and Computer Engineering, UT Dallas, Richardson, TX, United States
1Advanced Imaging Research Center, UT SOUTHWESTERN MEDICAL CENTER, Dallas, TX, United States, 2Internal Medicine, UT Southwestern Medical Center, Dallas, TX, United States, 3Radiology, UT Southwestern Medical Center, Dallas, TX, United States, 4GE Healthcare, Dallas, TX, United States, 5Electrical and Computer Engineering, UT Dallas, Richardson, TX, United States
Synopsis
A dual-phase 13C imaging sequence that acquires multi-echo images of hyperpolarized [1-13C]pyruvate, [1-13C]lactate, [1-13C]alanine and [13C]bicarbonate was implemented to acquire metabolic data at both end systole and end diastole from the human heart in a single injection. The proposed method was demonstrated in short-axis and long-axis ventricle views.
Background
Metabolic imaging with hyperpolarized (HP) [1-13C]pyruvate can assess cardiac metabolism and function and measures key enzymes such as pyruvate dehydrogenase and lactate dehydrogenase. Despite the active developments of accelerated imaging methods and recent clinical translation to humans,1,2 most cardiac imaging studies using HP pyruvate for humans were conducted with single-phase acquisition during the diastole for minimizing cardiac motion artifacts. Coronary flow and oxygen delivery is maximal during diastole and essentially zero during systole, but little is known about possible differences in metabolism in these two phases of the cardiac cycle. The ability to track cardiac function (by convention cine MRI) plus metabolism in the same region would provide an integrated picture of the metabolism-function relationship in patients. In this study, we implemented a dual-phase cardiac-gated pulse sequence for imaging HP [1-13C]pyruvate and products in the human heart during a single injection. The performance of the method was demonstrated with a healthy subject with two acquisitions at end systole and end diastole per cardiac cycle for each metabolite.Methods
A cardiac-gated 13C spiral imaging sequence with two different trigger delays was implemented for the study. A spectral-spatial RF pulse was designed for single-metabolite excitation of [1-13C]pyruvate or one of the products, depending on the excitation frequency.3 HP [13C]bicarbonate, [1-13C]lactate, [1-13C]alanine and [1-13C]pyruvate were excited with the RF pulse in an interleaved manner and imaged with interval of 1 R-R. In each timepoint, two RF excitations with a variable flip angle scheme (up to 90° for products and up to 10° for pyruvate) were used. The RF excitations were followed by three echoes with two trigger delays targeting end systole and end diastole of the cardiac cycle. 1H cardiac cine imaging was also conducted to confirm the timings for these two phases. The overall acquisition schemes are shown in Fig. 1. The RF pulse and the slice-selective gradient waveform (Gz) are shown in Fig. 2(A). The spectral-spatial excitation profiles, simulated using MATLAB4 and tested in the scanner, are shown in Fig. 2(B). The simulated transverse signal in log scale at the center of image slice (dotted white line) showed 90° excitation in the passband (full width at half maximum = 134.4 Hz) and less than 1% excitation in the stopband.All the data were acquired at a GE 3T 750w wide-bore scanner. The body coil was used for all 1H imaging. A two-loop 13C transmit-receive Helmholtz coil was used (diameter = 20 cm; PulseTeq Limited, Chobham, Surrey, UK) for the HP 13C imaging. A healthy subject was recruited (male, 62 y.o.) for the study. After positioning the subject in the magnet, horizontal long-axis (HLA), vertical long-axis (VLA) and short-axis (SA)/long-axis (LA) images were acquired using a 1H balanced steady-state free precession sequence, which was triggered to mid-diastole during expiration breath-hold. GMP-grade [1-13C]pyruvic acid (Sigma Aldrich, St. Louis, MO) was prepared in clinical fluid paths (0.40 mL/kg body weight of 250-mM HP [1-13C]pyruvate solution, injection rate = 5 mL/s). Two injections of HP pyruvate were performed with a 30-min interval between injections. The SA data were acquired after the first 13C injection and LA data were acquired after the second injection. For both 13C acquisitions, the same acquisition parameters were used (FOV = 40 cm × 40 cm, spatial resolution = 1.0 cm × 1.0 cm, slice thickness = 30 mm, # echoes = 3, # timepoints = 16, injection-to-scan time = 15 s). The subject was instructed to hold his breath in expiration for ~20 s, followed by a shallow breathing to minimize the respiratory motion. All the acquired data were reconstructed using MATLAB (MathWorks, Natick, MA, USA).
Results and Discussion
Fig. 3(A) shows the 1H images for human heart in a SA plane with two different trigger delays: one was at end systole and the other was at end diastole. The dynamic changes of HP [13C]bicarbonate, [1-13C]lactate, [1-13C]alanine and [1-13C]pyruvate in the two phases from 15 s to 35 s post the injection of pyruvate are shown in Fig. 3(B). HP 13C images at the two cardiac phases in the LA plane are shown in Fig. 4. Two different phases could be clearly distinguished for all HP metabolites. As anticipated, the left ventricular cavity observed on the HP pyruvate image is smaller during systole. The bicarbonate and lactate images show a smaller cross-section of the LV myocardium and an apparent increase in signal which is presumably due to myocardial thickening resulting in less partial volume effects. Interestingly, the total alanine signal was higher in diastole in both short and long axis images. Future studies will include a larger number of subjects with compartmental kinetic analysis in relation to the corresponding 1H multi-phase images.Conclusion
In summary, we proposed a metabolite-selective dual-phase spiral imaging sequence for HP [1-13C]pyruvate imaging of human heart. In vivo studies using both short-axis and long-axis views of the left ventricle demonstrated the feasibility of dynamic imaging of HP 13C-metabolites at end systole and end diastole, acquired during a single injection of HP pyruvate.Acknowledgements
Personnel Support: We appreciate the clinical research team of the Advanced Imaging Research Center at UT Southwestern –Jeannie Baxter, RN, Kelley Derner, RN, Salvador Pena, and Maida Tai.
Funding: National Institutes of Health of the United States (R01 NS107409, P41 EB015908); The Welch Foundation (I-2009-20190330); UT Dallas Collaborative Biomedical Research Award (UTD 1907789).
References
- Rider, O. J., et al. Noninvasive In Vivo Assessment of Cardiac Metabolism in the Healthy and Diabetic Human Heart Using Hyperpolarized 13C MRI. Circulation research. 2020;126:725–736.
- Cunningham, C. H., et al. Hyperpolarized 13C Metabolic MRI of the Human Heart. Initial Experience. Circulation research. 2016;119:1177–1182.
- J. Ma, et al. In Vivo T2* Mapping of Hyperpolarized 13C-Labeled Metabolites Using a Metabolite-Selective Multi-Echo Spiral Imaging Sequence. Proceedings of the ISMRM 2020. #3051.
- Larson, P. E. Z., et al. Multiband excitation pulses for hyperpolarized 13C dynamic chemical-shift imaging. Journal of magnetic resonance. 2008;194:121–127.
Figures
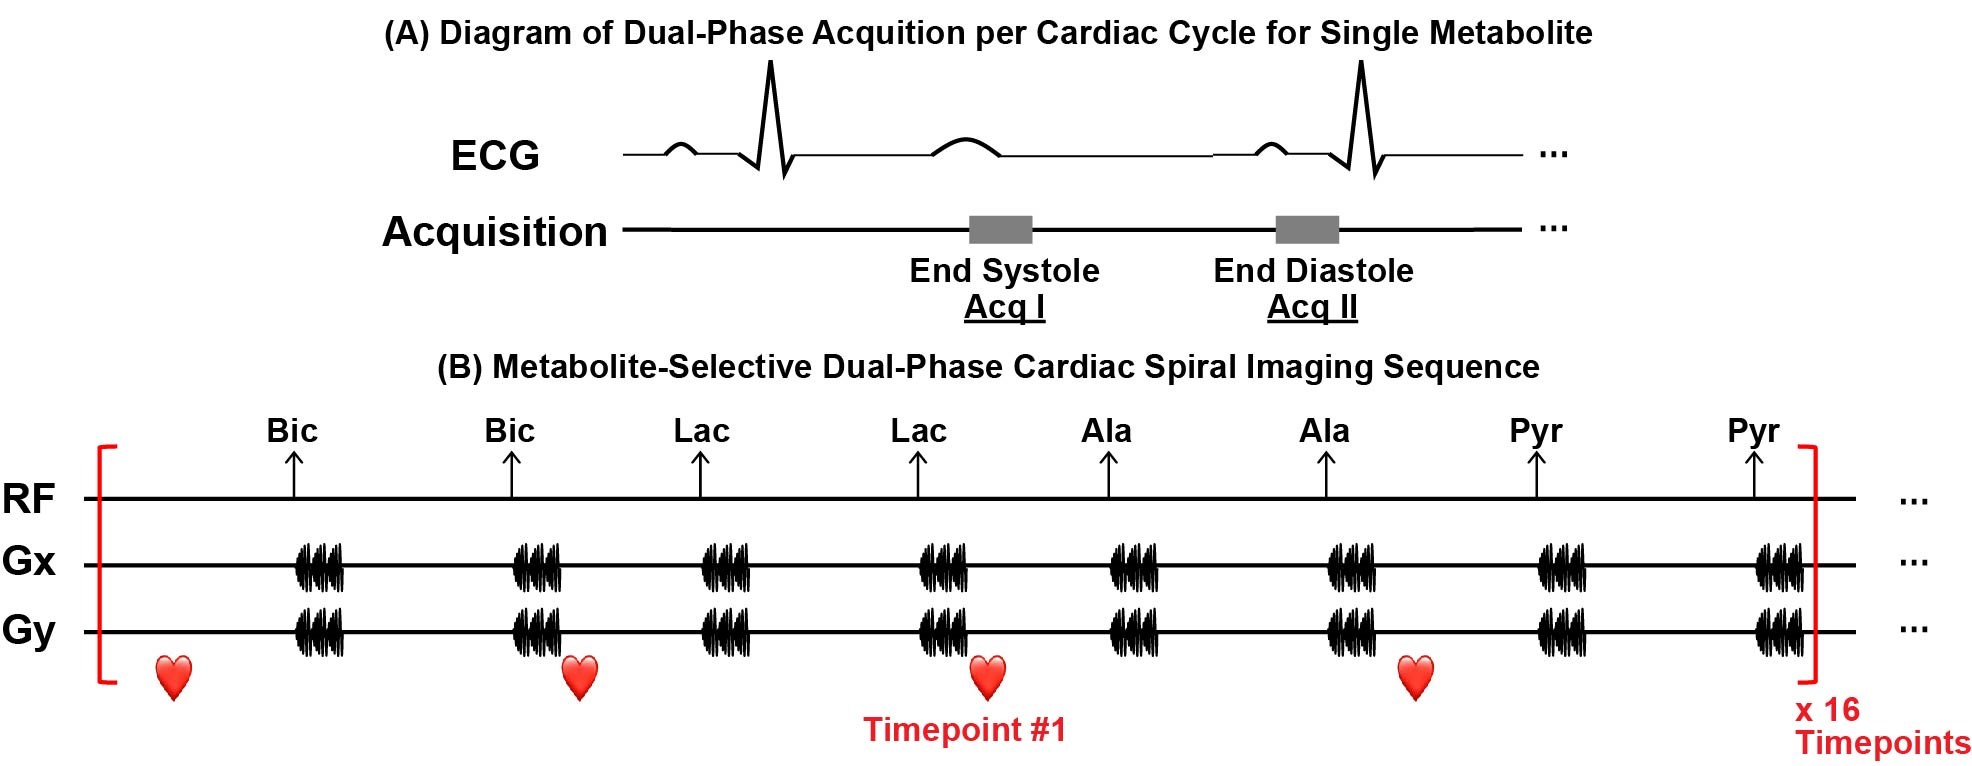
Figure 1. Acquisition scheme for each metabolite
and the proposed imaging sequence. (A) For
each metabolite, two acquisitions were conducted during each cardiac cycle,
which are at end systole and end diastole, respectively. (B) Multi-echo
images for hyperpolarized [13C]bicarbonate, [13C]lactate,
[1-13C]alanine and [1-13C]pyruvate are acquired in order
with the interval of 1 R-R for each timepoint. Images from in total 16
timepoints are acquired.
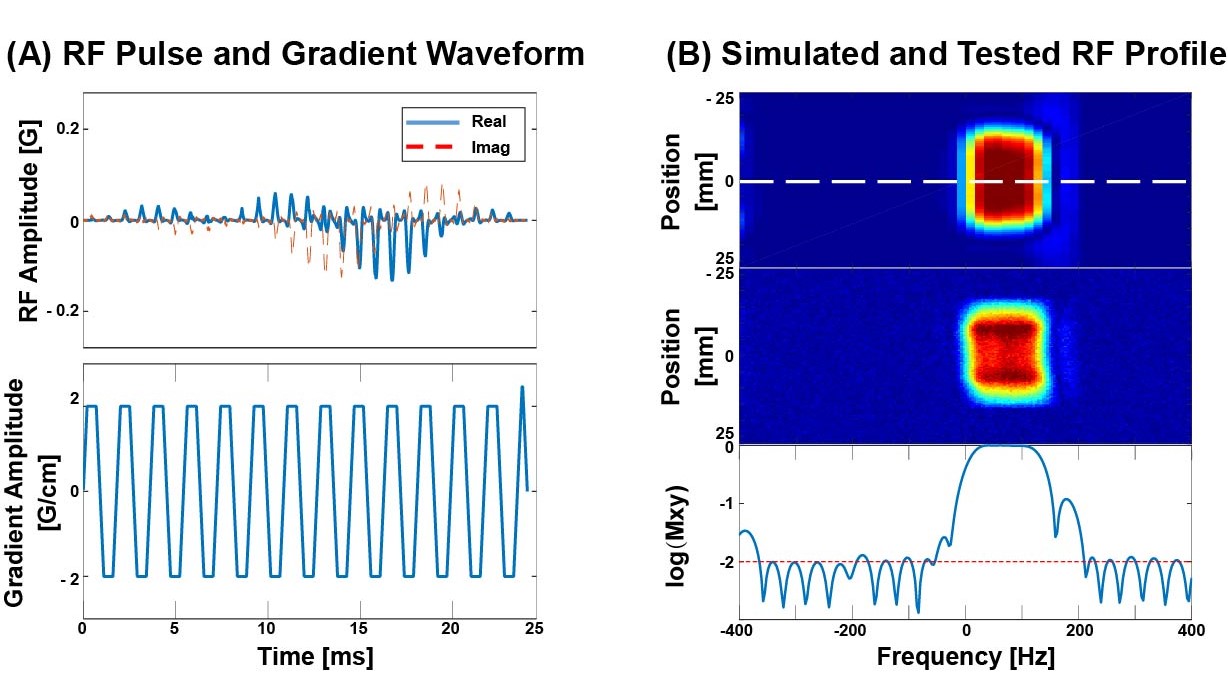
Figure 2. Spectral-spatial RF
pulse. (A) Spectral-spatial RF pulse
and slice-selective gradient waveforms used for [13C]bicarbonate, [1-13C]lactate,
[1-13C]alanine and [1-13C]pyruvate excitation, and (B)
the simulated (top) and tested (middle) excitation profile. The simulated
spectral profile at the center of the slice (dotted white line in the top
figure) in log scale is shown at the bottom.
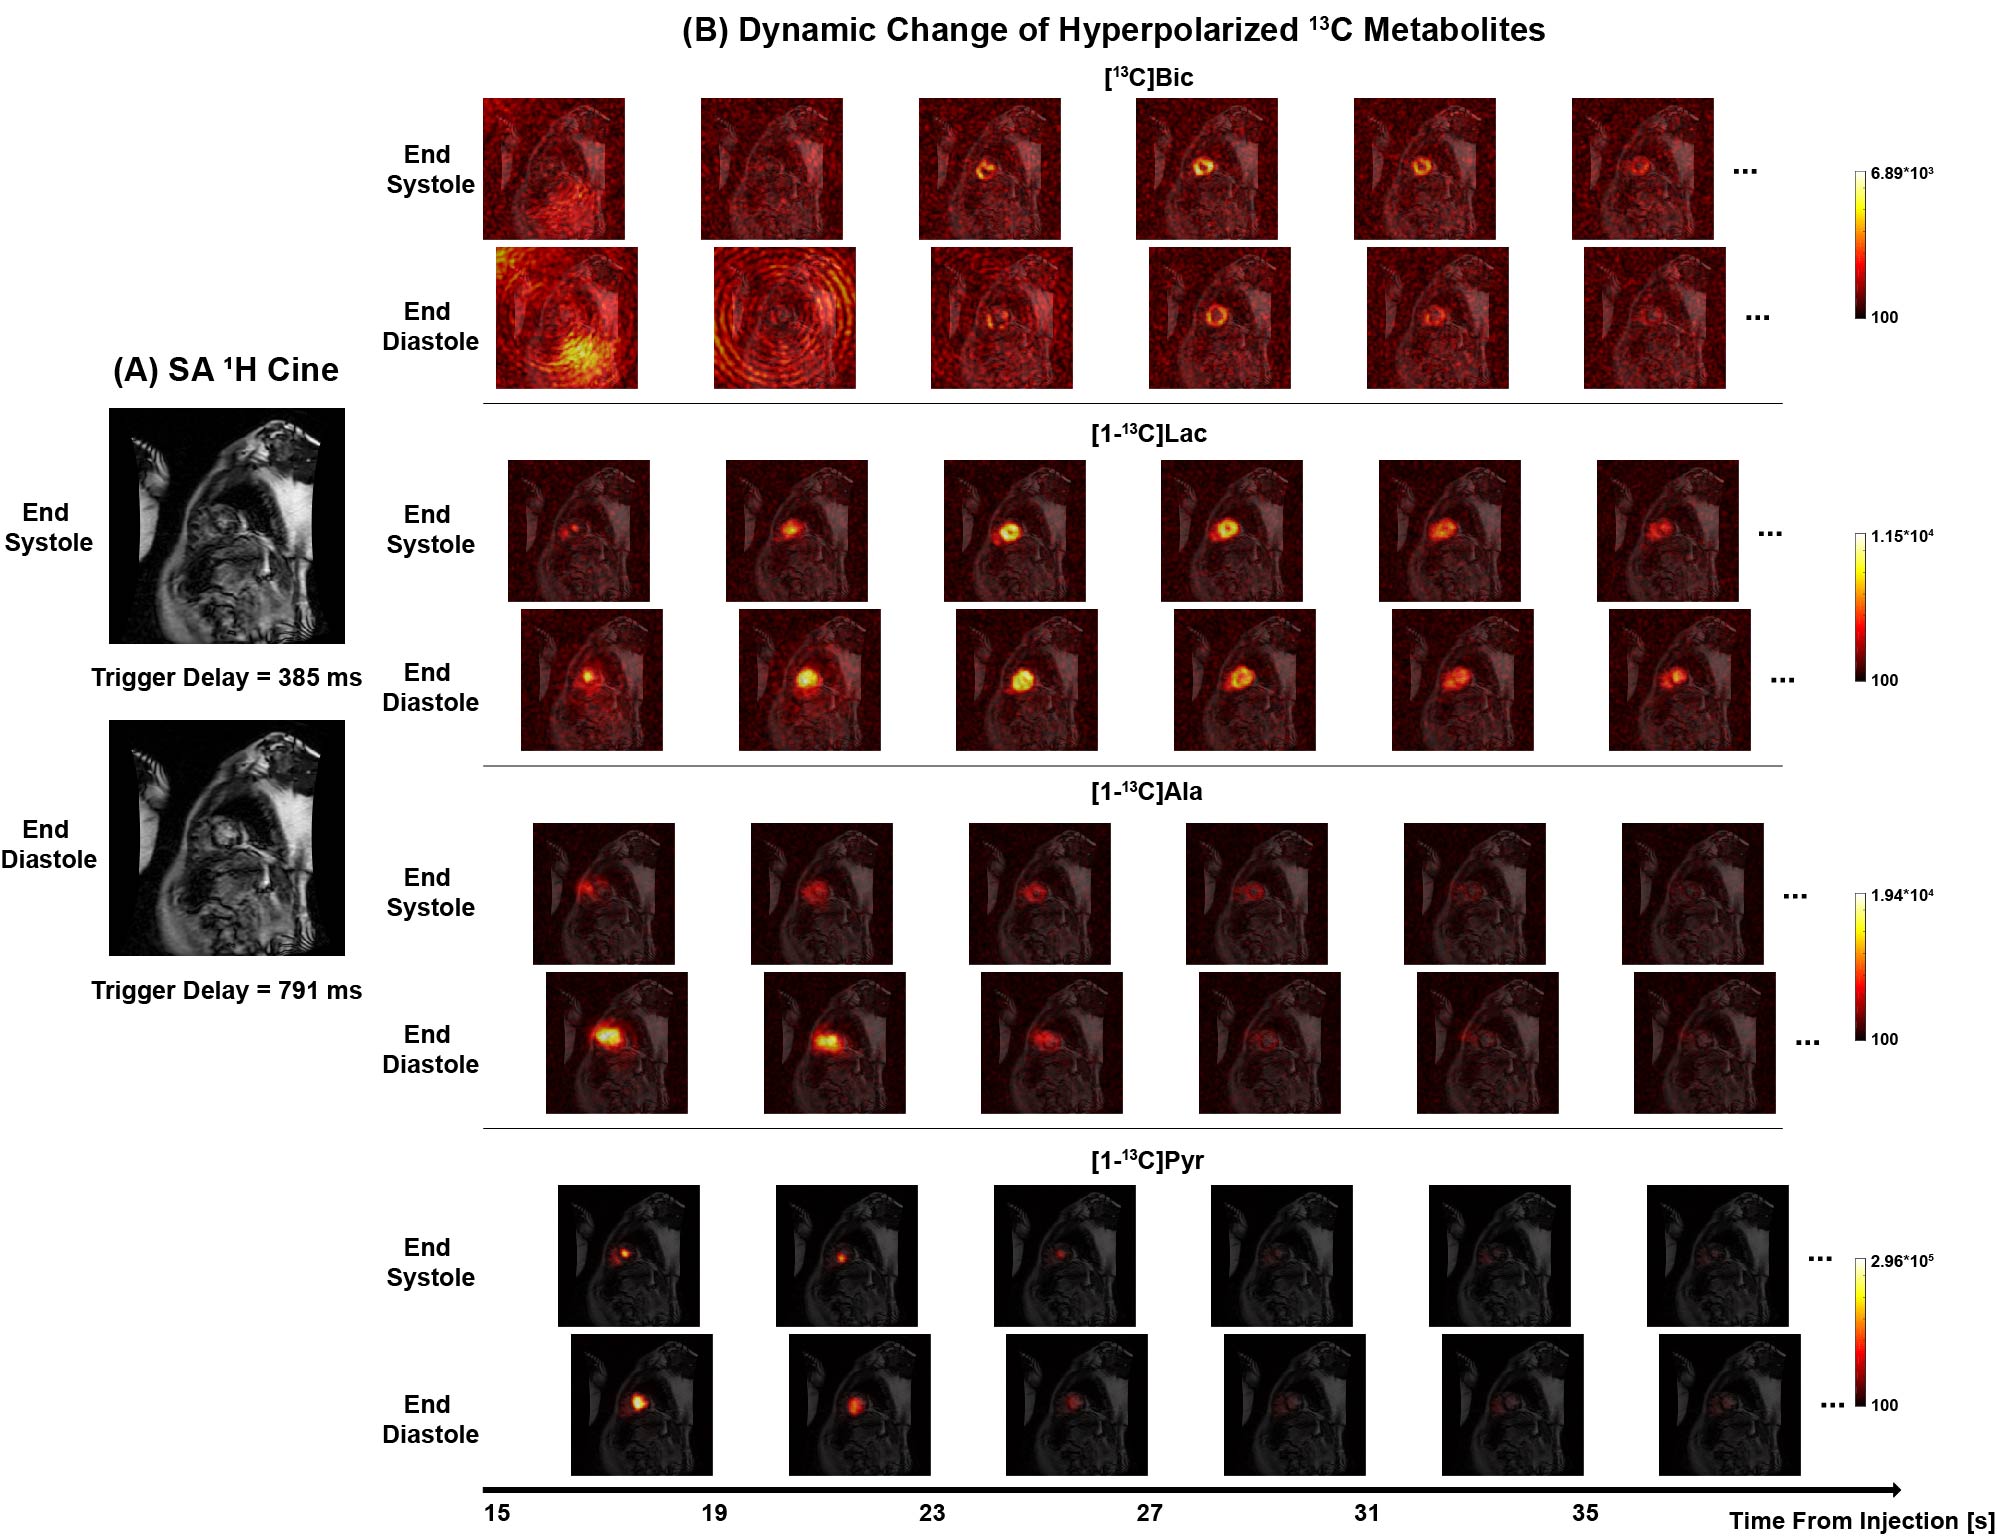
Figure 3. Dual-phase hyperpolarized [1-13C]pyruvate
cardiac imaging in SA plane. (A) 1H cardiac images in SA plane with the trigger delays of 385 ms (end systole)
and 791 ms (end diastole) respectively from a healthy subject. (B)
Dynamic change of hyperpolarized [13C]bicarbonate, [1-13C]lactate,
[1-13C]alanine and [1-13C]pyruvate in two phases from 15
s to 35 s post the injection of pyruvate.
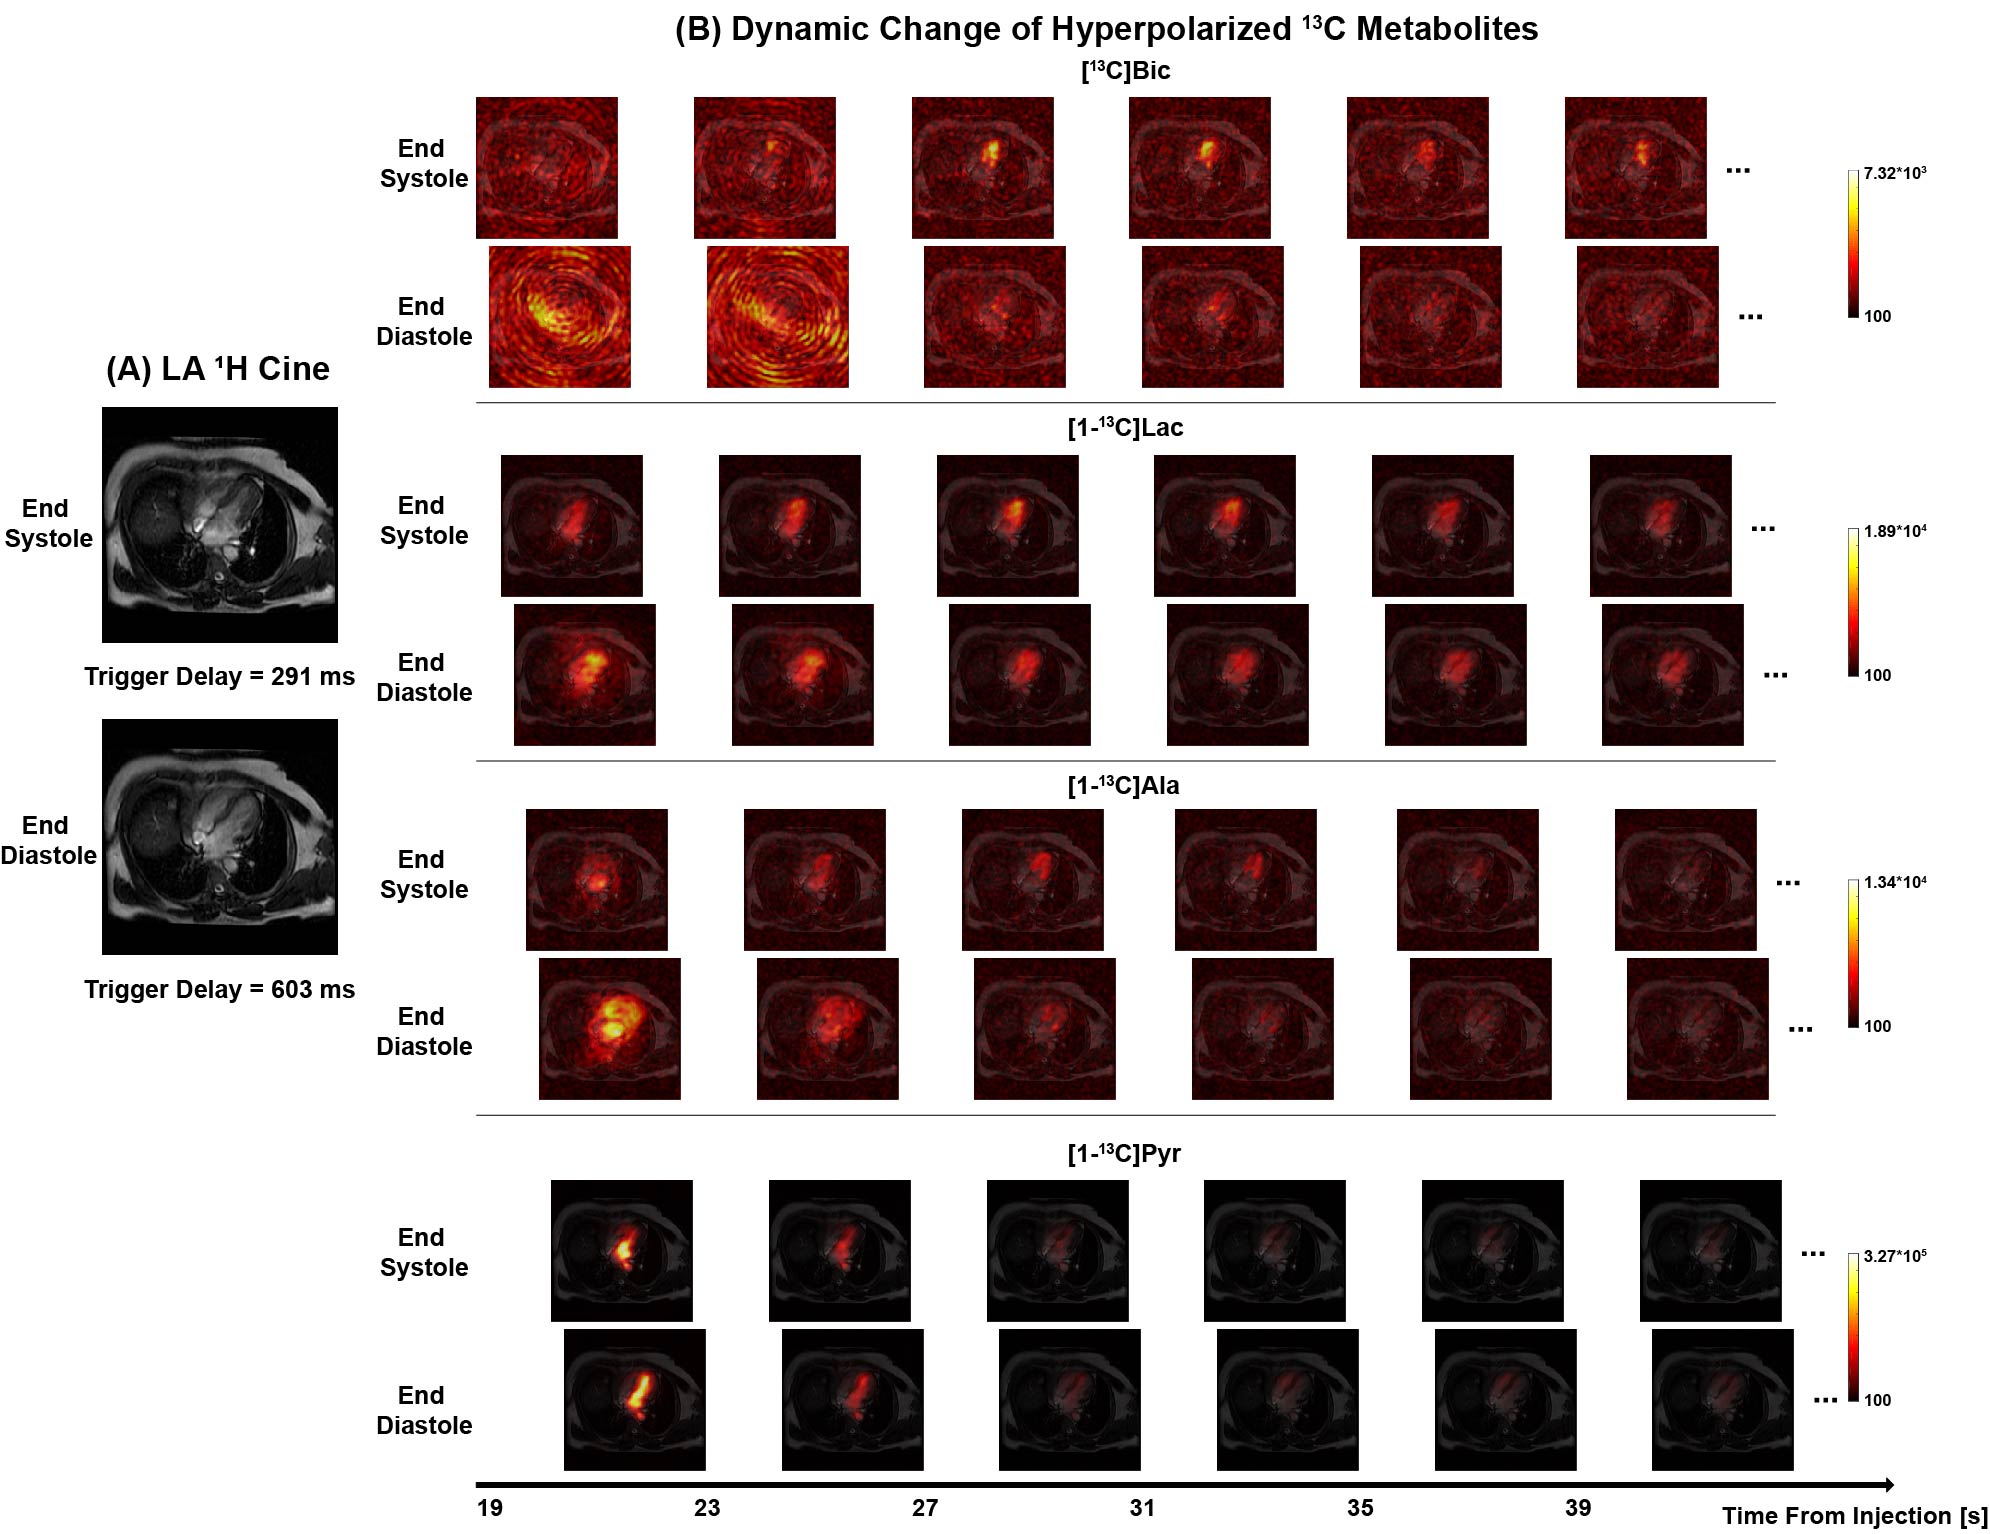
Figure 4. Dual-phase
hyperpolarized [1-13C]pyruvate cardiac imaging in LA plane. (A) 1H cardiac
images in LA plane with the trigger delays of 291 ms (end systole) and 603 ms (end
diastole) respectively from the same subject. (B) Dynamic change of
hyperpolarized [13C]bicarbonate, [1-13C]lactate, [1-13C]alanine
and [1-13C]pyruvate in two phases from 19 s to 39 s post the
injection of pyruvate.