3576
Evaluating the Fractal Nature of 129Xe MRI Ventilation Heterogeneity1St. Paul's Hospital, UBC Centre for Heart Lung Innovation, Vancouver, BC, Canada, 2Division of Respiratory Medicine, Department of Medicine, University of British Columbia, Vancouver, BC, Canada, 3Robarts Research Institute, London, ON, Canada, 4Department of Medical Biophysics, Western University, London, ON, Canada
Synopsis
Pulmonary ventilation has been shown to follow a fractal distribution using fluorescence imaging. 129Xe MRI provides high spatial-temporal resolution images of pulmonary ventilation so here, we aimed to determine the fractal properties of 129Xe MRI ventilation heterogeneity using the box-counting method. In 25 patients with asthma, MRI ventilation heterogeneity followed a power law and mean fractal dimension for MRI signal ranged from 1.39-1.82. Fractal analysis can provide a new tool to measure regional MRI ventilation heterogeneity and investigate pulmonary structure-function relationships in patients with lung disease.
Introduction
Fractals are defined by self-similarity at different length scales of evaluation and may be used to evaluate complexity of structures or processes.1 Fractals have been identified in many areas of human biology such as the airway and vascular trees in the lungs.2 Ventilation distribution has also been shown to follow a fractal pattern3 using fluorescence imaging in healthy pigs at ~2cm3 resolution. 129Xe MRI now provides a way to visualize and measure pulmonary ventilation with high spatial (~0.15cm3) and temporal resolution in patients with respiratory disease,4 however the spatial heterogeneity or complexity of 129Xe MRI signal has been challenging to capture in a robust metric. While MRI ventilation heterogeneity and its comparisons with other imaging modalities are dependent on image resolution, fractal dimensions describe scale-dependent variability in a scale-independent manner.3 Our objective here was to investigate whether MRI ventilation heterogeneity follows a fractal pattern in participants with asthma and accordingly measure the fractal dimension.Methods
Participants and Data Acquisition:Participants with asthma provided written informed consent to an ethics-board-approved protocol (NCT03733535) and underwent MRI and pulmonary function tests during a single two-hour visit. 1H and 129Xe MRI were performed within five minutes of each other using a whole-body 3.0T Discovery MR750 system (GEHC, USA) with broadband imaging capabilities as previously described.5 Subjects were instructed to inhale a gas mixture from a 1.0L Tedlar bag from functional residual capacity and image acquisition was performed under breath-hold conditions. Anatomical 1H MRI was performed before 129Xe, after inhalation of 100% N2 using the whole-body radiofrequency coil and 1H fast-spoiled, gradient-recalled echo sequence with partial-echo (8s total acquisition time, repetition-time (TR)/echo-time (TE)/flip-angle=4.7ms/1.2ms/30°, field-of-view (FOV)=40x40cm, matrix=128x80 zero-padded 128x128, 15-17 slices, 15mm slice-thickness, zero gap). 129Xe static ventilation images were acquired after inhalation of 400mL 129Xe diluted to 1.0L with 4He using a quadrature flexible-vest coil and 3D fast-gradient echo sequence with partial-echo (12s total acquisition time, TR/TE/initial flip-angle=5.1ms/1.5ms/1.4°, variable flip-angle, FOV=40x40cm, matrix=128x80 zero-padded 128x128, 15-17 slices, 15mm slice-thickness, zero gap).
Data Analysis:
Static ventilation images were segmented using 3D k-means clustering to classify voxel intensities into five clusters ranging from signal void or ventilation defects (Cluster1) to hyperintense signal (Cluster5).6 Ventilation defect percent (VDP) was defined as the ventilation defect volume normalized to the thoracic cavity volume. Fractal analysis was performed for each MRI cluster using the Minkowski-Bougliand box-counting method in MATLAB 2020a (Mathworks, USA)7 as shown in Figure 1 (illustrated in 2D). Grids of progressively increasing cube length L were iteratively placed over the 3D image and the number of cubes N containing MRI defect/signal was counted at each iteration. Cube lengths were 32 voxels/100mm, 16 voxels/50mm, 8 voxels/25mm, 4 voxels/12.5mm, 2 voxels/6.25mm, and 1 voxel/3.125mm. Fractal geometry is governed by a power law characterized by the fractal dimension D:
$$N(n)=k\cdot L(n)^{-D}$$
The fractal dimension was calculated as the negative slope from the linear regression of the log-log plot of L vs N. Fractal dimension characterizes the complexity and space-filling capacity of the image; the greater complexity of how MRI defects/signal fill the image space, the greater the fractal dimension. Fractal dimension was only evaluated when MRI defects/signal clusters occupied >4% of the total MRI lung volume to ensure there was sufficient signal for fractal analysis. Fractal dimensions between MRI signal clusters were compared using one-way ANOVA.
Results
We evaluated 25 participants with asthma (19 females/6 males, 57±13-years) with a range of ventilation heterogeneity (VDP=17±13%, range 1-53%). Figure 1 demonstrates visual spatial aggregation of MRI signal clusters, suggestive of fractal MRI signal behaviour. Nineteen participants (19/25, 76%) with VDP (or Cluster1 volume)>4% were used to generate fractal dimension for defect regions, 24 participants (96%) had Cluster2 volume >4%, 24 participants had Cluster3 volume >4%, and all participants had Cluster4 and Cluster5 volume >4%. All MRI clusters showed good fit with power law (all R2=0.99), and fractal dimensions were 1.39±0.24 for defect regions, 1.45±0.20 for Cluster2, 1.80±0.16 for Cluster3, 1.82±0.06 for Cluster4, and 1.56±0.22 or Cluster5 (p<0.0001, Figure 2). While all clusters of MRI signal exhibited fractal behaviour, defect regions had the greatest variance in fractal dimension and Cluster4 had the least variance.Discussion
In this proof-of-concept demonstration, we measured fractal dimensions of 129Xe MRI ventilation heterogeneity for the first time in participants with asthma. Since ventilation heterogeneity is primarily driven by airway tree abnormalities, which itself follows a fractal pattern,2 we expected that MRI ventilation would follow a fractal pattern. In fact, MRI ventilation strongly followed power law for fractal analysis (R2=0.99). This suggests spatial clustering of MRI ventilation such that ventilation in a given region is correlated with its neighbouring regions.3,8 These results open the door for fractal analysis as a new tool to investigate regional MRI ventilation heterogeneity in patients with lung disease, and provide a foundation for future studies to compare with pulmonary fractal structures/processes such as airway and vessel trees,2 pulmonary perfusion, and ventilation/perfusion mismatch.3Conclusions
129Xe MRI ventilation distribution follows a fractal distribution in participants with asthma and fractal dimension can be quantified as a novel measure of ventilation heterogeneity. Fractal analysis of imaging measurements can be used to investigate pulmonary structure-function relationships in patients with lung disease.Acknowledgements
No acknowledgement found.References
1. Mandelbrot, B. B. The fractal geometry of nature. Vol. 2 (WH freeman New York, 1982).
2. Weibel, E. R. Fractal geometry: a design principle for living organisms. The American journal of physiology 261, L361-369, doi:10.1152/ajplung.1991.261.6.L361 (1991).
3. Altemeier, W. A., McKinney, S. & Glenny, R. W. Fractal nature of regional ventilation distribution. Journal of applied physiology (Bethesda, Md. : 1985) 88, 1551-1557, doi:10.1152/jappl.2000.88.5.1551 (2000).
4. Ebner, L. et al. The role of hyperpolarized (129)xenon in MR imaging of pulmonary function. European journal of radiology 86, 343-352, doi:10.1016/j.ejrad.2016.09.015 (2017).
5. Svenningsen, S. et al. Hyperpolarized (3) He and (129) Xe MRI: differences in asthma before bronchodilation. Journal of Magnetic Resonance Imaging 38, 1521-1530, doi:10.1002/jmri.24111 (2013).
6. Kirby, M. et al. Hyperpolarized 3He magnetic resonance functional imaging semiautomated segmentation. Academic radiology 19, 141-152, doi:10.1016/j.acra.2011.10.007 (2012).
7. Moisy, F. boxcount (https://www.mathworks.com/matlabcentral/fileexchange/13063-boxcount), MATLAB Central File Exchange, 2008.
8. Glenny, R. W., Robertson, H. T., Yamashiro, S. & Bassingthwaighte, J. B. Applications of fractal analysis to physiology. Journal of applied physiology (Bethesda, Md. : 1985) 70, 2351-2367, doi:10.1152/jappl.1991.70.6.2351 (1991).
Figures
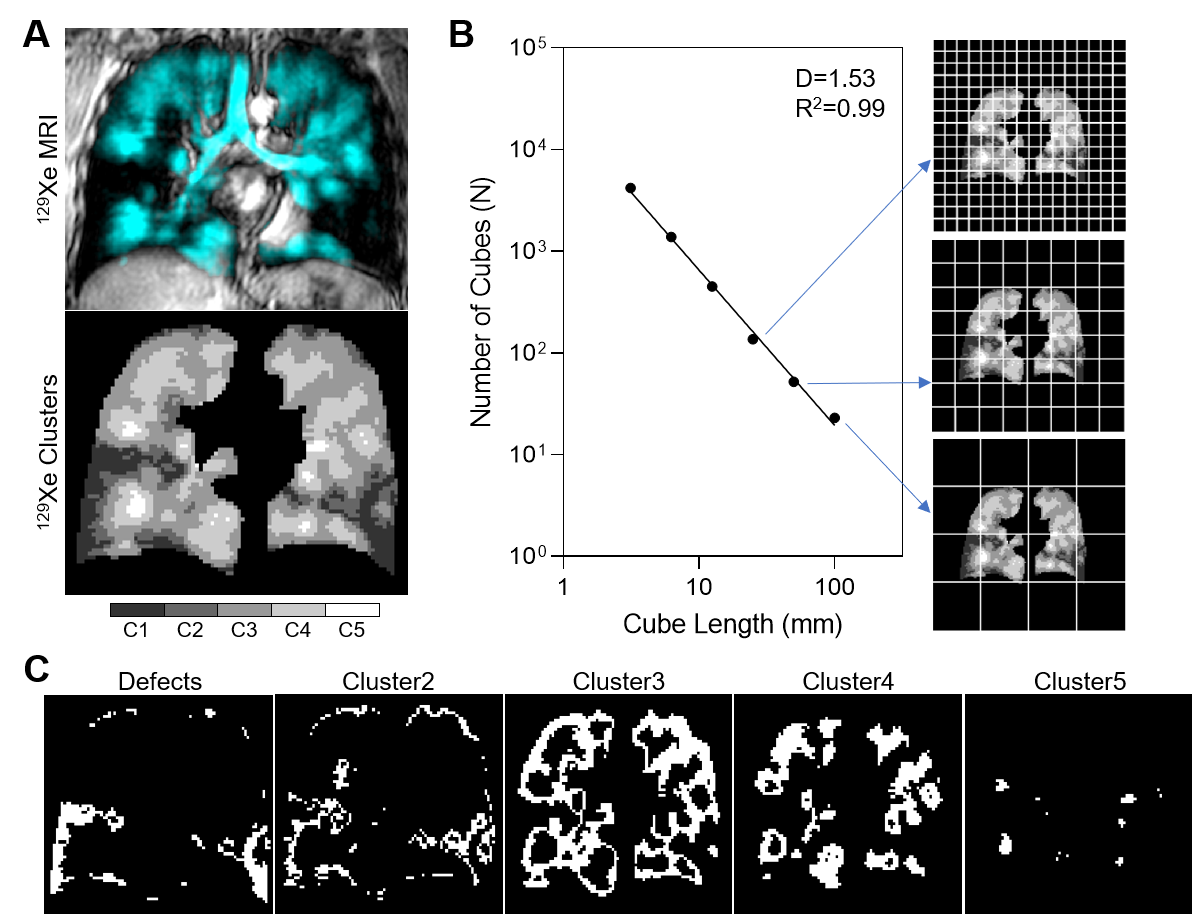
Figure 1. 129Xe MRI fractal analysis outline.
129Xe MRI static ventilation was segmented into 5 clusters of signal intensity ranging from signal void or ventilation defects to hyperintense signal (Cluster5) (A) and the box-counting method was used to calculate fractal dimension (B). Fractal dimension was calculated for each MRI signal intensity cluster (C).
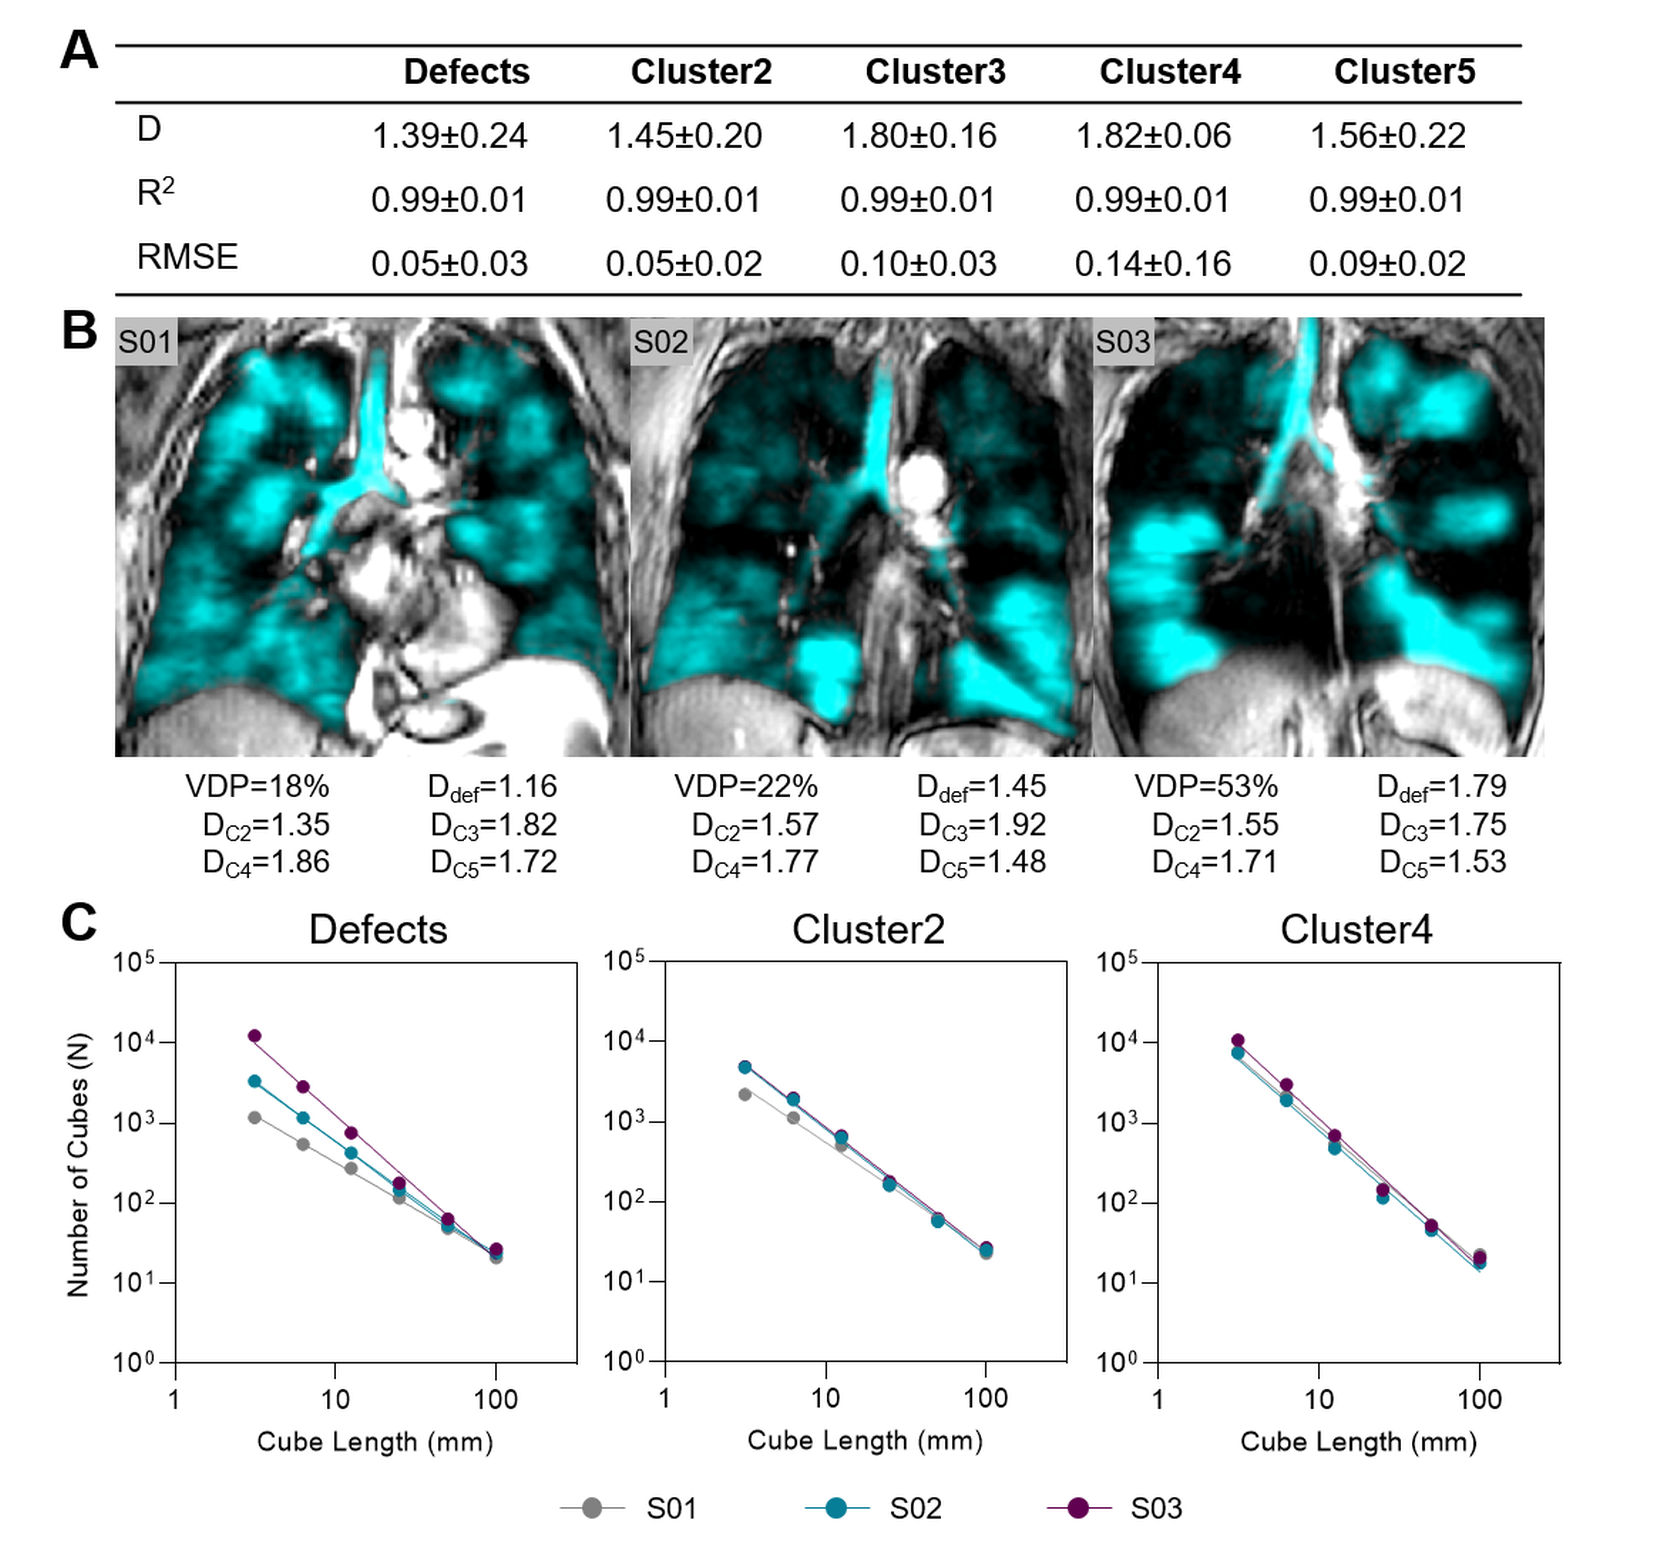
Figure 2. 129Xe MRI fractal dimension measurements.
(A) Fractal dimension (D), R2 and root-mean-squared error (RMSE) for all MRI signal clusters. (B) 129Xe MRI ventilation (cyan) co-registered to anatomical 1H (grey-scale) for representative participants with asthma with associated fractal dimensions. (C) Log-log plots showing fractal dimensions for defect regions (Cluster1), Cluster2 and Cluster4 for representative participants.