3574
The effects of an initial depolarization pulse on the dissolved phase hyperpolarized 129Xe images1Chemistry and Materials Science Program, Lakehead University, Thunder Bay, ON, Canada, 2Thunder Bay Regional Health Research Institute, Thunder Bay, ON, Canada, 3Chemistry, Lakehead University, Thunder Bay, ON, Canada, 4Thunder Bay Regional Health Sciences Centre, Thunder Bay, ON, Canada, 5Northern Ontario School of Medicine, Thunder Bay, ON, Canada
Synopsis
Hyperpolarized (HP) xenon-129 (129Xe) freely dissolves in pulmonary blood and travels to highly perfused organs. Dissolved phase HP 129Xe imaging is commonly used for evaluating gas-blood exchange in lungs, imaging cerebral perfusion, detecting hemodynamic response, and kidney perfusion. However, the signal-to-noise ratio (SNR) of HP 129Xe dissolved phase images varies between breath-holds, especially for brain imaging. In this work, we demonstrated a significant reduction in the variability of MRI image SNR by implementing an additional depolarization pulse prior to image acquisition.
Introduction
HP 129Xe dissolved phase imaging is used for studying pulmonary gas-blood exchange1,2, imaging cerebral perfusion3–6, kidney perfusion7, and detecting hemodynamic response5. Currently, there is a large signal variability associated with different breath-holds, which results in potential quantitative analysis difficulties. Recently, the HP 129Xe Time-of-Flight (TOF) technique has been developed using a time-selective depolarization of HP 129Xe with subsequent imaging5. The presence of the depolarization radiofrequency pulse causes the image signal to depend mainly on the blood perfusion and it decreases signal dependence on the amount of gas inhaled and breath-hold variability5. We hypothesized that the application of an additional broadband depolarization pulse prior to all dissolved phase image acquisition will substantially decrease signal variability between multiple breath-hold.Materials and Methods
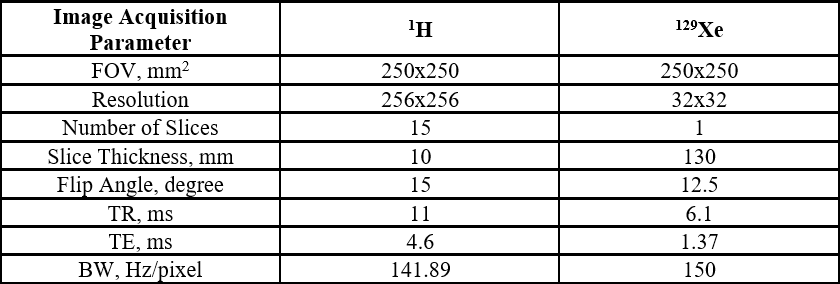
Three healthy volunteers with a mean age of 53 ± 20 years were recruited. A Philips Achieva 3T clinical MRI scanner equipped with a dual-tuned 1H/129Xe quadrature head coil (CMRS LLC, WI, USA) was used. Enriched 129Xe (~83%) was polarized up to ~50% using a commercial Xemed XeBox-E10 polarizer (Xemed LLC, NH, USA) and dispensed into six 1L Tedlar bags. Brain localization was performed using a proton gradient echo (GRE) imaging. Imaging parameters are shown in Table 1.Participants inhaled 1L of HP 129Xe gas and held their breath for 20s. Each participant performed six breath-holds. During three breath-holds, a single slice axial GRE image with Cartesian k-space sampling was acquired 9s into the breath-hold using imaging parameters shown in Table 1. During the other breath-holds, two dynamic TOF images were acquired using the same GRE parameters with a delay time between the depolarization pulse and the image acquisition of 5s and 9s. A 90O depolarization 0.5ms block pulse was applied 4s into the breath-hold.
The image reconstruction and SNR calculation were performed in custom-written MATLAB scripts (MATLAB R2016b (MathWorks, Inc, Natick, MA). A two-sample paired t-test was performed in OriginPro 2016 software (OriginLab Corp., Northampton, MA) to evaluate the mean SNR difference between the GRE images and TOF images.
Results and Discussion
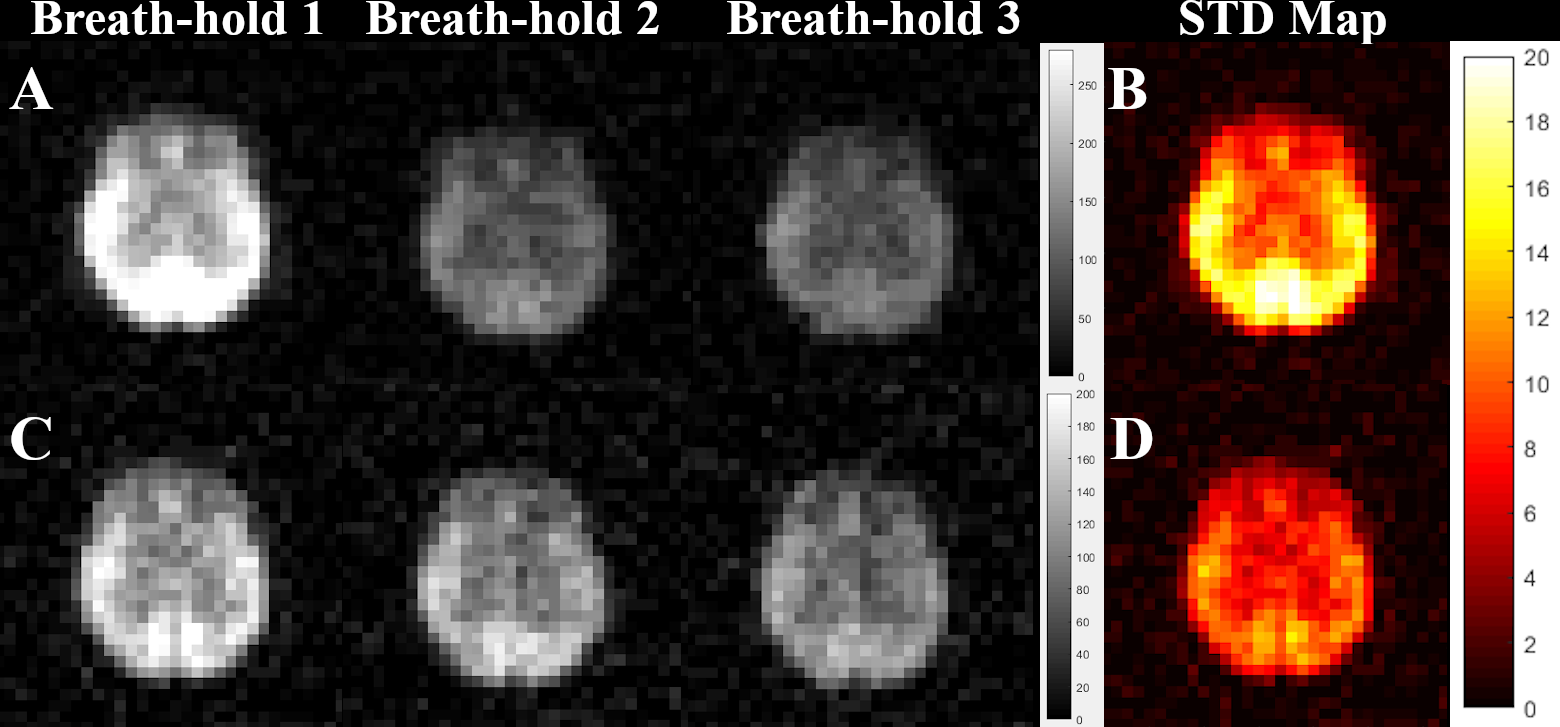
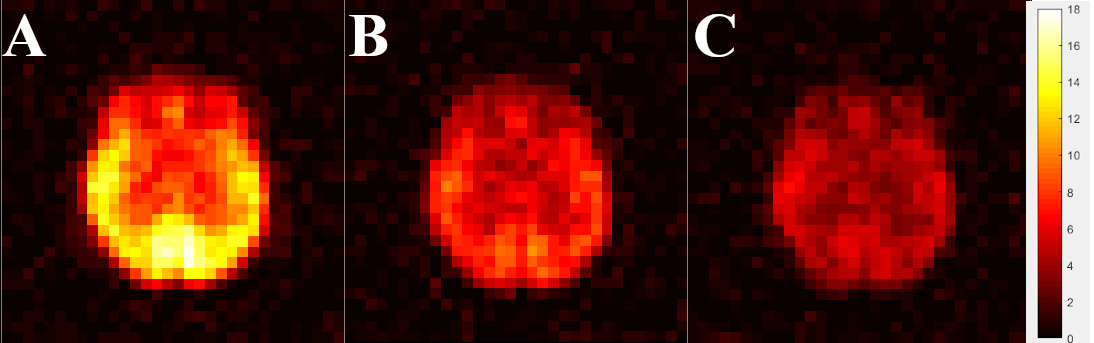
Figure 2 shows HP 129Xe brain images acquired 9s into the breath-hold (Fig. 2A) from a representative healthy volunteer. The standard deviation (STD) map (Fig. 2B) was calculated to reflect local signal variations. The STD map was inhomogeneous with higher 129Xe SNR variability in the posterior brain region compared to the anterior region. The HP 129Xe images acquired 9s after the 90O the depolarization pulse demonstrated lower signal variability (Fig. 2C). The correspondent STD map (Fig.2D) was more homogeneous compared to Fig.2B.The STD maps calculated based on all datasets are shown in Fig. 3. For images acquired without a depolarization pulse (Fig. 3A), a high level of SNR variability was observed. The STD map was highly inhomogeneous with the highest signal variability observed in the posterior brain region (mean STD = 11.85). The anterior part of the brain demonstrated the lowest SNR variability (mean STD = 7.72). Application of the initial depolarization pulse (Fig. 3B, C) significantly reduced signal variability. The STD map of HP 129Xe images acquired 9s after the depolarization pulse were more homogeneous (Fig. 3B) with a mean anterior STD of 4.84 and mean posterior STD equal to 6.85. For an image acquisition 5s after the depolarization pulse (Fig. 3C), the STD map became quite homogeneous (average anterior STD = 3.64; average posterior STD = 4.05).
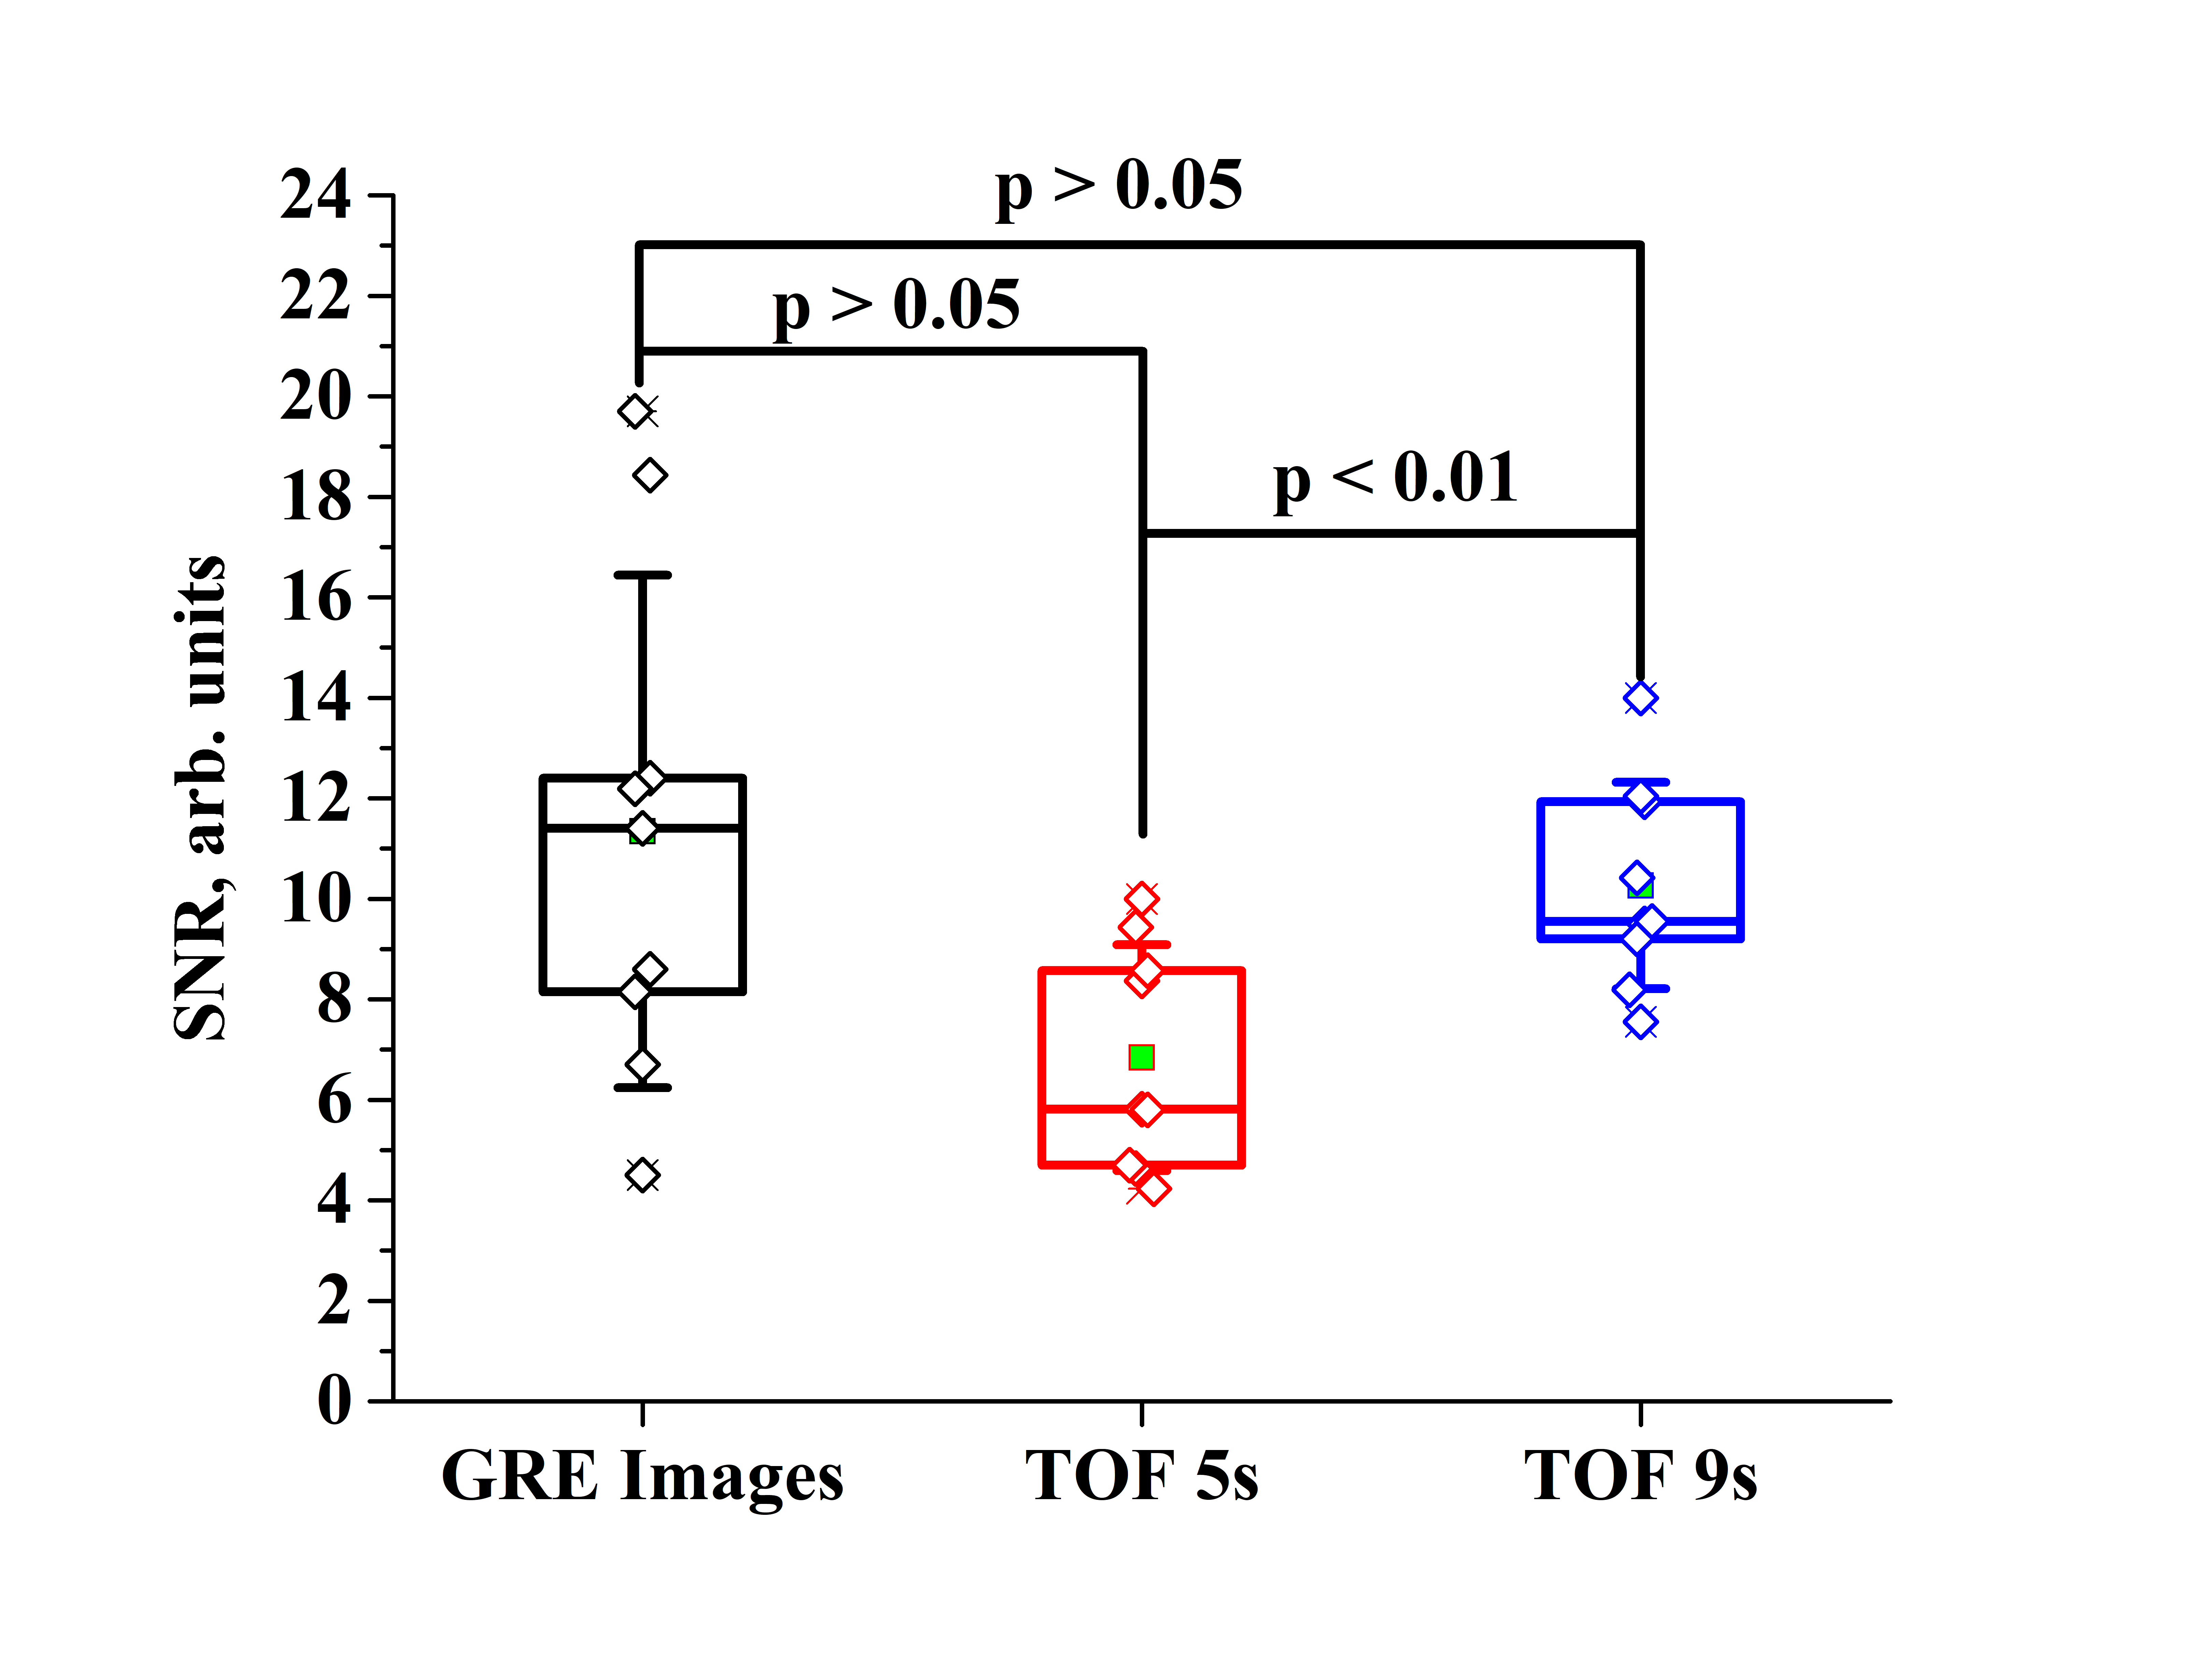
The mean SNR value of the HP 129Xe brain images acquired without a depolarization pulse was 11.34 ± 5.1 (Fig. 4). The mean SNR values of the images acquired 9s and 5s after the initial depolarization pulse were equal to 10.26 ± 2.06 and 6.83 ± 2.25, respectively (Fig. 4). The was no significant difference between the SNR values of images acquired 9s after the depolarization pulse, or 9s into the breath-hold without the depolarization pulse (p > 0.01). However, the STD of the mean SNR was two times smaller for images acquired following the depolarization pulse, which indicates a substantially smaller signal variability between breath-holds. Interestingly, a t-test indicated no significant difference between the SNR images acquired 5s after the depolarization pulse, or 9s into the breath-hold without the depolarization pulse (p > 0.01). This result originates from the large STD from the SNR image acquired without an initial depolarization pulse. On the contrary, there was significant difference between the SNR of images acquired 5s and 9s after the initial depolarization pulse (p < 0.01).
Conclusion
Our study demonstrates a substantial reduction in the signal variability of HP 129Xe dissolved in the brain due to the application of the initial 90O depolarization radiofrequency pulse. This concept can be implemented in all HP 129Xe dissolved phase imaging.Acknowledgements
This research was funded by the Ontario Research Fund (ORF-RE-09-029) and the Northern Ontario Academic Medical Association (A-18-05). The authors would like to thank Martina Agostino for contributing to abstract editing. Yurii Shepelytskyi was supported by an Ontario Graduate Fellowship. Vira Grynko is supported by an Ontario Trillium Scholarship.References
1. Qing, K. et al. Assessment of lung function in asthma and COPD using hyperpolarized 129Xe chemical shift saturation recovery spectroscopy and dissolved-phase MRI. NMR Biomed. 27(12), 1490–1501 (2014).
2. Virgincar, R. S. et al. Quantitative 129Xe MRI detects early impairment of gas-exchange in a rat model of pulmonary hypertension. Sci. Rep. 10(1), 7385 (2020).
3. Rao, M. R., Stewart, N. J., Griffiths, P. D., Norquay, G. & Wild, J. M. Imaging human brain perfusion with inhaled hyperpolarized 129Xe MR imaging. Radiology. 286(2), 659–665 (2018).
4. Rao, M. R. et al. Assessment of brain perfusion using hyperpolarized 129Xe MRI in a subject with established stroke. J. Magn. Reson. Imaging. 50(3), 1002–1004 (2019).
5. Shepelytskyi, Y. et al. Hyperpolarized 129Xe Time-of-Flight MR Imaging of Perfusion and Brain Function. Diagnostics. 10(9), 630 (2020).
6.Hane, F. et al. Inhaled Xenon Washout as a Biomarker of Alzheimer’s Disease. Diagnostics 8(2), 41 (2018).
7. Chacon‐Caldera, J. et al. Dissolved hyperpolarized xenon‐129 MRI in human kidneys. Magn. Reson. Med. 83(1), 262–270 (2019).
Figures