3570
Modelling realistic Rb density and temperature distributions in a high throughput xenon-129 polariser1POLARIS, Department of Infection, Immunity and Cardiovascular Disease, The University of Sheffield, Sheffield, United Kingdom
Synopsis
Hyperpolarised xenon-129 (129Xe) production via continuous-flow spin-exchange optical pumping often produces lower than predicted 129Xe polarisation. Frequently, thermodynamics within polariser systems is not considered, as well as spatially variant changes in rubidium (Rb) source distributions and changes in 129Xe relaxation over time. This work models realistic Rb and temperature distributions within a large-scale 129Xe-Rb polariser cell. Results show that Rb density varies significantly depending upon incident photon flux and Rb source distribution in the cell. Modelling allows estimation of the Rb presaturator length required at different gas flow rates in order to reach optimal Rb density and high 129Xe polarisation.
Introduction
Developments in large-scale production of hyperpolarised xenon-129 (129Xe) via spin-exchange optical pumping (SEOP) have resulted in the rapid volume production rates (>1L/hr) and 129Xe nuclear polarisations (PXe>20%) required for clinical MRI with hyperpolarised 129Xe1–4. Further improvements in 129Xe polarisation, whilst maintaining these production rates, would further enhance clinical MRI applications with hyperpolarised 129Xe. Most significantly, costs for routine 129Xe MRI scans would be reduced by using natural abundance Xe (26% 129Xe)5. However, there is a widely reported discrepancy between 129Xe polarisation predicted by current models and experimentally measured values. The rubidium (Rb) vapour density is a key parameter governing system performance; however, currently accepted models generally assume Rb densities given by equilibrium vapour pressure curves6, whilst neglecting the effect of underlying gas-flow thermodynamics within the SEOP cell. In addition, changes in Rb source distribution with polariser use from repeated thermal cycles of evaporation and deposition of Rb, along with observed increases in 129Xe relaxation rates (1/T1 = Γ′) over time, can lead to a degradation in polariser performance7,8. In order to address this, many polarisers employ a Rb pre-saturation region (presaturator) upstream from the illuminated region of the SEOP cell9. However, lower than optimal/predicted Rb densities have been observed to date4,10. The aim of this work is to generate models of Rb vapour density and temperature distributions for different Rb source locations, and to incorporate these into an existing SEOP model3 in order to gain insight into the discrepancy between theoretical and experimental polariser performance. The effect of higher Γ′ on 129Xe polarisation is also investigated.Methods
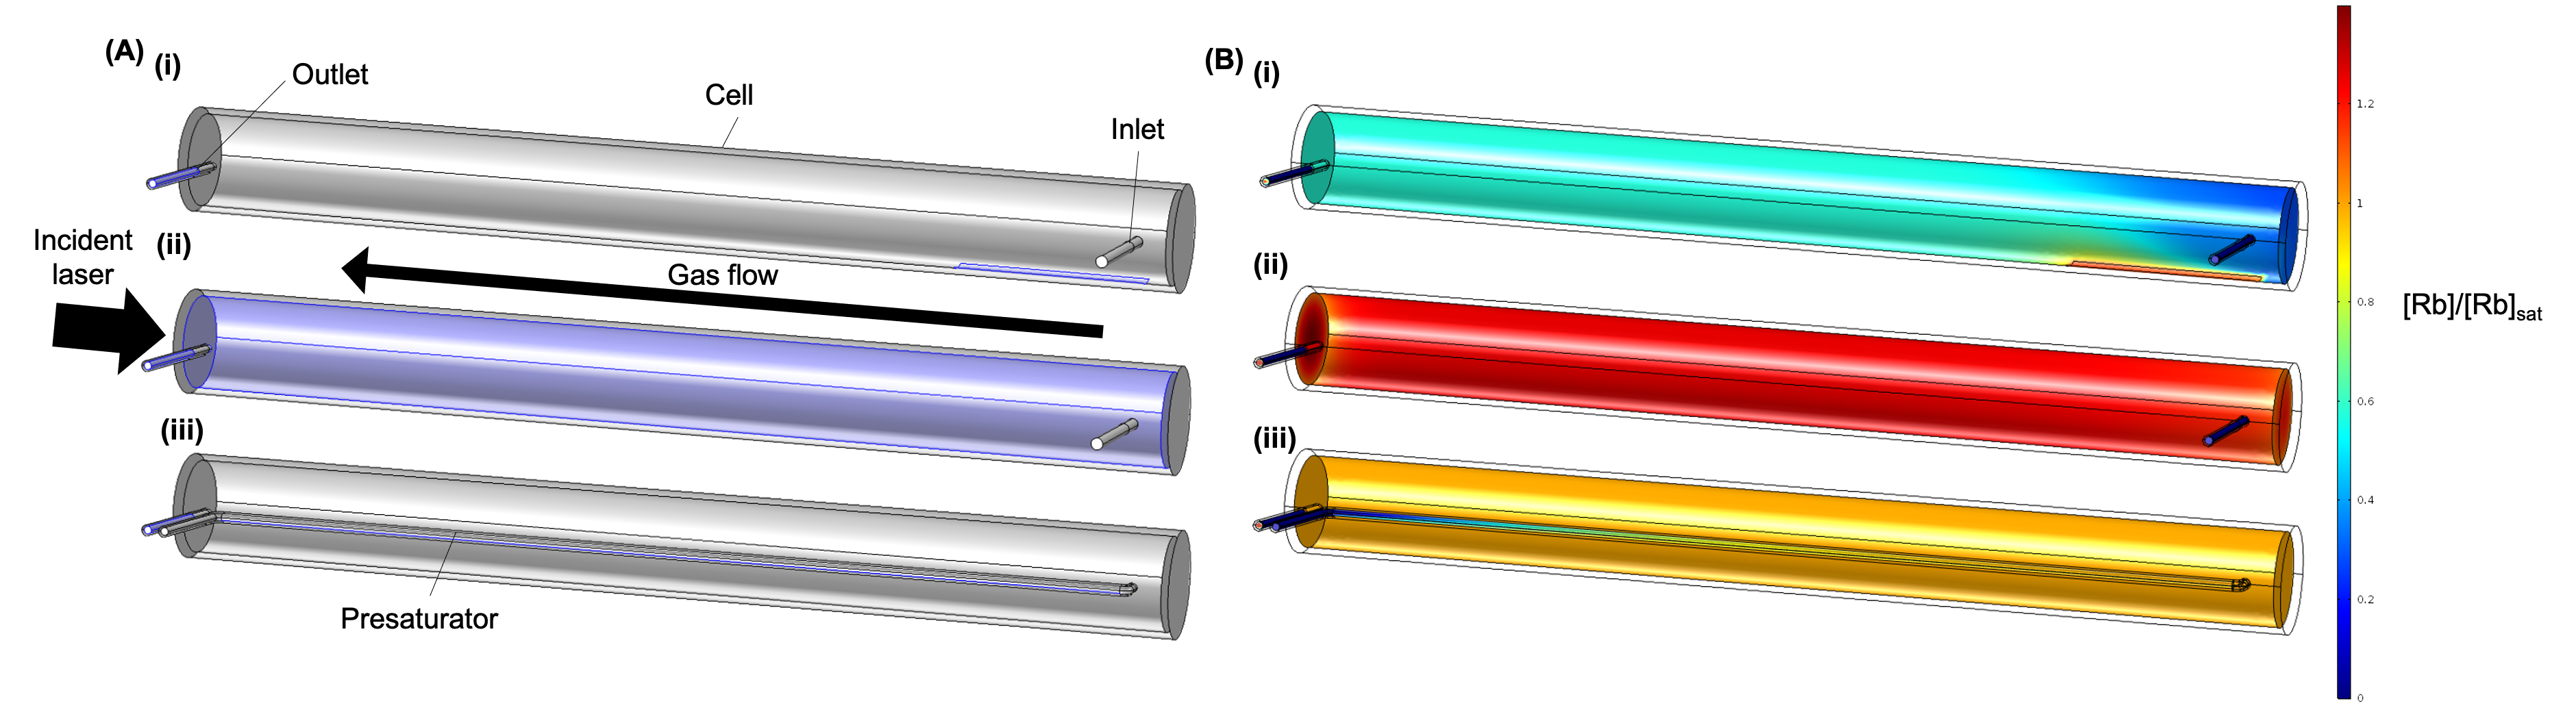
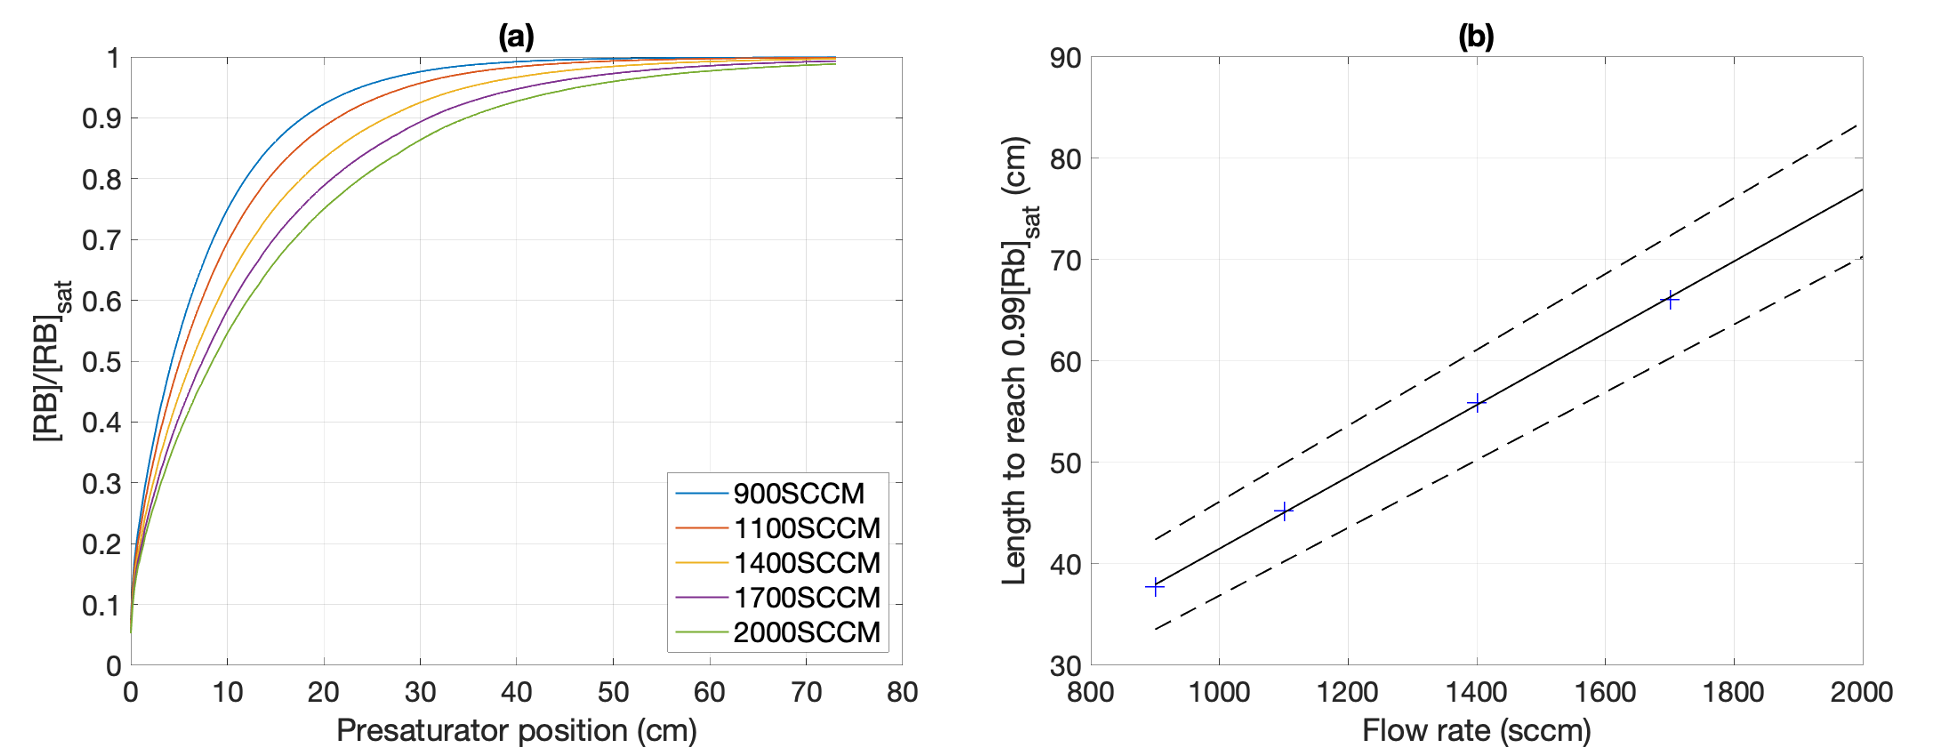
Within COMSOL Multiphysics, numerical models of gas-flow dynamics, thermal transfer and Rb vapour transport were used to model Rb density and temperature distributions within a cylindrical SEOP cell (80cm length and 7.5cm diameter) held at 125°C. Three different Rb source-sink distributions were investigated: (i) a Rb pool in the cell (Fig. 1Ai), typical of a newly-prepared cell; (ii) Rb distributed evenly on all internal surfaces of the cell (Fig. 1Aii), expected from observations of heavily-used cells, and (iii) Rb only within a presaturator upstream of the cell (Fig. 1Aiii). For all distributions, an additional Rb source-sink was placed in the outlet stem of the cell where Rb deposition is likely to occur. Rb density and temperature distributions were incorporated into an analytical model3 using MATLAB to calculate 129Xe polarisations. A range of laser diode powers (P=70W–190W, 794.77nm, Gaussian FWHM of 0.3nm) and 129Xe spin relaxation rates in the absence of Rb vapour (Γ′= (57.9 s)-1 and (44 min)-1) were computed. The Rb density distribution within the presaturator was determined for different gas flow rates. This was used to determine the minimum length of presaturator required for the flowing gas to reach 99% Rb saturation.Results and Discussion
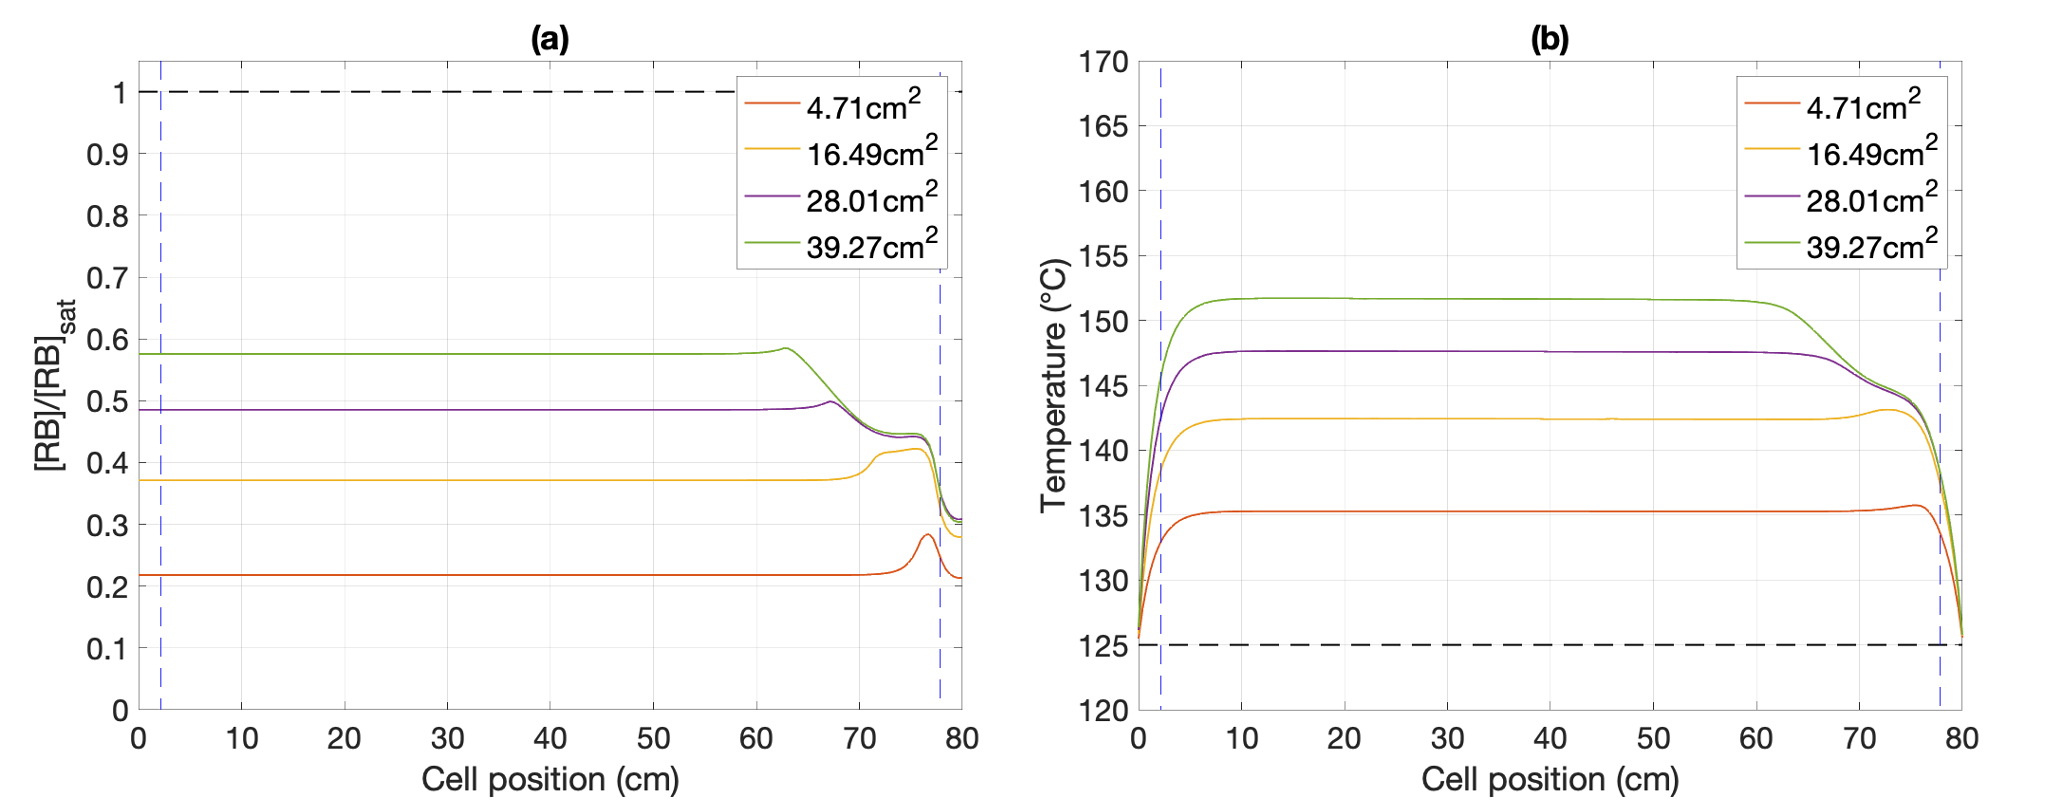
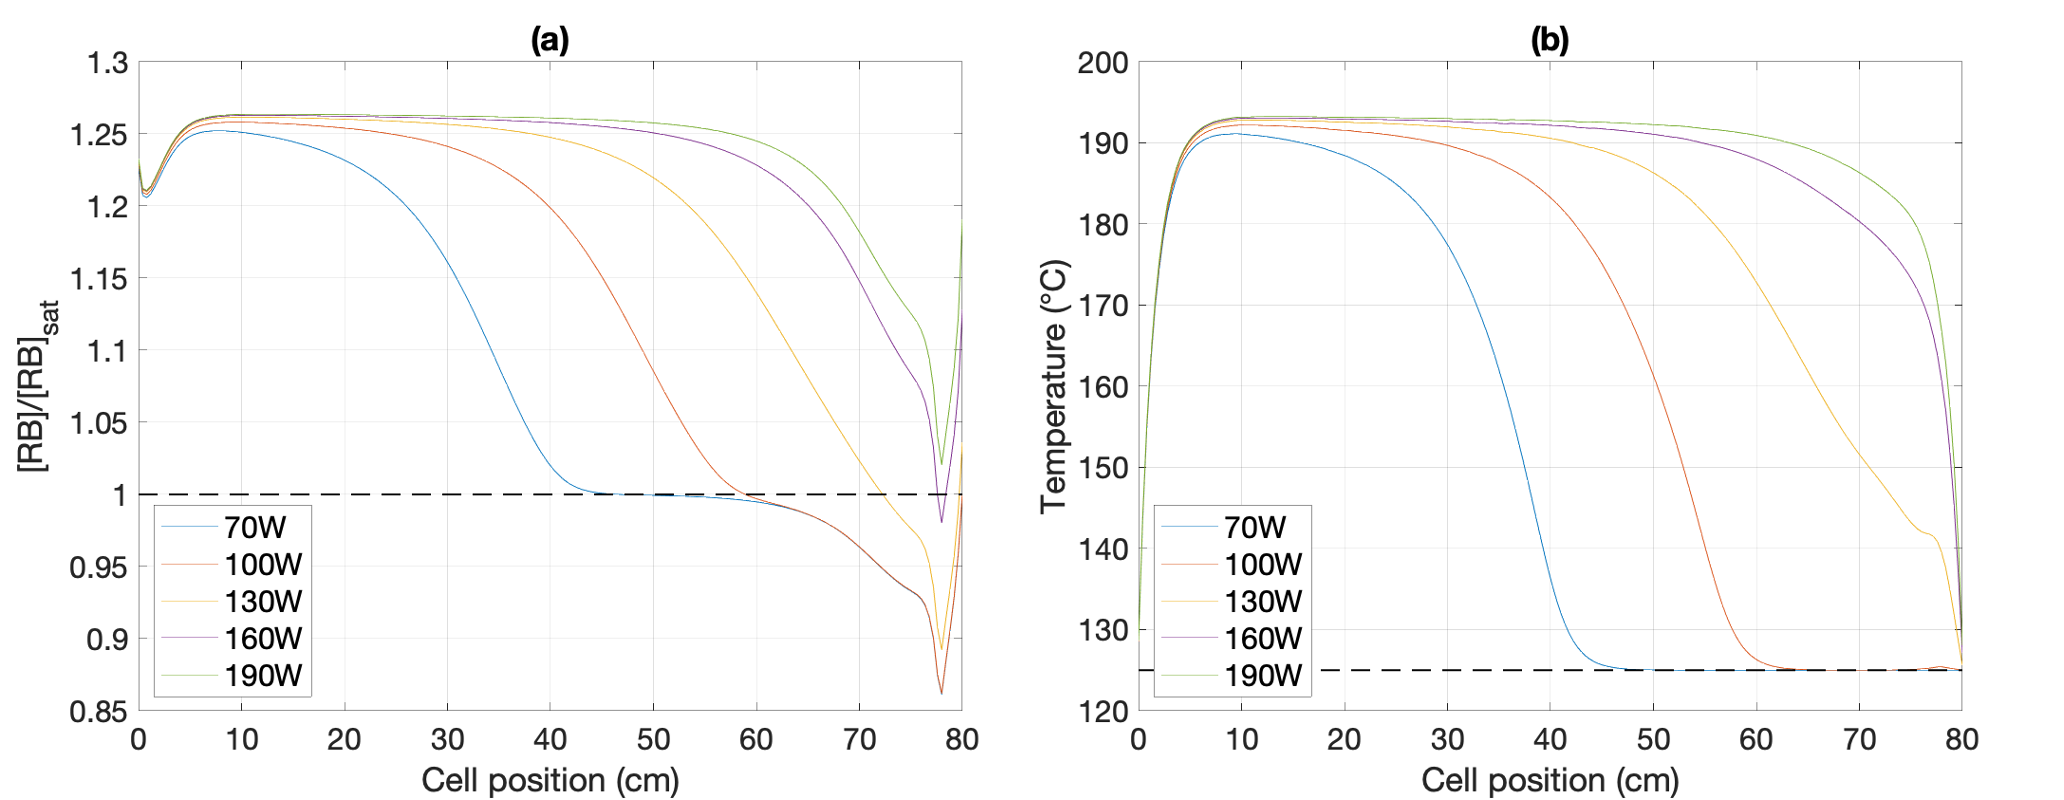
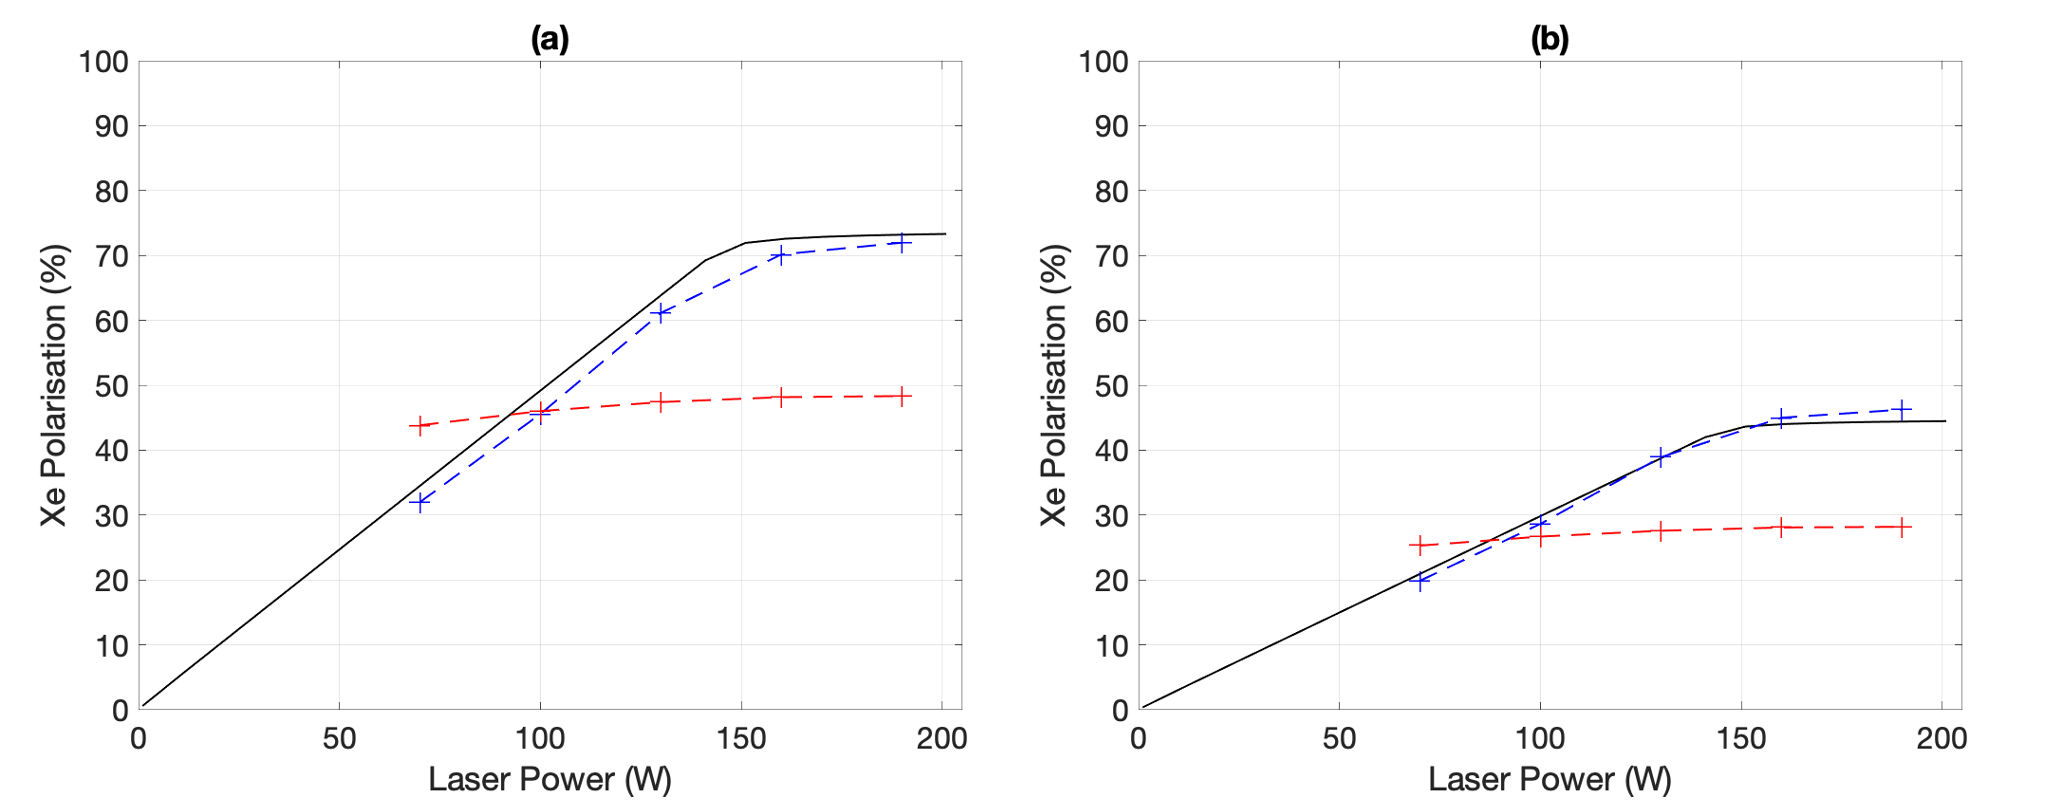
All Rb pool sizes used produce significantly lower Rb density than predicted by the Killian formula6 (Fig. 2), leading to lower 129Xe polarisation (Fig. 4). 129Xe polarisation is improved when Rb sources are spread across the cell walls (Fig. 4), however higher temperatures as a result of laser heating produces higher than desired Rb densities (Fig. 3). Rb density can be decoupled from the increased temperature in the cell by only placing Rb sources in the presaturator. The presaturator must be sufficiently long to allow the Rb vapour pressure to saturate before entering the cell, with shorter presaturator lengths likely resulting in lower than desired Rb density, particularly at high gas flow rates (Fig. 5a). Fig. 5b shows the relationship between required presaturator length and gas flow rate and can be used to determine the required presaturator length for setups that use different flow rates. The length of the presaturator required for the gas to reach 99% Rb saturation before entering the SEOP cell for a gas flow rate of 2000sccm (standard cubic cm per minute) was calculated to be 77±3cm. This is significantly longer than previously predicted (20-30cm) for low gas flow rates9.Fig. 4 shows elevated 129Xe polarisation for high 129Xe spin relaxation rates, Γ′, and laser powers ≥160W where the Rb density is highest (Rb on all cell walls, Fig. 3a) and laser powers ≤70W where the Rb density is low (Rb pool in the SEOP cell, Fig. 2a). This is due to the oven temperature being optimised for a laser power of 150W. To achieve these higher 129Xe polarisations using a presaturator, the oven temperature would need to be altered to adjust the Rb density accordingly. Future efforts will be directed towards controlling the Rb source distribution over time in order to achieve more stable 129Xe polarisation levels.
Conclusion
Rb density, and consequently 129Xe polarisation, can be improved with a sufficiently long presaturator. The required presaturator length depends on the maximum flow rate a system will use. For our gas flow rate of 2000sccm, the minimum presaturator length is 77±3cm, significantly longer than predicted for lower flow rates. Work validating these simulations experimentally, as well as further investigation into Γ′ increases over time, is underway.Acknowledgements
This work was supported by Linde gas recycling grant R/158129, NIHR Grant No. NIHR-RP-R3-12-027, and MRC Grant No. MR/ M008894/1.References
1. Hersman FW, Ruset IC, Ketel S, et al. Large Production System for Hyperpolarized 129Xe for Human Lung Imaging Studies. Academic Radiology. 2008;15(6):683-692. doi:https://doi.org/10.1016/j.acra.2007.09.0202.
2. Birchall JR, Irwin RK, Nikolaou P, et al. XeUS: A second-generation automated open-source batch-mode clinical-scale hyperpolarizer. Journal of Magnetic Resonance. 2020;319:106813. doi:https://doi.org/10.1016/j.jmr.2020.1068133.
3. Norquay G, Collier GJ, Rao M, Stewart NJ, Wild JM. 129Xe-Rb Spin-Exchange Optical Pumping with High Photon Efficiency. Physical Review Letters. 2018;121(15):153201. doi:10.1103/PhysRevLett.121.1532014.
4. Plummer JW, Emami K, Dummer A, Woods JC, Walkup LL, Cleveland ZI. A semi-empirical model to optimize continuous-flow hyperpolarized 129Xe production under practical cryogenic-accumulation conditions. Journal of Magnetic Resonance. 2020;320:106845. doi:https://doi.org/10.1016/j.jmr.2020.1068455.
5. Stewart NJ, Norquay G, Griffiths PD, Wild JM. Feasibility of human lung ventilation imaging using highly polarized naturally abundant xenon and optimized three-dimensional steady-state free precession. Magnetic Resonance in Medicine. 2015;74(2):346-352. doi:10.1002/mrm.257326.
6. Killian TJ. Thermionic Phenomena Caused by Vapors of Rubidium and Potassium. Physical Review. 1926;27(5):578-587. doi:10.1103/PhysRev.27.5787.
7. Birchall JR, Irwin RK, Nikolaou P, et al. Pilot multi-site quality assurance study of batch-mode clinical-scale automated xenon-129 hyperpolarizers. Journal of Magnetic Resonance. 2020;316:106755. doi:https://doi.org/10.1016/j.jmr.2020.1067558.
8. Repetto M, Babcock E, Blümler P, Heil W, Karpuk S, Tullney K. Systematic T1 improvement for hyperpolarized 129xenon. Journal of Magnetic Resonance. 2015;252:163-169. doi:https://doi.org/10.1016/j.jmr.2015.01.0159.
9. Fink A, Brunner E. Optimization of continuous flow pump cells used for the production of hyperpolarized 129Xe: A theoretical study. Applied Physics B. 2007;89(1):65-71. doi:10.1007/s00340-007-2754-z10.
10. Kelley M, Burant A, Branca RT. Resolving the discrepancy between theoretical and experimental polarization of hyperpolarized 129Xe using numerical simulations and in situ optical spectroscopy. Journal of Applied Physics. 2020;128(14):144901. doi:10.1063/5.0019074
Figures