3568
Background field inhomogeneity effects on hyperpolarized 129Xe diffusion-weighted MRI at 1.5T and 3T1Infection, Immunity and Cardiovascular Disease, University of Sheffield, Sheffield, United Kingdom
Synopsis
Background field inhomogeneities due to air-tissue interface magnetic susceptibility differences in the lungs increases derived ADC measurements from 3He PGSE diffusion-weighted (DW) lung MRI at higher field strengths. To determine if the same effects are observed with 129Xe DW-MRI, 129Xe ADC and mean diffusive length scale (LmD) from healthy volunteers imaged at 1.5T and 3T were compared. A small bias towards increased 129Xe ADC (6.3%) and LmD (2.2%) values at 3T was obtained, which is smaller than the reported bias of 3He ADC (15.5%) and 3He mean chord length (10.5%), and similar to the reported 129Xe DW-MRI inter-scan repeatability differences.
Introduction
Diffusion-weighted (DW) MRI with inhaled hyperpolarized gases (3He and 129Xe) is sensitive to changes in lung microstructure through the ADC and mean diffusive length scale (LmD) derived from the stretched exponential model (SEM) of gas diffusion in the lungs.1,2 These parameters have also been shown to be affected by background field inhomogeneities due to the magnetic susceptibility difference at the air-tissue interface. Experiments with 3He DW-MRI demonstrated that background field inhomogeneities will increase derived 3He ADC values3 and are also field strength dependent.4 However, to date there have been no experiments exploring the background field inhomogeneity effects on 129Xe DW-MRI. This work compares 129Xe ADC and SEM diffusion model metrics in healthy volunteers at 1.5T and 3T. We hypothesis that the background field inhomogeneity effects on 129Xe will be smaller than those observed with 3He due to the smaller gyromagnetic ratio.Methods
Five healthy volunteers were imaged on 1.5T (GE HDx) and 3T (GE PET/MR 750W) scanners using quadrature vest coils (Clinical MR Solutions, Brookfield, Wisconsin, USA), tuned to respective Larmor frequencies of 129Xe at 1.5T and 3T, with approval of the UK National Research Ethics Committee. For each scan, the same 3D multiple b-value 129Xe DW-MRI sequence with compressed sensing5 and inhalation of a 1L bag (550mL 129Xe, 450mL N2) from function residual capacity was used. 129Xe was polarized to >30% using a regulatory approved SEOP polariser (POLARIS, Sheffield, UK).6 Specific 129Xe DW-MRI sequence parameters were: voxel size=6.25x6.25x15 mm3; TE/TR=14.0/17.4 ms; diffusion time=8.5 ms; b=[0,12,20,30] s/cm2.ADC and SEM metrics (LmD and alpha heterogeneity index) were calculated from reconstructed undersampled images as previously described in MATLAB.5 Bland-Altman comparison was used to assess differences between all mean global 129Xe ADC (b=12, b=20 and b=30 s/cm2), LmD and alpha values at 1.5T and 3T.
Results and Discussion
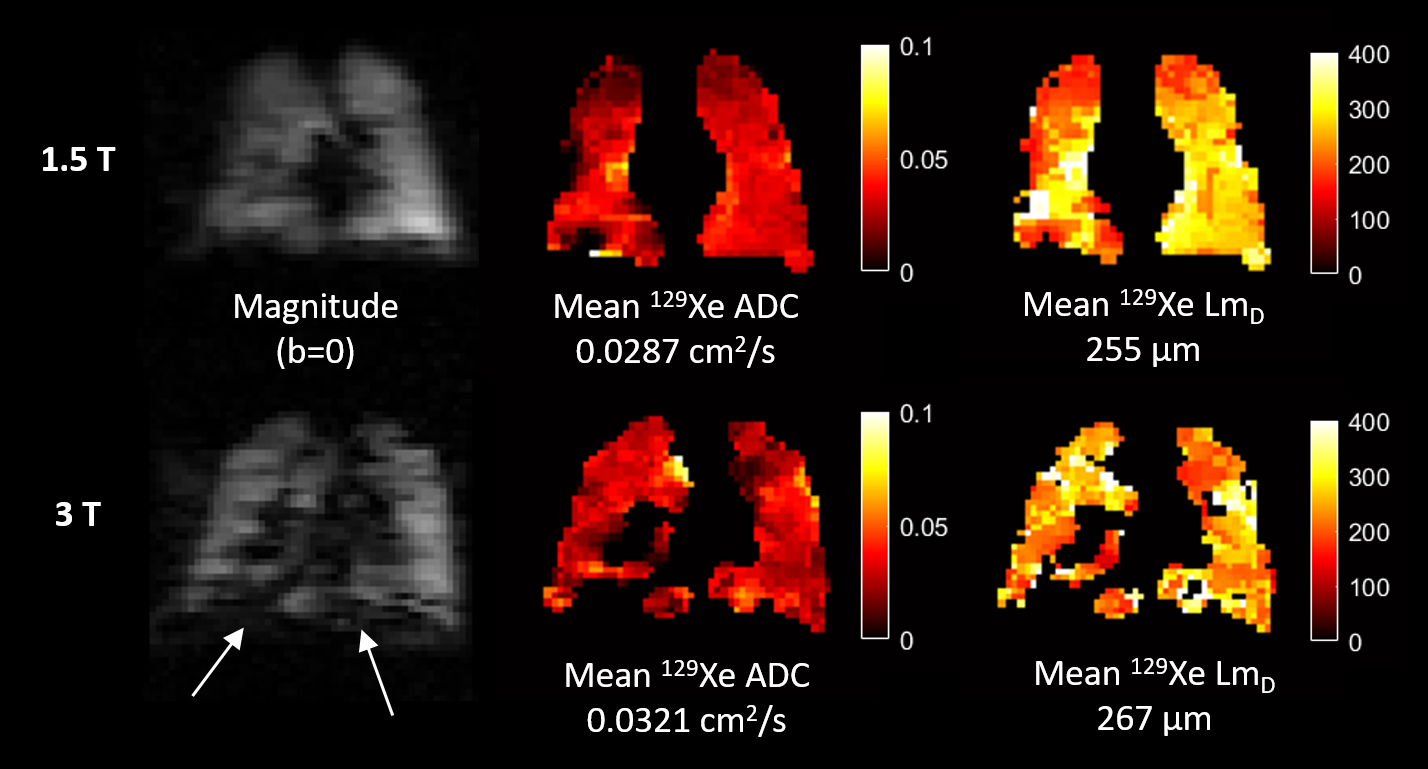
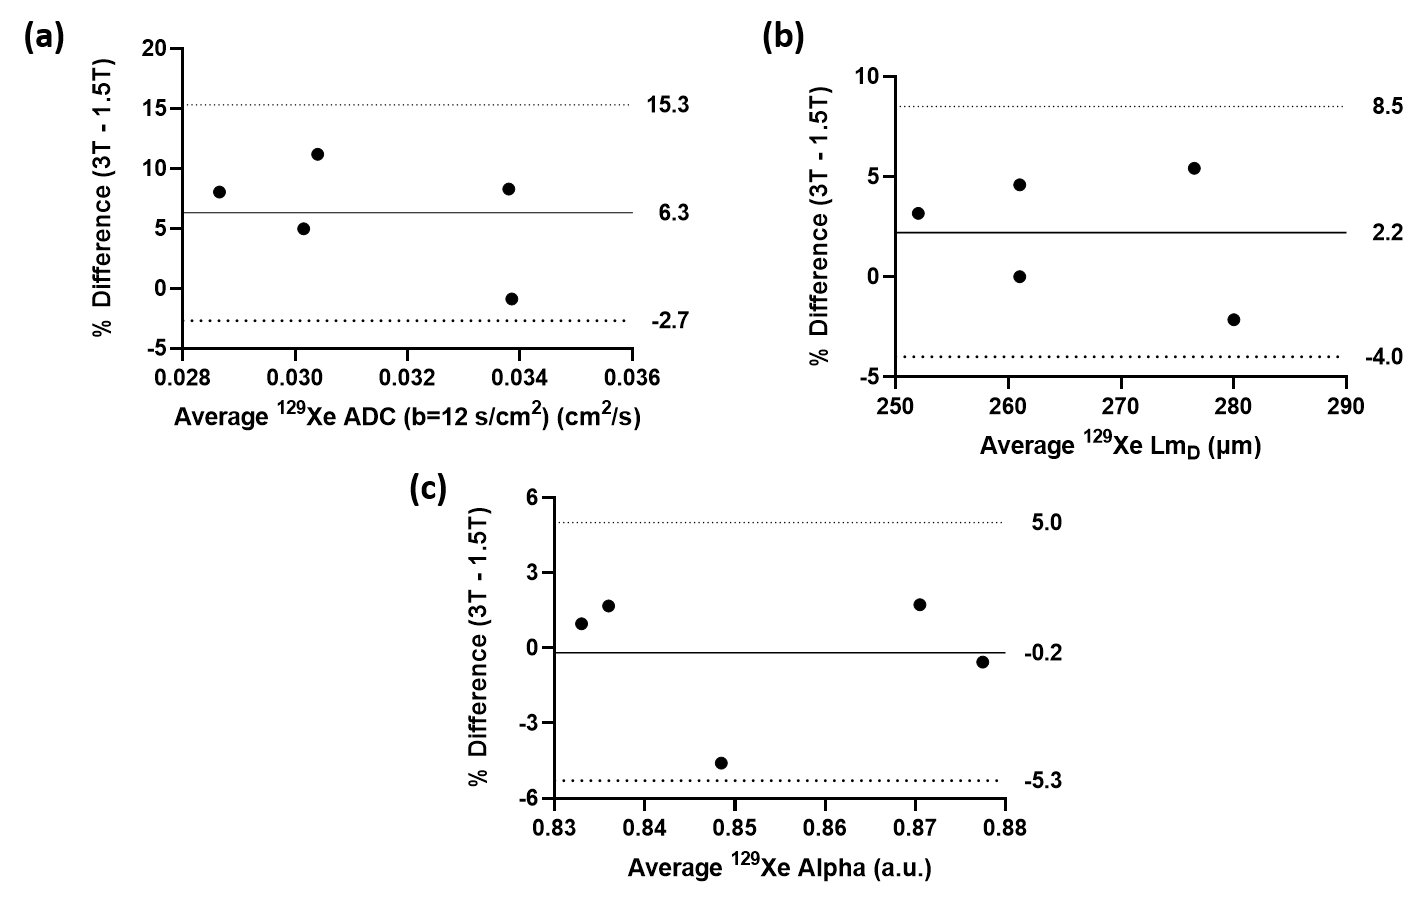
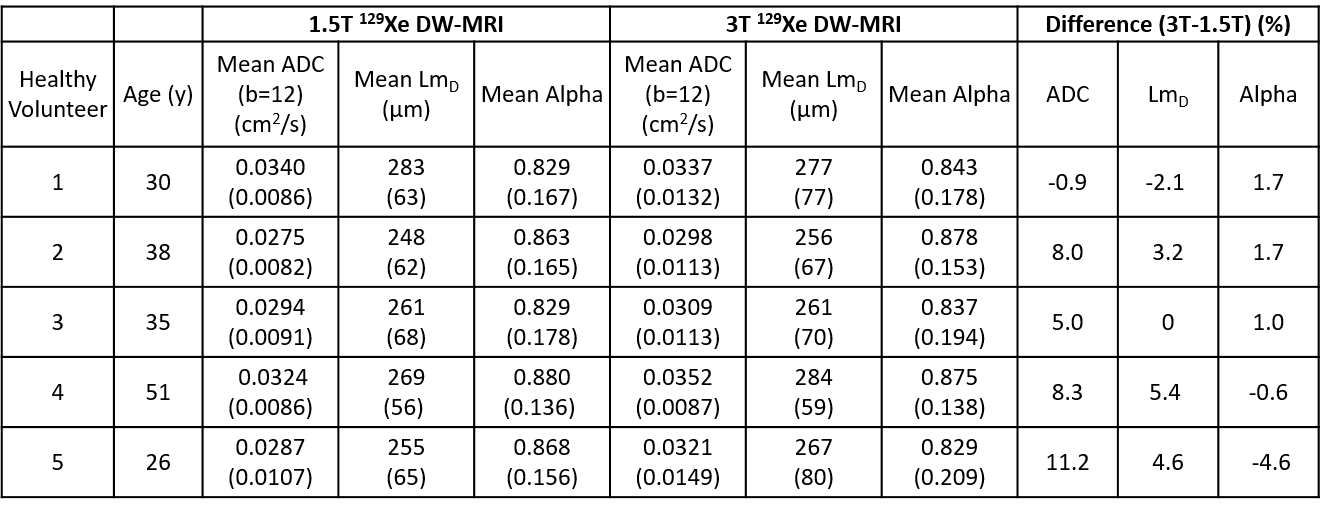
Table 1 summarizes the mean global 129Xe ADC, LmD and alpha values for all healthy volunteers at the two field strengths. 129Xe ADC (b=12) was larger at 3T, when compared to 1.5T, in four of the five healthy volunteers; while 129Xe LmD was larger at 3T for three volunteers. The same trend of larger values at 3T were observed for 129Xe ADC (b=20) and ADC (b=30). Example 129Xe magnitude (b=0), ADC and LmD images for one healthy volunteer at 1.5T and 3T are shown in Figure 1. The white arrows in the 3T magnitude image demonstrate more prevalent macroscopic susceptibility artifacts at the diaphragm region related to the air-tissue magnetic susceptibility differences.Bland-Altman analysis of 129Xe ADC and LmD found a mean bias of 6.3% towards 3T (95% confidence interval -2.7% to 15.3%) (Figure 2a), and a mean bias of 2.2% towards 3T (95% confidence interval -4.0% to 8.5%) (Figure 2b), respectively. These trends of increased 129Xe DW-MRI metrics at 3T corroborate the trends observed previously with 3He ADC and mean chord length (Lm) from the cylinder model.4 However, the mean biases obtained for 129Xe ADC and LmD are much smaller than those observed for 3He ADC (15.5%) and Lm (10.5%). This difference is most likely due to the ~2.7 times smaller gyromagnetic ratio of 129Xe to that of 3He, resulting in less microscopic dephasing in the presence of the same background magnetic field inhomogeneity gradients.
While there is a small observed bias for 129Xe ADC and LmD values at 3T, it is worth noting that these biases are within the same-week inter-scan repeatability 95% confidence interval of 129Xe ADC (-6.3% to 7.4%) and LmD (-3.8% to 4.8%) reported for healthy volunteers.7 Therefore, the background field inhomogeneity effects for 129Xe DW-MRI could be considered negligible when comparing DW-MRI results across scanners of different field strengths, and could support direct multi-site quantitative comparative studies across different platforms.
In contrast to ADC and LmD, the 129Xe alpha value, a biomarker for the underlying acinar airway heterogeneity, had a mean bias of -0.5% towards 3T (95% confidence interval -5.3% to 5.0%) (Figure 2c), and therefore appears not at all field strength dependent. This further supports the previous experimental results that demonstrated 3He alpha value was insensitive to diffusion experiment conditions such as lung inflation level.8
This work has utilized a 129Xe DW-MRI sequence with a TE of 14 ms that was previously optimized for 1.5T imaging. With a reported 129Xe T2* of 18 ms in partially-inflated lungs9, future work will involve optimization of the sequence for 3T to improve image SNR by reducing the TE whilst maintaining the same 8.5 ms 129Xe diffusion time.
Conclusion
This work has compared 129Xe ADC and LmD values at 1.5T and 3T in five healthy volunteers. A small bias towards increased 129Xe ADC and LmD values at 3T was observed that is similar to 129Xe DW-MRI inter-scan repeatability differences. While background field inhomogeneity effects exist for 129Xe DW-MRI, they could be considered negligible thus supporting direct multi-site quantitative comparative studies across different scanners.Acknowledgements
This work was supported by NIHR grant NIHR-RP-R3-12-027 and MRC grant MR/M008894/1. The views expressed in this work are those of the author(s) and not necessarily those of the NHS, the National Institute for Health Research or the Department of HealthReferences
1. Chan, H.F., et al., Comparison of in vivo lung morphometry models from 3D multiple b-value (3) He and (129) Xe diffusion-weighted MRI. Magn Reson Med, 2019. 81(5):2959-2971.
2. Stewart, N.J., et al., Comparison of (3) He and (129) Xe MRI for evaluation of lung microstructure and ventilation at 1.5T. J Magn Reson Imaging, 2018.
3. Mugler III, J., et al. Evidence of background-gradient effects in GRE-based 3He diffusion MRI. in Proc. Intl. Soc. Mag. Reson. Med. 2006. 1313.
4. Parra-Robles, J., et al., The influence of field strength on the apparent diffusion coefficient of 3He gas in human lungs. Magn Reson Med, 2012. 67(2):322-5.
5. Chan, H.F., et al., 3D diffusion-weighted (129) Xe MRI for whole lung morphometry. Magn Reson Med, 2018. 79(6):2986-2995.
6. Norquay, G., et al., ^{129}Xe-Rb Spin-Exchange Optical Pumping with High Photon Efficiency. Phys Rev Lett, 2018. 121(15):153201.
7. Hughes, P.J.C., et al. Repeatability and correlation of hyperpolarized xenon-129 and oxygen enhanced MRI parameters in healthy volunteers. in Proc. Intl. Soc. Mag. Reson. Med. 2020. 2305.
8. Parra-Robles, J., H. Marshall, and J.M. Wild. Characterization of 3He Diffusion in Lungs Using a Stretched Exponential Model. in Proc. Intl. Soc. Mag. Reson. Med. 2013.820.
9. Xu, X., et al., Hyperpolarized 129Xe gas lung MRI-SNR and T2* comparisons at 1.5 T and 3 T. Magn Reson Med, 2012. 68(6):1900-4.
Figures