3562
Imaging Gas-Exchange Lung Function using Density-Weighted MRSI and Hyperpolarised 129Xe Gas1GE Healthcare, Munich, Germany, 2POLARIS, Department of Infection Immunity & Cardiovascular Disease, University of Sheffield, Sheffield, United Kingdom
Synopsis
3D density-weighted MRSI in combination with a frequency-tailored RF excitation pulse was designed, implemented and used to detect xenon gas in the lungs and xenon dissolved in lung tissue and blood. These images were used to calculate quantitative ratio maps of tissue-to-gas, blood-to-gas, and blood-to-tissue with good SNR.
Introduction
Hyperpolarised 129Xe lung imaging can provide a direct, quantitative and spatially-resolved measurement of gas uptake in the lungs, enabling the most direct assessment of lung function. Besides chronic obstructive pulmonary disease (COPD), asthma and idiopathic pulmonary fibrosis [1,2], there is currently much interest in this method for assessing lung damages induced by COVID-19 [3].129Xe gas is absorbed (similar to oxygen) in the alveoli into tissue (i.e. lung parenchyma and blood plasma) and blood (i.e. red blood cells), giving rise to three distinct spectral resonance lines. Imaging the dissolved-phase is enabled by rapid uptake and long gas T1, but challenging due to short T2*≈2ms (1.5T) or 1ms (3T) and low signal intensity (1-2% of gas phase) [7]. Methods to detect these lines spatially-resolved in humans include 3D radial 1-point Dixon [4], 2D spiral CSI [5,6] and 3D radial spectroscopic imaging [7]. Goal of this work was to implement and validate 3D density-weighted MRSI [8] combined with a spectrally-tailored RF pulse for dissolved-phase lung imaging.
Methods
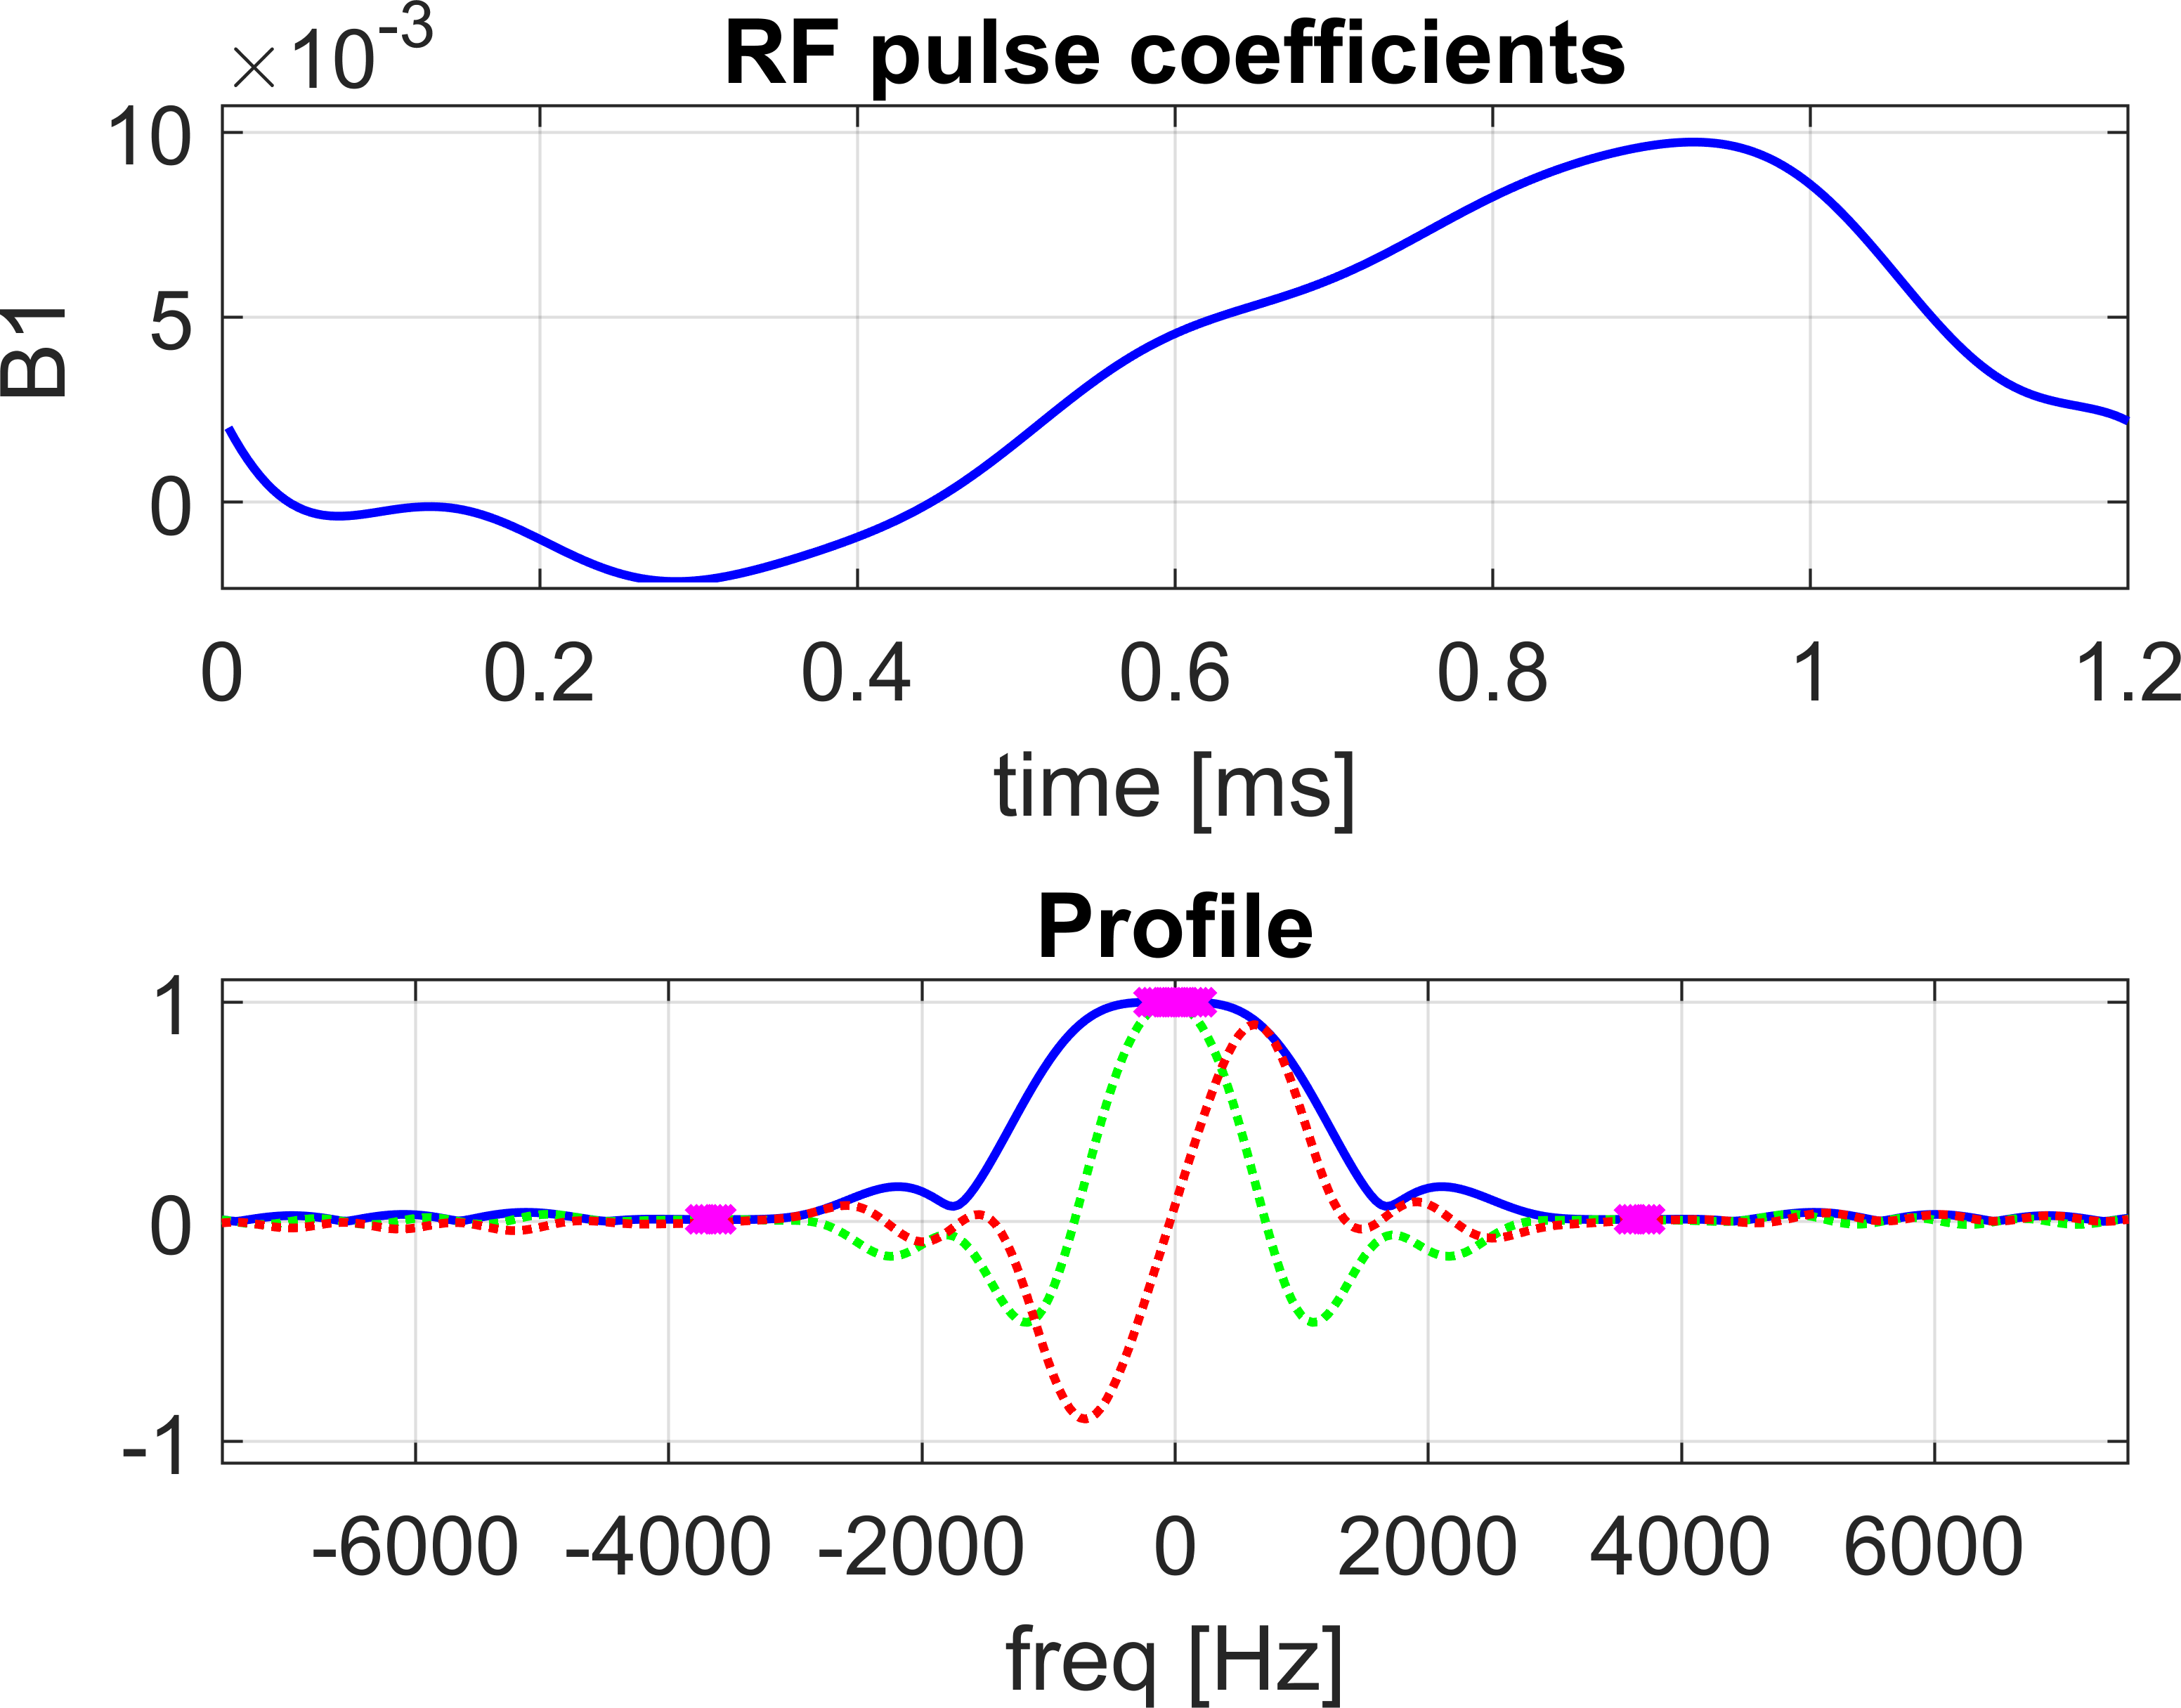
A spectrally-tailored RF pulse with a duration of 1.2ms and partial self-refocusing was designed for scanning at 1.5T to excite the dissolved and gas phase with flip angles of 10° and 0.1°, and passbands of 500Hz and 200Hz, respectively (Fig. 2).A 3D density-weighted MRSI trajectory was designed with an isotropic voxel size of (2.1cm)3, matrix size of 14×14×7 and a FOV=30×30×15cm3, requiring a total of 1799 excitations (Fig. 1). In spectral dimension, 88 sampling points were acquired with BW=20kHz. An optimised crusher gradient and RF spoiling scheme with TR=8ms resulted in a total acquisition time of 14.4s, thus fitting within a single breath-hold.
Data were reconstructed via slow spatial Fourier transformation (i.e. matrix multiplications) directly to a Cartesian grid of 28×28×14 obviating the need for gridding the non-Cartesian k-space locations. The spectral dimension was zero-filled to 256 samples and reconstructed via fast Fourier transformation. Peak areas were integrated to yield gas, tissue and blood maps, and corrected for T2* decay and the lower excitation flip angle of gas.
For comparison, data were acquired in the same volunteers and during the same MRI sessions using a 4-echo 3D radial spectroscopic imaging sequence described previously in [7], whose parameters were adjusted to match the 3D MRSI sequence (same RF excitation pulse, TR and flip angle, dissolved interleave only (voxel size=(2cm)3, FOV=(40cm)3, BW=31.25kHz, 1728 radial projections, 4TEs per projection with ΔTE=0.704ms, resampled to the same matrix size as for MRSI).
Pulse sequence waveforms were generated in Matlab, stored as files and read into a dedicated, flexible pulse sequence. Both methods were validated and compared in two healthy volunteers inhaling 1L of enriched 129Xe gas polarised to ~30% [9] on a 1.5T HDx scanner (GE Healthcare) equipped with a 129Xe transmit-receive vest coil (CMRS).
Results and Discussion
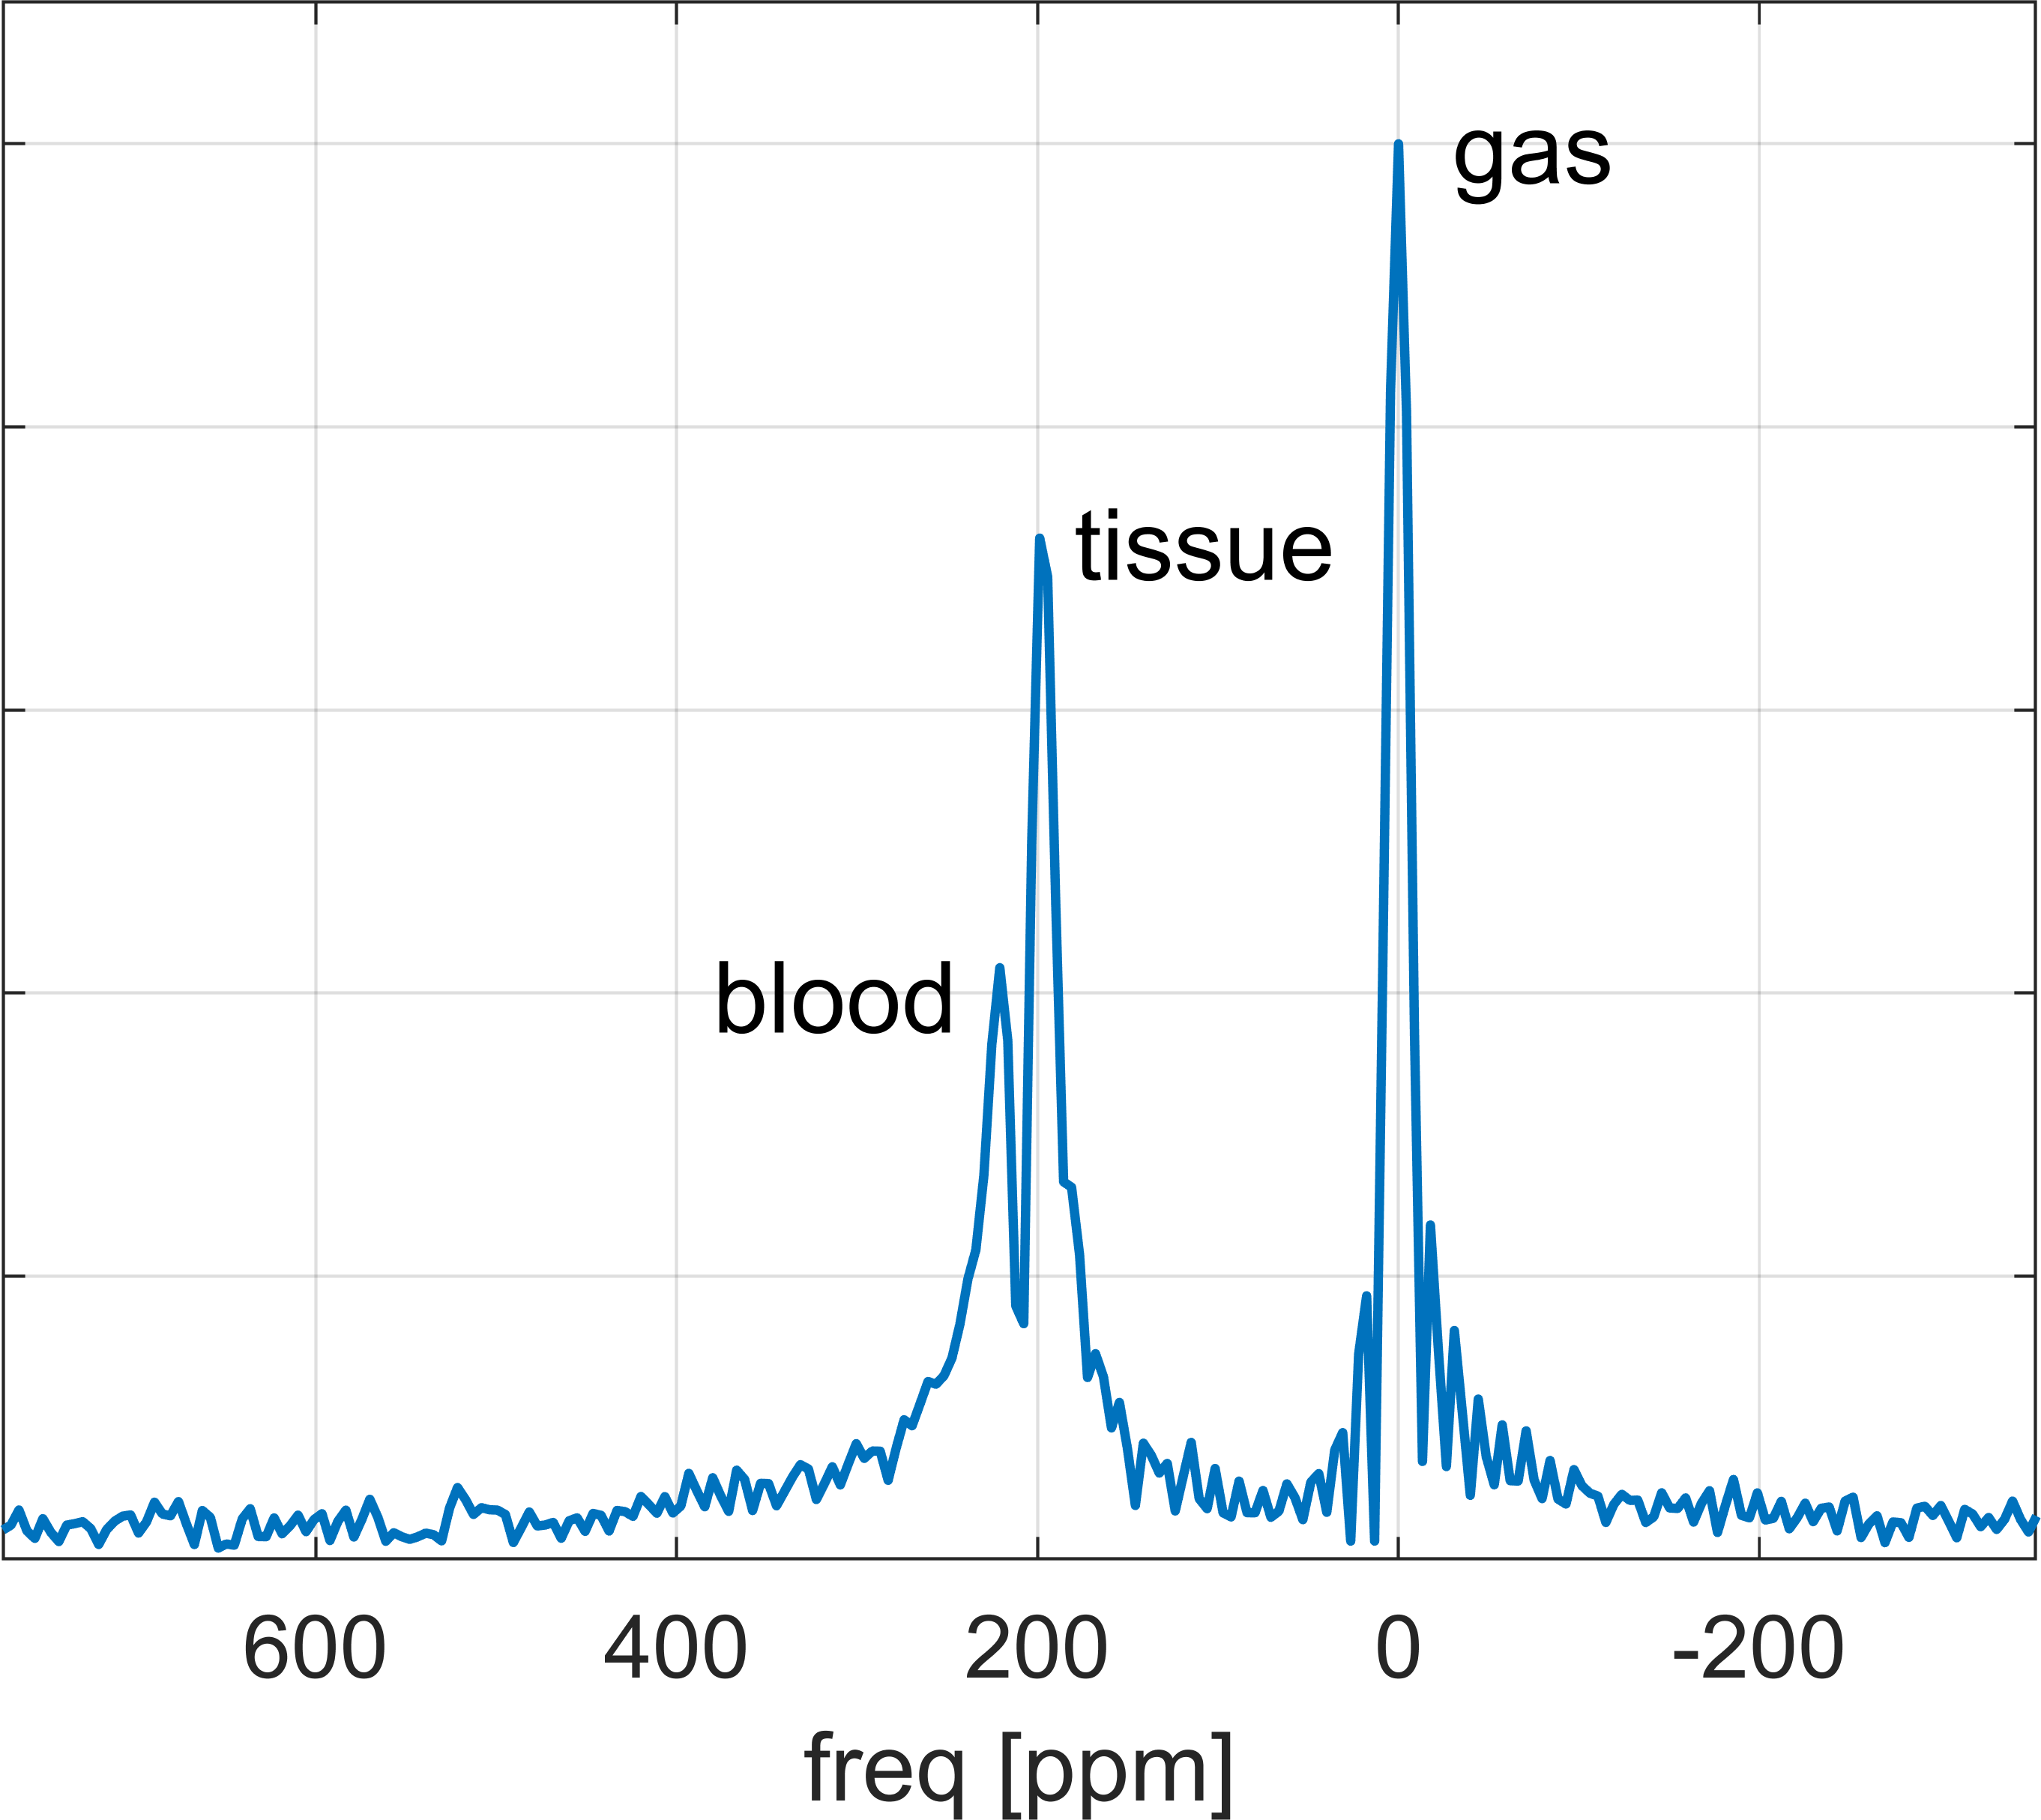
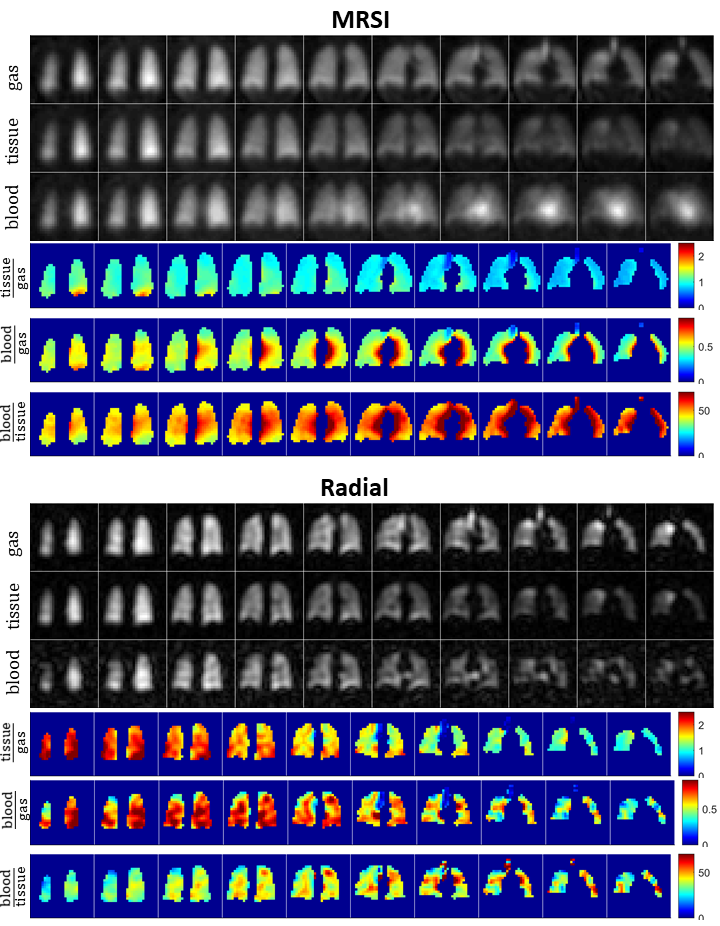
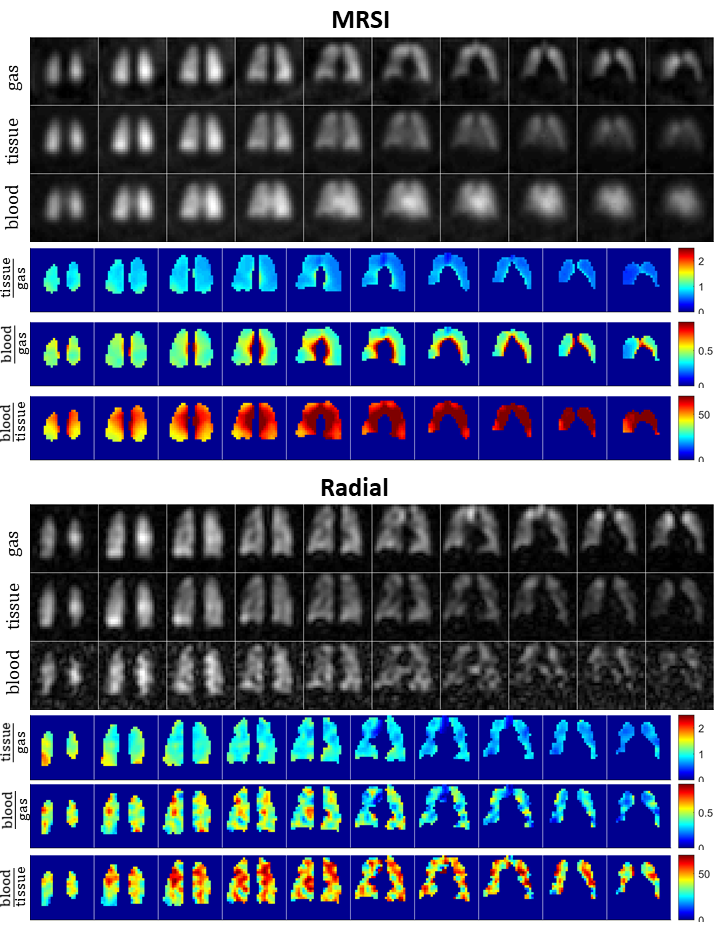
3D density-weighted MRSI in combination with a frequency-tailored RF pulse yields spectra with high quality and SNR (Fig. 3), thus facilitating extraction of gas, tissue and blood images with high fidelity (Figs. 4+5). The obtained quantitative ratio maps (Figs. 4+5) exhibit similar values as in literature [1,7,10-12] and as the maps acquired with the 3D radial echo-planar-spectroscopic imaging approach. The MRSI data exhibits higher SNR despite similar voxel sizes and the heart is visible in the blood maps, possibly because MRSI did not use dummy scans and a cntre-out phase encoding scheme. Furthermore, radial echo-planar zig-zag trajectories might be crushing flowing spins.The RF pulse works robustly and yielded good and comparable results even when accidentally mis-setting the centre frequency by 180Hz. It is much easier to excite gas phase with a small but defined flip angle than to try to completely suppress it. Exciting gas with 0.1° has the additional advantage of having a reliable gas signal from the same breath-hold available for the quantitative ratio maps.
The short T2* of dissolved-phase xenon of ~2ms (at 1.5T) limits the benefits of applying readout gradients, making a full MRSI encoding similarly encoding efficient as other techniques. Acquiring the full spectrum improves separation of signals, robustness and also confidence in the results. Especially when moving to 3T, MRSI is expected to be even more beneficial. Furthermore, T2* can be extracted from the data, hence potentially providing additional diagnostic information.
Conclusion
Density-weighted MRSI in combination with frequency-tailored RF excitation is a robust and SNR efficient approach for detecting xenon gas dissolved in lung tissue and blood with higher spectral resolution than achieved with echo-planar (Dixon/IDEAL) type of methods.Acknowledgements
MRC grant - MR/M008894/1References
- Using hyperpolarized 129Xe MRI to quantify regional gas transfer in idiopathic pulmonary fibrosis. Wang JM, Robertson SH, Wang Z, He M, Virgincar RS, Schrank GM, Smigla RM, O'Riordan TG, Sundy J, Ebner L, Rackley CR, McAdams P, Driehuys B. Thorax. 2018 Jan;73(1):21-28. doi: 10.1136/thoraxjnl-2017-210070.
- Diverse cardiopulmonary diseases are associated with distinct xenon magnetic resonance imaging signatures. Wang Z, Bier EA, Swaminathan A, Parikh K, Nouls J, He M, Mammarappallil JG, Luo S, Driehuys B, Rajagopal S. Eur Respir J. 2019 Dec 12;54(6):1900831. doi: 10.1183/13993003.00831-2019.
- Damaged lung gas-exchange function of discharged COVID-19 patients detected by hyperpolarized (129)Xe MRI. Li H, Zhao X, Wang Y, Lou X, Chen S, Deng H, Shi L, Xie J, Tang D, Zhao J, Bouchard LS, Xia L, Zhou X. Sci Adv. 2020 Nov 20:eabc8180. doi: 10.1126/sciadv.abc8180.
- Single-breath clinical imaging of hyperpolarized (129)Xe in the airspaces, barrier, and red blood cells using an interleaved 3D radial 1-point Dixon acquisition. Kaushik SS, Robertson SH, Freeman MS, He M, Kelly KT, Roos JE, Rackley CR, Foster WM, McAdams HP, Driehuys B. Magn Reson Med. 2016 Apr;75(4):1434-43. doi: 10.1002/mrm.25675.
- Magnetic resonance imaging of the time course of hyperpolarized 129Xe gas exchange in the human lungs and heart. Doganay O, Chen M, Matin T, Rigolli M, Phillips JA, McIntyre A, Gleeson FV. Eur Radiol. 2019 May;29(5):2283-2292. doi: 10.1007/s00330-018-5853-9.
- Fast dynamic ventilation MRI of hyperpolarized 129 Xe using spiral imaging. Doganay O, Matin TN, Mcintyre A, Burns B, Schulte RF, Gleeson FV, Bulte D. Magn Reson Med. 2018 May;79(5):2597-2606. doi: 10.1002/mrm.26912.
- Dissolved 129Xe lung MRI with four-echo 3D radial spectroscopic imaging: Quantification of regional gas transfer in idiopathic pulmonary fibrosis. Collier GJ, Eaden JA, Hughes PJC, Bianchi SM, Stewart NJ, Weatherley ND, Norquay G, Schulte RF, Wild JM. Magn Reson Med. 2020 Nov 30. doi: 10.1002/mrm.28609. Online ahead of print.
- Efficient k-space sampling by density-weighted phase-encoding. Greiser A, von Kienlin M. Magn Reson Med. 2003 Dec;50(6):1266-75. doi: 10.1002/mrm.10647.
- 129Xe-Rb Spin-Exchange Optical Pumping with High Photon Efficiency. Norquay G, Collier GJ, Rao M, Stewart NJ, Wild JM. Phys Rev Lett. 2018 Oct 12;121(15):153201. doi: 10.1103/PhysRevLett.121.153201.
- Measuring diffusion limitation with a perfusion-limited gas--hyperpolarized 129Xe gas-transfer spectroscopy in patients with idiopathic pulmonary fibrosis. Kaushik SS, Freeman MS, Yoon SW, Liljeroth MG, Stiles JV, Roos JE, Foster W, Rackley CR, McAdams HP, Driehuys B. J Appl Physiol (1985). 2014 Sep 15;117(6):577-85. doi: 10.1152/japplphysiol.00326.2014.
- Quantitative analysis of hyperpolarized 129 Xe gas transfer MRI. Wang Z, Robertson SH, Wang J, He M, Virgincar RS, Schrank GM, Bier EA, Rajagopal S, Huang YC, O'Riordan TG, Rackley CR, McAdams HP, Driehuys B. Med Phys. 2017 Jun;44(6):2415-2428. doi: 10.1002/mp.12264.
- Assessment of lung function in asthma and COPD using hyperpolarized 129Xe chemical shift saturation recovery spectroscopy and dissolved-phase MRI. Qing K, Mugler JP 3rd, Altes TA, Jiang Y, Mata JF, Miller GW, Ruset IC, Hersman FW, Ruppert K. NMR Biomed. 2014 Dec;27(12):1490-501. doi: 10.1002/nbm.3179.
Figures
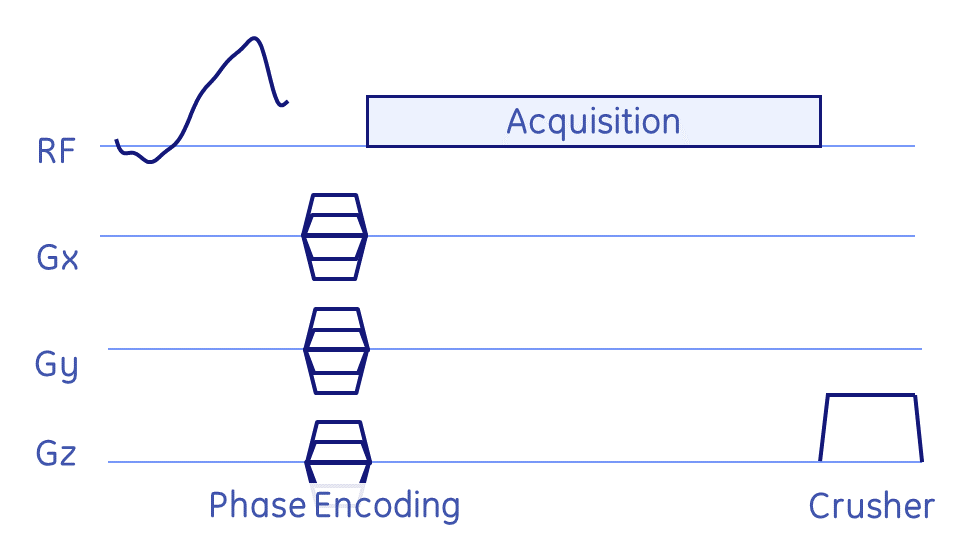
Fig. 1: Basic MRSI pulse-sequence: after the frequency-tailored RF excitation pulse the spatial dimension is encoded via phase-encoding gradients, followed by a pure spectral acquisition (i.e. no readout gradients). Remaining signal was crushed via a strong z-gradient and RF spoiling.
Parameters: TE=0.9ms (time from reference of RF pulse to start of acquisition), TR=8ms, flip=10°/0.1°, #exc=1799, mtx=14×14×7, scan duration=14.5s.