3561
Hyperpolarized 3He MRI ADC and Ventilation Features Predict Rapidly Worsening Emphysema Using Machine-learning1Medical Biophysics, Western University, London, ON, Canada, 2Division of Respirology, Department of Medicine, Western University, London, ON, Canada, 3Department of Oncology, Western University, London, ON, Canada
Synopsis
Pulmonary hyperpolarized 3He MRI provides a way to measure lung ventilation heterogeneity in patients with COPD, including terminal airspace enlargement or emphysema that is typically quantified using CT densitometry. Unfortunately, MRI-derived biomarkers of emphysema progression remain unconfirmed, and also likely because of radiation dose considerations, CT follow-up of emphysema is rarely performed, and hence its longitudinal progression is not well-understood. Here we developed a machine-learning pipeline that identified hyperpolarized 3He MRI texture features that independently and uniquely correlated and predicted rapidly-worsening emphysema nearly 3 years later, measured as CT RA950, using a Decision Tree algorithm that achieved 82% prediction accuracy.
Introduction:
Pulmonary hyperpolarized 3He and 129Xe MRI provide a way to measure lung ventilation and parenchyma microstructure in patients with chronic obstructive pulmonary disease (COPD), including ventilation defects and terminal airspace enlargement or emphysema.[1] X-ray computed tomography (CT) also provides a way to quantify extent of emphysema based on tissue density measurements that are susceptible to lung volume changes, with studies indicating that a change of 1.1% in extent of emphysema may be detected with 95% probability, measured as relative area of lung < -950 Hounsfield Units (RA950).[2] Unfortunately, and likely because of radiation dose considerations, CT follow-up of emphysema is rarely performed in patients, and hence its longitudinal progression is not well-understood.[3] Here we evaluated a large database of volume-matched hyperpolarized 3He MRI and CT in patients with COPD and hypothesized that 3He MRI ventilation features may be used to predict those patients who will experience rapidly worsening emphysema, after 3 years.Methods:
Participants and Data Acquisition:We retrospectively evaluated 47 ex-smokers (>10 pack years, 40-85 years of age) with and without a diagnosis of COPD, who provided an informed consent (NCT02279329) to the TINCan cohort study which included spirometry, 3He MRI and thoracic CT scans.[4] Long-term follow-up was prospectively planned for 24 ± 6 months after baseline visit.
Spirometry was acquired according to the American Thoracic Society/European Respiratory Society guidelines.[5] COPD severity was defined according to the Global Initiative for Chronic Obstructive Lung Disease (GOLD) grades.[6]
Thoracic CT scans were acquired while participants were in supine position using a 64-slice Lightspeed VCT scanner (General Electric Healthcare, Milwaukee, WI) during single breath hold of 1L bag of N2 gas, with parameters 64×0.625mm, 120kVp, 100 effective mA, tube rotation time= 500ms, pitch= 1.0, slice thickness= 1.25mm, slices= 200-250. The mean total effective dose was 1.8mSv.
MRI was acquired using a whole-body 3.0 T Discovery MR750 (General Electric Healthcare, Milwaukee, WI), a whole-body radiofrequency coil and a fast-gradient-recalled echo (FGRE) sequence with a partial echo implementation to acquire the conventional 1H images using the following parameters: total-acquisition time= 8s, repetition time[TR] / echo time[TE] / flip angle=4.7ms /1.2ms /30°, field of view[FOV]= 40×40cm2, bandwidth[BW]= 24.4kHz, matrix= 128×80 (zero-padded to 128×128), partial echo percent= 62.5%, number of slices= 15-17, slice thickness= 15mm, 0-gap. Hyperpolarized 3He ventilation images were acquired using an FGRE sequence with a partial echo and following parameters: Acquisition time= 10s, TR/TE/flip angle= 3.8ms/1.0ms/7°, FOV= 40×40cm2, matrix= 128×80 (zero-padded to 128×128), BW= 48.8kHz, partial echo percent= 62.5%, slices= 15-17, slice thickness= 15mm, 0-gap.
Image Processing and Statistics:
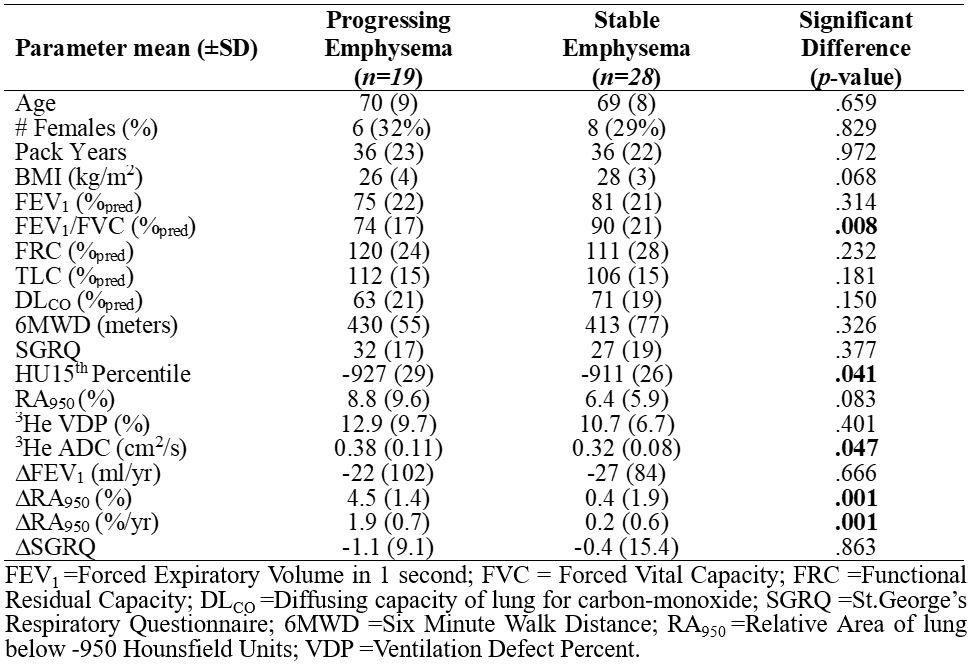
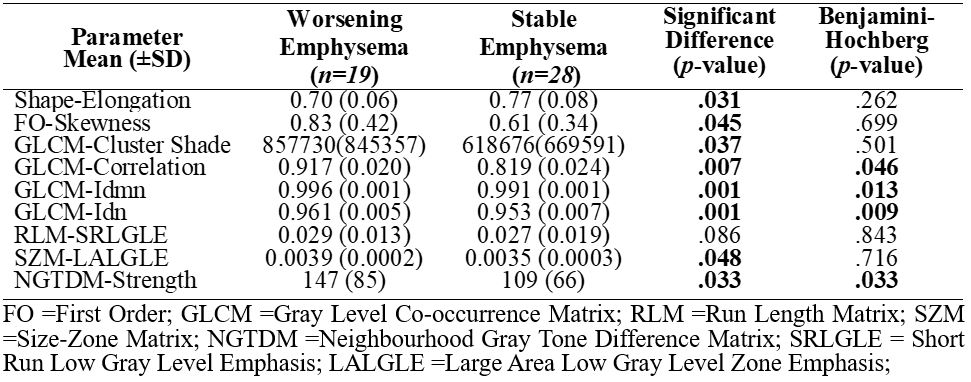
Participants were dichotomized based on a 1.1 %/year change in CT RA950 measurement between baseline and follow-up visits, as previously described.[7] Custom algorithm inputs were extracted from the 3-dimensional application of gray level run-length, gap-length, zone-size, dependence and co-occurrence matrices via PyRadiomics platform.[8] Additional parameters used for training were: 1) CT RA950 and 15th percentile (HU15), 2) MRI-ADC and ventilation defect percent (VDP).[9] Feature selection was performed using Boruta analysis and a random forest classifier to independently identify CT and MRI features that significantly contributed to machine-learning model’s accuracy. The Shapiro-Wilk test was used to determine the normality of the data distribution. Non-parametric tests were performed for non-normally distributed data. Model performance was evaluated using area under the receiver operator curve (AUC), as well as sensitivity and specificity metrics.
Results:
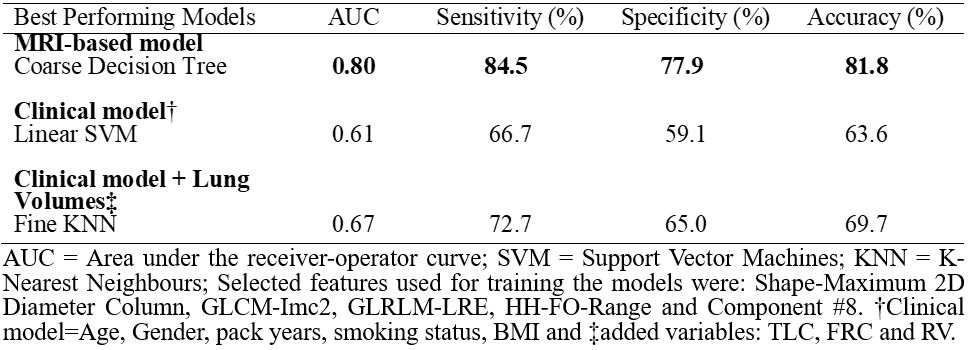
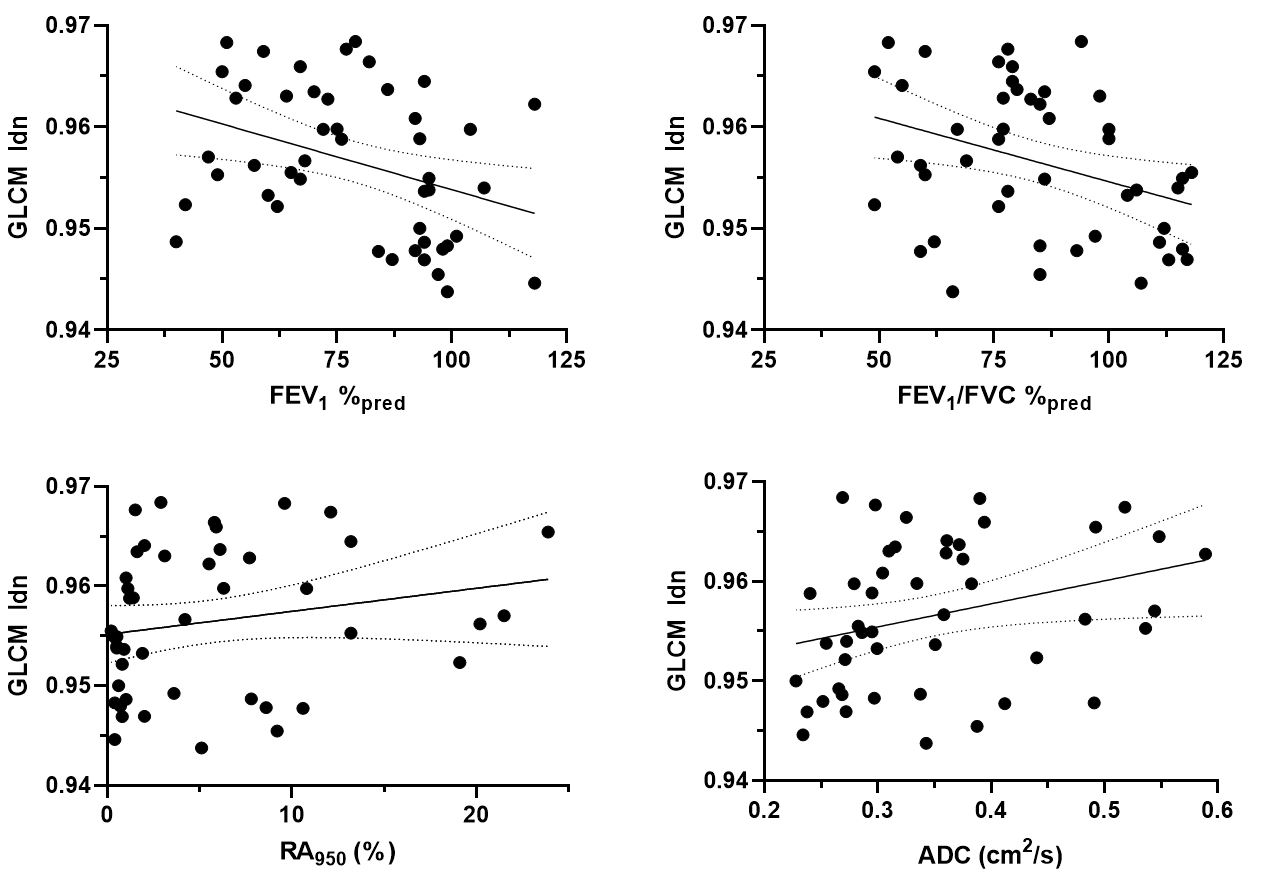
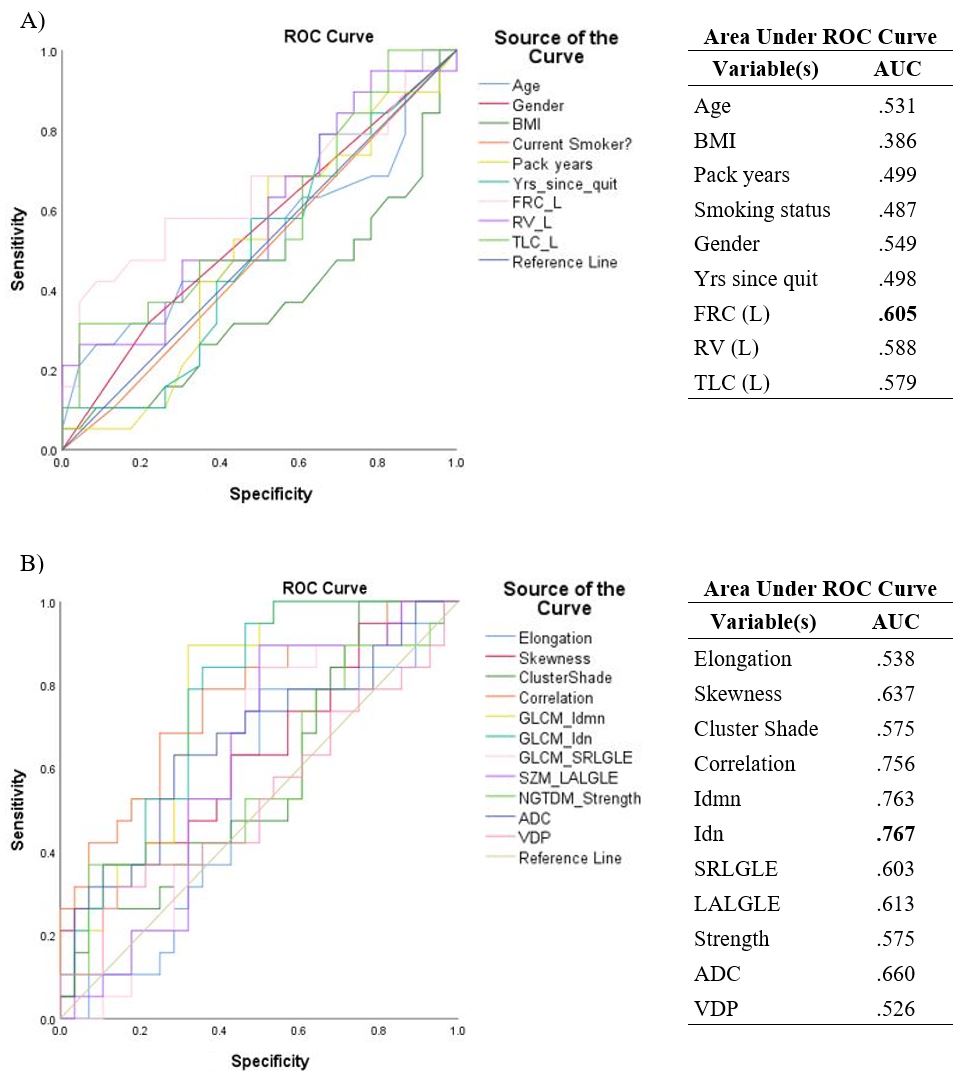
We identified nine texture feature contributors, which resulted in four texture features that significantly contributed to machine-learning models that were used to predict participants with rapidly worsening CT emphysema at follow-up (2.5±0.6 years). The MRI-based model achieved 82% prediction accuracy with coarse decision tree algorithm and outperformed the standard clinical model (64%) as well as the clinical model with lung volumes included (70%). MRI-derived ADC and VDP were both outperformed by individual MRI-derived texture features, validated using the AUC metric from the generated ROC curves. The best performing clinical variable for this dataset was functional residual capacity or FRC (AUC=0.605), whereas GLCM-Idn was the overall best performing texture feature (AUC=0.767) in the MRI model. Additionally, all texture features except Elongation, FO-Skewness, GLCM-Cluster Shade and RLM-SRLGLE provided weak-to-moderate correlations (r=0.2-0.5, p<.05) with FEV1, FEV1/FVC, RA950 and MRI-ADC measurements.Conclusions:
We have identified hyperpolarized gas MRI texture features that independently and uniquely correlated and predicted abnormal changes in CT RA950 nearly 3 years later. Future work will necessarily focus on detailed feature interpretation towards a deeper understanding of the physiological and pathological mechanisms of progressive emphysema worsening.Acknowledgements
No acknowledgement found.References
[1] Kauczor HU, et al. Pulmonary ventilation imaged by magnetic resonance: at the doorstep of clinical application. Eur Respir J. (2001). 17, 008-1023. doi:10.1183/09031936.01.17510080
[2] Lynch DA, Al-Qaisi MA. Quantitative computed tomography in chronic obstructive pulmonary disease. J Thorac Imaging. (2013). 28, 284-290. doi:10.1097/RTI.0b013e318298733c
[3] Mascalchi M, et al. Lung densitometry: why, how and when. J Thorac Dis. (2017). 9, 3319-3345. doi:10.21037/jtd.2017.08.17
[4] Parraga G, et al. Hyperpolarized 3He ventilation defects and apparent diffusion coefficients in chronic obstructive pulmonary disease: preliminary results at 3.0 Tesla. Invest Radiol. (2007). 42, 384-391, doi:10.1097/01.rli.0000262571.81771.66
[5] Miller M. R, et al. Standardisation of spirometry. Eur Respir J. (2005). 26, 319-338, doi:10.1183/09031936.05.00034805
[6] Vestbo J, et al. Global strategy for the diagnosis, management, and prevention of chronic obstructive pulmonary disease: GOLD executive summary. AJRCCM. (2013). 187, 347-365, doi:10.1164/rccm.201204-0596PP
[7] Mohamed Hoesein, F. A. A. et al. Computed tomography-quantified emphysema distribution is associated with lung function decline. Eur Respir J. (2012). 40, 844-850, doi:10.1183/09031936.00186311
[8] van Griethuysen J. J. M, et al. Computational Radiomics System to Decode the Radiographic Phenotype. Cancer Research. (2017). 77, 104-107, doi:10.1158/0008-5472.can-17-0339
[9] Kirby M, et al. Hyperpolarized 3He magnetic resonance functional imaging semiautomated segmentation. Acad Radiol. (2012). 19, 141-152, doi:10.1016/j.acra.2011.10.007
Figures