3559
Assessment of dynamic airflow heterogeneity after bronchodilator in asthma using hyperpolarized helium-3 MRI1University of Virginia, Charlottesville, VA, United States, 2University of Missouri, Columbia, MO, United States
Synopsis
With hyperpolarized helium-3 (3He) MRI regional differences in airflow heterogeneity can be assessed. In this study, we used weighted entropy to evaluate dynamic ventilation heterogeneity in asthmatics. Serial 3He/1H scans were co-registered and normalized for comparison. Weighted entropy was calculated based on entropy and Ventilation defect percentage (VDP) values derived from normalized 3He scans. Lobar analysis was performed to identify lobar weighted entropy. We found that asthmatics have more heterogeneous ventilation distribution in the lower lobes at baseline. Variable airflow heterogeneity changes were observed globally in asthmatics, with the most significant bronchodilator response in the left lung.
Introduction
Asthma is a heterogeneous disease characterized by episodic airflow obstruction, airway remodeling, and variable response to therapy. Treatment of asthma is generally tailored to the severity of symptoms and adjusted based on the level of self-reported symptom control 1. Approximately 50% of asthmatics remain poorly controlled 2 with up to 10% experiencing recurrent exacerbations. Recent clinical studies suggest that poor disease control is due to airflow heterogeneity 1, associated with luminal inflammation and airway remodeling as the disease progresses. Yet, the means to comprehensively evaluate and longitudinally track the dynamic airflow heterogeneity remains unknown. Hyperpolarized 3He MRI (HP 3He MRI) offers the capability to depict dynamic airflow changes with segmental resolution. In this study, we evaluated variable airflow heterogeneity responses at the lobar level in asthmatics following bronchodilator (BD) therapy.Methods
Patients with a clinical diagnosis of asthma (n=36, age=25.6±5.8) and healthy controls (n=8, age=22.1±5.7) were enrolled for HP 3He MRI using a 1.5-T scanner (Siemens Healthcare, Erlangen, Germany). All subjects underwent 3He ventilation MRI accompanied by matching 1H thoracic cavity imaging at baseline and after BD. 3He MRI was acquired using a fast low-angle shot sequence with 1.95x1.95x10 mm3 (coronal) or 1.64x1.64x10 mm3 (axial) spatial resolution. The 1H anatomy scan was acquired using a Turbo spin-echo (TSE) sequence. To evaluate therapy response, the baseline and post-treatment ventilation scans were normalized by 1) co-registering the baseline and post-treatment 3He/1H scans, 2) correcting the aligned 3He images for RF-induced inhomogeneity3, 3) normalizing the intensity range of the aligned 3He scans using histogram matching4, and 4) normalizing the ventilation scan intensity histograms to a range of 0 to 1 by rescaling to the top percentile. Ventilation defect percentage (VDP) was first derived from each of the normalized 3He scans using the binning method 5. For each normalized 3He scan, local entropy was quantified by calculating the minimum number of bits needed to encode the local intensity histogram. The lobar analysis was performed to determine the entropy in each lobe6. Regions with essentially no ventilation also exhibit low entropy given the minimal local intensity variations. Patients with high VDP may thus yield a small averaged global entropy, similar to a healthy subject. Therefore, we introduced a new index – weighted entropy – quantified by multiplying global or lobar VDP ratios and the global or lobar entropy values, respectively. Differences in global weighted entropy, lobar weighted entropy, and response to BD between healthy and asthmatics were performed employing the Mann Whitney test.Results
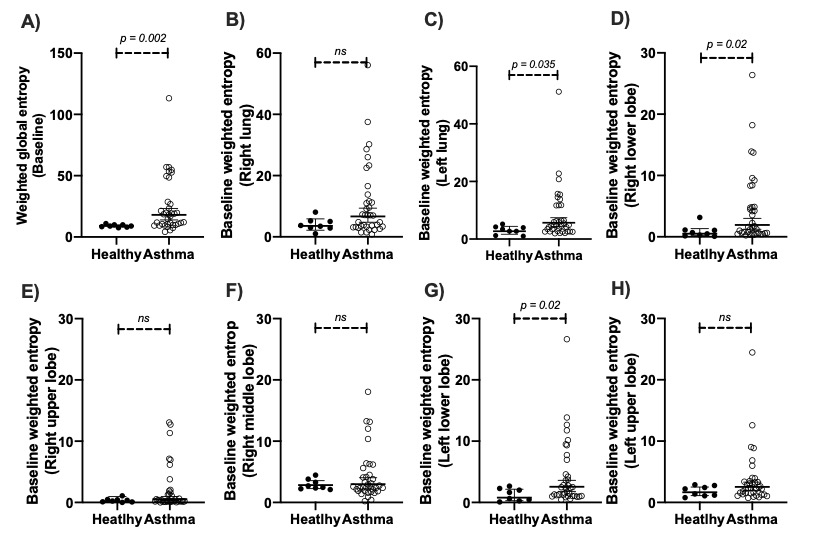
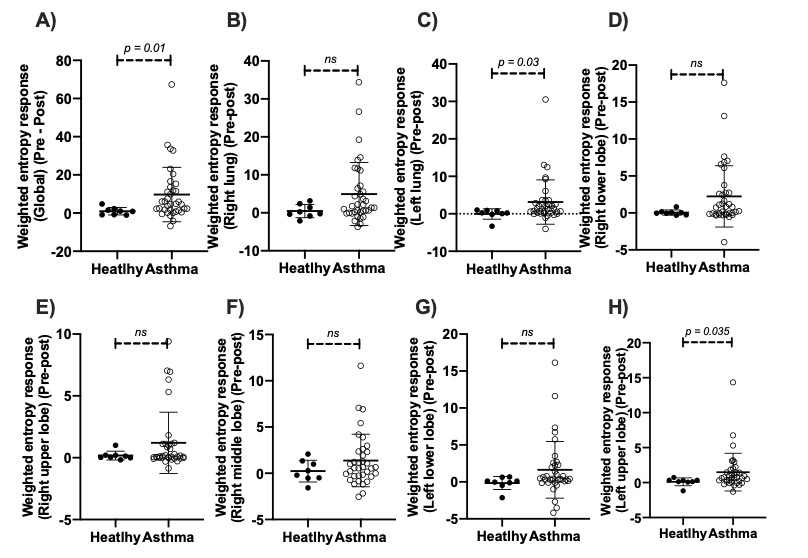
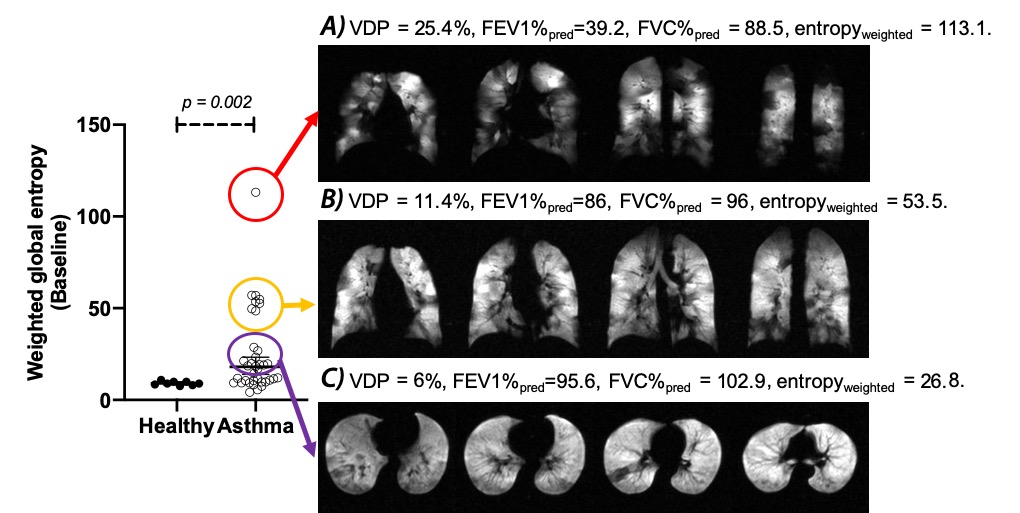
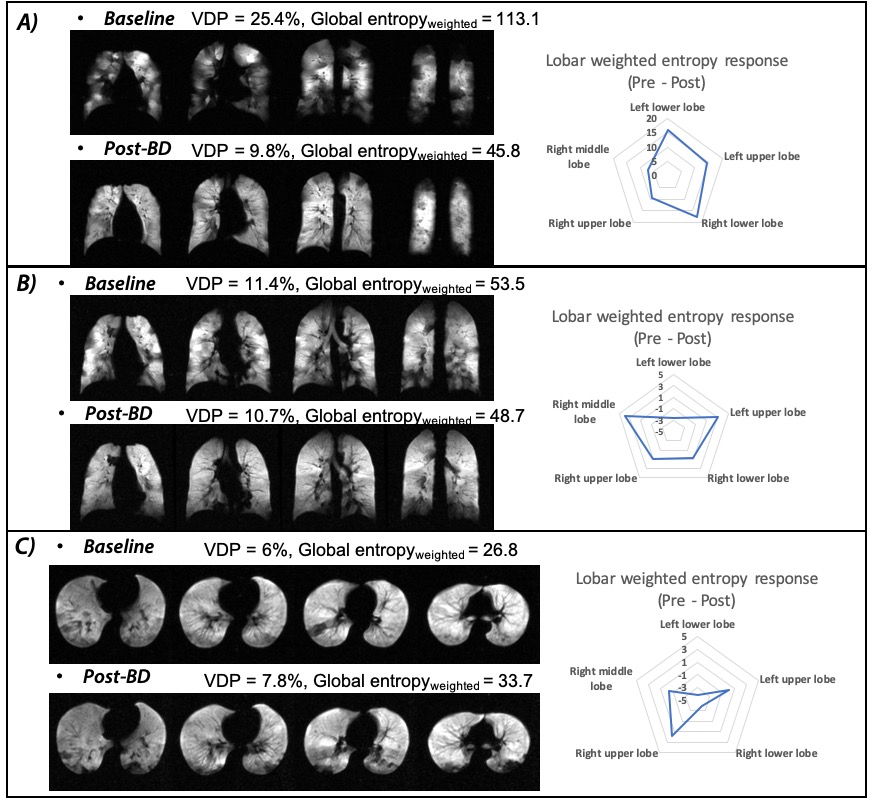
At baseline, asthmatics showed significantly higher VDP compared to controls (p = 0.0038), yet no significant lobar VDP difference was found between healthy controls and asthmatics. Employing the weighted entropy index, asthmatics showed significantly higher global weighted entropy than controls (Healthy: 9.1 ± 1.1, Asthma: 25.2 ± 22.6, p = 0.002, Figure 1). Asthmatics also showed significantly higher lobar weighted entropy in the left lower lobe (p = 0.02) and the right lower lobe (p = 0.02) (Figure 1). After BD, asthmatics demonstrated significant global weighted entropy response compared to healthy subjects, with the most significant improvement in the left lung (Figure 2). Figure 3 presents three representative asthmatics that each belongs to a certain weighted entropy group: 1) greater than 15 but lower than 25; 2) greater than 25 but lower than 75, and 3) greater than 75. Figure 3A shows a 35-year-old female with FEV1%pred=39.2, FVC%pred = 88.5, FEF2575%pred=6.6 at baseline. After BD, FEV1%pred=90.5, FVC%pred = 124.45, FEF2575%pred=53.8. VDP decreased from 25.4% to 9.8%. The global weighted entropy was 113.1 at baseline and decreased to 45.8 after BD. The lobar analysis further demonstrated that all lobes contributed to the global weighted entropy decrease as shown in figure 4A, while the left lung and the right lower lobe improved the most. Figure 3B shows 28-year-old male with FEV1%pred=86, FVC%pred = 96, FEF2575%pred=64 at baseline. After bronchodilator, FEV1%pred=97, FVC%pred = 104, FEF2575%pred=80. VDP decreased from 11.4% to 10.7%. The global weighted entropy was 53.5 at baseline and decreased to 48.7 after therapy. The lobar analysis showed that all lobes have contributed to the weighted entropy decrease, except the left lower lobe (figure 4B). Figure 3C shows a 24-year-old male with FEV1%pred=95.6, FVC%pred = 102.9, and FEF2575%pred = 81.7 at baseline. After bronchodilator, FEV1%pred=117.3, FVC%pred = 119.6, and FEF2575%pred=133.6. VDP increased from 6% to 7.5%. The global weighted entropy was 26.8 at baseline and increased to 33.7 after therapy. The lobar analysis showed that the left lower lobe and the right lower lobe contributed to the increased weighted entropy (figure 4C).Conclusions and Discussion
We found that variable 3He ventilation distribution changes were observed globally in patients with asthma, with the most significant improvement in the left lung. In asthmatics with global improvement in weighted entropy, different lobes may perform differently in airflow distribution. These findings support that airflow obstruction in asthma has a heterogeneous distribution in the lung. Further investigation is needed to better define the various endotypes in asthma and determine how various weighted entropy values relate to the different levels of asthma control.Acknowledgements
This work is supported by National Heart, Lung, and Blood Institute of the National Institutes of Health (grant no. RO1 HL66479, R01-CA172595, and S10-OD018079).References
1. Svenningsen, S., Nair, P., Guo, F., McCormack, D. G. & Parraga, G. Is ventilation heterogeneity related to asthma control? European Respiratory Journal 48, 370-379 (2016).
2. Yaghoubi, M., Adibi, A., Safari, A., FitzGerald, J. M. & Sadatsafavi, M. The Projected Economic and Health Burden of Uncontrolled Asthma in the United States. Am J Respir Crit Care Med 200, 1102-1112, doi:10.1164/rccm.201901-0016OC (2019).
3. Tustison, N. J. et al. N4ITK: improved N3 bias correction. IEEE Trans Med Imaging 29, 1310-1320, doi:10.1109/TMI.2010.2046908 (2010).
4. Nyul, L. G. & Udupa, J. K. On standardizing the MR image intensity scale. Magnetic resonance in medicine : official journal of the Society of Magnetic Resonance in Medicine / Society of Magnetic Resonance in Medicine 42, 1072-1081, doi:10.1002/(sici)1522-2594(199912)42:6<1072::aid-mrm11>3.0.co;2-m (1999).
5. He, M., Driehuys, B., Que, L. G. & Huang, Y.-C. T. Using hyperpolarized 129Xe MRI to quantify the pulmonary ventilation distribution. Academic radiology 23, 1521-1531 (2016).
6. Tustison, N. J., Qing, K., Wang, C., Altes, T. A. & Mugler, J. P., 3rd. Atlas-based estimation of lung and lobar anatomy in proton MRI. Magn Reson Med 76, 315-320, doi:10.1002/mrm.25824 (2016).
Figures