3558
Optimizing Acquisition and Analysis for Diffusion Weighted Hyperpolarized 129Xe MRI of Pediatric and Adult Lungs1Center for Pulmonary Imaging Research, Cincinnati Children's Hospital Medical Center, Cincinnati, OH, United States, 2Biomedical Engineering Department, University of Cincinnati, Cincinnati, OH, United States, 3Division of Biostatistics and Epidemiology, Cincinnati Children's Hospital Medical Center, Cincinnati, OH, United States, 4Division of Pulmonary Medicine, Cincinnati Children’s Hospital Medical Center, Cincinnati, OH, United States, 5Philips, Cincinnati, OH, United States, 6Department of Pediatrics, University of Cincinnati, Cincinnati, OH, United States
Synopsis
Hyperpolarized (HP) 129Xe MRI can non-invasively quantify lung microstructure through measuring the gas-phase apparent diffusion coefficient (ADC), providing insights into disease pathophysiology—e.g., emphysema severity. To maximize the utility of this method, we developed an analytical model, based on HP-specific Bloch equations and error propagation, to optimize ADC measurements in terms of acquisition parameters (b-value, flip angle, phase encodes, etc.) and the ADC itself and validated this model via Monte Carlo and phantom studies. Finally, a lower bound on the expected 129Xe ADC was obtained by measuring ADC as a function of age in human subjects as young as six years.
Introduction
Hyperpolarized 129Xe MRI enables non-invasive strategies to quantify lung function and structure1-4. Diffusion-weighted (DW) MRI—specifically the 129Xe apparent diffusion coefficient (ADC)—is a well-validated measure of airspace size, with elevated ADC reflecting alveolar enlargement in a range of disorders5-9. Further, pulmonary microstructure dimensions can be quantified using multi-b-value diffusion morphometry10,11. Various factors impact the precision and accuracy of ADC measurements, including acquisition parameters, fitting methods and the ADC itself, but these effects have not been rigorously investigated for HP 129Xe. Here, we introduce a general, analytical model—based on error propagation and hyperpolarized magnetization dynamics—to optimize 129Xe diffusion MRI. Moreover, frequentist and Bayesian fittings were investigated for estimating ADC. Finally, we report the age dependence of the 129Xe ADC in pediatric volunteers, allowing the lower ADC limit to be estimated for in human subjects. Together these approaches and data can be used to design ADC protocols to maximize the accuracy of in-vivo measurements.Methods
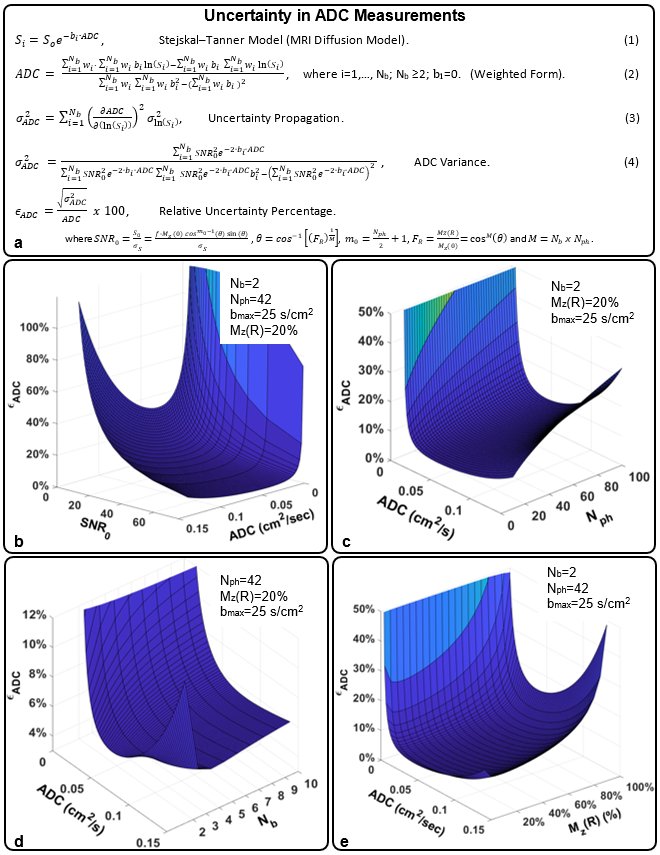
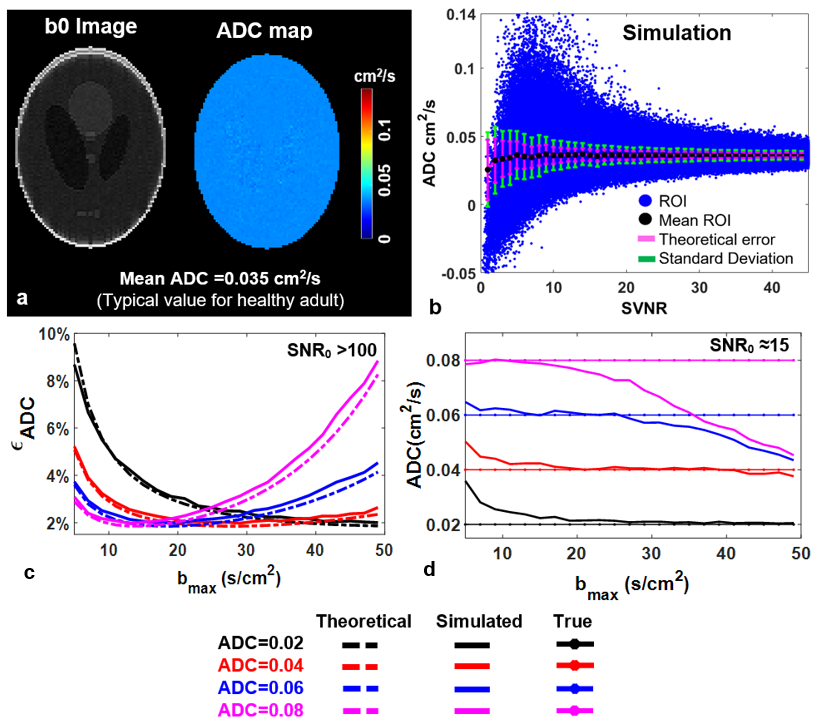
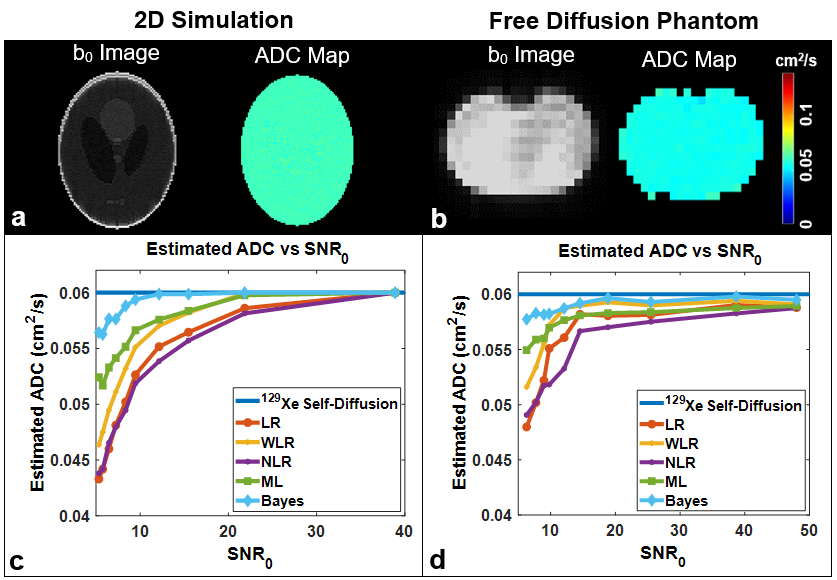
Theory and Simulation: An analytical solution for 129Xe ADC uncertainty was derived using error propagation and HP-modified Bloch equations (Fig. 1a). Variables included key MRI parameters: i.e., maximum b-value (bmax=5−50 s/cm2), number of b-values (Nb=2−10), number of phase encoding (Nph=20−100), and residual magnetization (fraction of HP magnetization remaining upon scan completion, 0> Mz(R) <100%). To validate the model, simulations (MATLAB, Mathworks, Natick, MA) were performed by modeling signal decay according to Soe-bi ADC and scaling So as cosm-1(θ)sin(θ) and adding complex Gaussian noise during image reconstruction.Phantom: Digital phantom images were created with various noise levels and sampled (bmax=25 s/cm2, Nb=5, and ADC=0.06 cm2/s). Additionally, a Tedlar bag (300 mL) was imaged using the same acquisition parameters as the Digital phantom.
In-Vivo: 32 healthy subjects (age 6-40, mean=15.2±7.8 y.o.) underwent 129Xe MRI. HP 129Xe gas was polarized to 15−40% (Model 9800 or 9820, Polarean plc, Durham, NC). Diffusion MR Images were acquired on a 3T Philips Achieva scanner [resolution= 5x5 mm2, BW=264.8 Hz/pixel, TE=2.9 ms, TR=6.1 ms, FOV=250−350 mm, Nph=40−70, 3−8 slices, slice-thickness=15 mm, b-values = (0, 6.25, 12.5, 18.75, 25) s/cm2] during a <16 s breath-hold at inspiration. Inhaled 129Xe volume was equal to 1/6th of the subject’s predicted total lung capacity or 1L for adults. Image reconstruction and data fitting were performed in MATLAB and using WinBUGS for Bayesian ADC fitting.
Results
The analytical model predicts the decreases in the signal-to-noise ratio of the b0 image (SNR0) will yield a corresponding increase in relative ADC uncertainty, 𝝐ADC (Fig. 1b). Thus, changes in the image acquisition parameters that determine SNR0 will also impact uncertainty. An increase in Nph would necessarily increase the number of RF pulses and 𝝐ADC displays a corresponding increase (Fig. 1c). The 𝝐ADC as a function of Nb depends strongly on the ADC value itself, resulting in a global minima at Nb=2 for ADC<0.06 cm2/s and Nb=3-4 for ADC>0.06 cm2/s (Fig. 1d). Further, the model predicts the appearance of an uncertainty minimum as a function of Mz(R) —appearing at Mz(R) = 20% in Fig. 1e.The standard deviation resulting from the simulation exceeds that of the closed-form theory (Fig. 2b), particularly at a low signal value-to-noise ratio (i.e., voxel-level SNR, SVNR) due to sampling and reconstruction imperfections. However, the values begin to converge with the analytical solution at higher SVNR. Further agreement of 𝝐ADC displays a clear minimum at an optimal value of bmax for a given ADC (Fig. 2c). The extracted ADC estimates were highly accurate when using nearly optimal bmax values (Fig. 2d). For ADC fitting methods, Bayesian fit outperformed all other fitting methods (error <5% even in low SNR) (Fig. 3c & d).
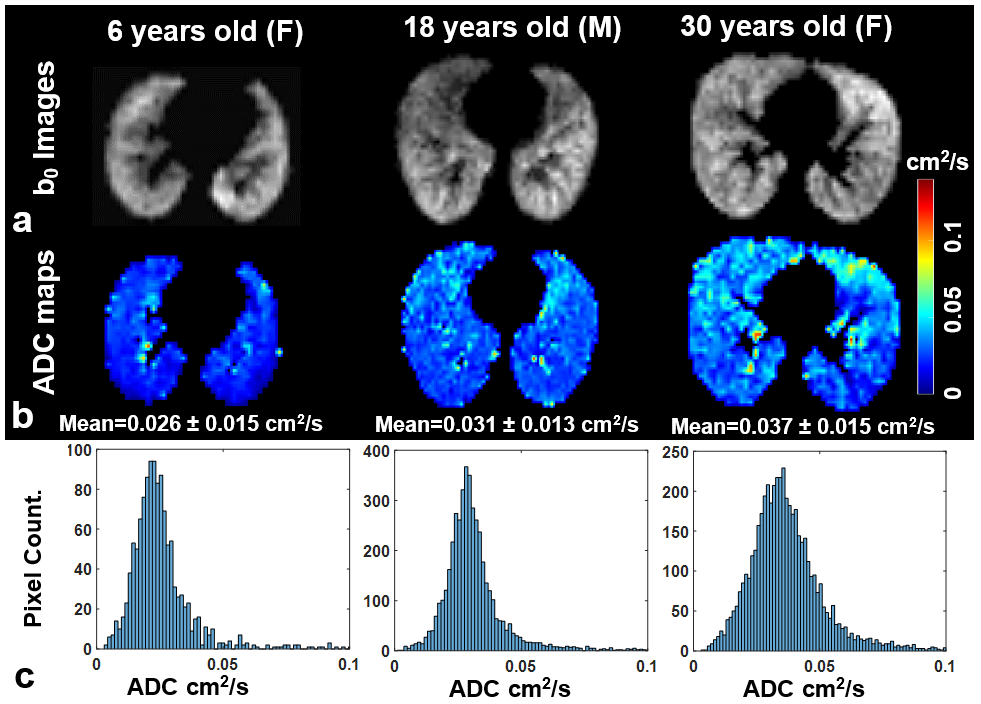
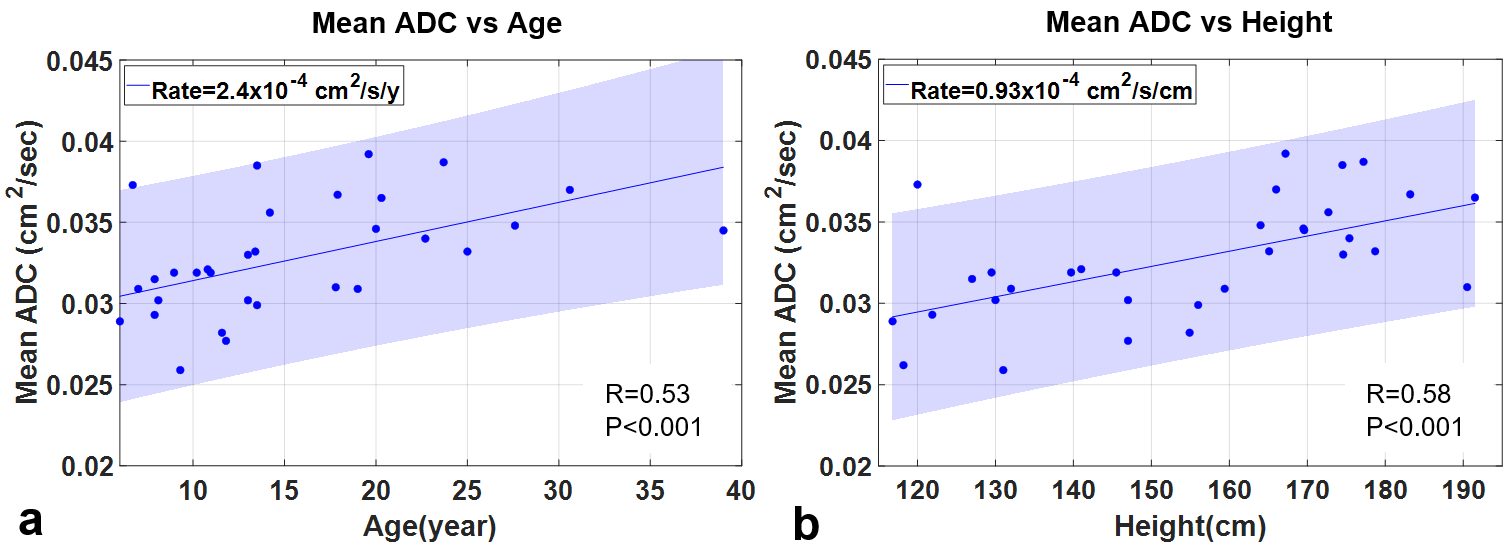
Representative b0 images, ADC maps, and whole-lung ADC histograms from healthy subjects are shown in Fig. 4, for subjects ages 6, 18 and 30 years. The mean ADC of all subjects was found to increase at a rate of 2.4x10⁻⁴ cm2/s/year (p=0.001) with age (Fig. 5a) and 0.93x10⁻⁴ cm2/s/cm (p=0.001) with height (Fig. 5b).
Discussion
The optimal bmax varies with age but was occurs in the range of 10-25 s/cm2, which are readily achieved by most scanner platforms and within the confines of a held breath. Relative to b-value or ADC value, SNR0 dominates the ADC uncertainty or variance,σ2ADC, under practical conditions. However, SNR and thus the uncertainty of ADC is impacted by the experimental parameters that impact the HP magnetization dynamics. For example, SNR decreases with increasing Nph leading to a less certain 129Xe ADC measurements. Of considerable scientific interest, using 3- 4 b-values optimizes 129Xe ADC measurements for most subjects, meaning that multi-b-value morphometric data can be acquired without sacrificing the accuracy of the simpler ADC measurements.Conclusion
Acquisition parameters that generate 𝝐ADC near the predicted minimum will maximize the accuracy of 129Xe ADC measurements. Because ADC varies significantly in different disease states and non-trivially as a function of subject age, care must be taken when selecting these parameters. The model presented here, combined with prior knowledge (e.g., age-dependence of 129Xe ADC), will allow optimal parameter selection, thus providing ADC measures that best reflect microstructural changes during lung disease progression and therapy response.Acknowledgements
The authors thank the following sources for research funding and support: NIH (R00HL111217, R44HL123299, R01HL131012 and R01HL143011) and the Cystic Fibrosis Foundation (CLEVEL16A0).References
1.Walkup LL, Woods JC JNiB. Translational applications of hyperpolarized 3He and 129Xe. 2014;27:1429-1438.
2.Goodson BM JJoMR. Nuclear magnetic resonance of laser-polarized noble gases in molecules, materials, and organisms. 2002;155:157-216.
3.Ruppert KJ RoPiP. Biomedical imaging with hyperpolarized noble gases. 2014;77:116701.
4.Mugler III JP, Altes TA JJoMRI. Hyperpolarized 129xe MRI of the human lung. 2013;37:313-331.
5. Kaushik SS, Cleveland ZI, Cofer GP, et al. Diffusion-weighted hyperpolarized 129Xe MRI in healthy volunteers and subjects with chronic obstructive pulmonary disease. Magn Reson Med 2011;65:1154-1165.
6.Thomen RP, Quirk JD, Roach D, Egan‐Rojas T, Ruppert K, Yusen RD, Altes TA, Yablonskiy DA, Woods JC JMrim. Direct comparison of 129Xe diffusion measurements with quantitative histology in human lungs. 2017;77:265-272.
7.Mammarappallil JG, Rankine L, Chan H-F, Weatherley N, Wild J, Driehuys B JJoti. New developments in imaging idiopathic pulmonary fibrosis with hyperpolarized xenon MRI. 2019;34:136.
8.Walkup LL, Roach DJ, Hall CS, Gupta N, Thomen RP, Cleveland ZI, McCormack FX, Woods JC JAotATS. Cyst ventilation heterogeneity and alveolar airspace dilation as early disease markers in lymphangioleiomyomatosis. 2019;16:1008-1016.
9.Wang K, Pan T, Yang H, Ruan W, Zhong J, Wu G, Zhou X JJotd. Assessment of pulmonary microstructural changes by hyperpolarized 129Xe diffusion-weighted imaging in an elastase-instilled rat model of emphysema. 2017;9:2572.
10.Sukstanskii A, Yablonskiy DJMrim. Lung morphometry with hyperpolarized 129Xe: Theoretical background. 2012;67:856-866.
11.Chan HF, Stewart NJ, Norquay G, Collier GJ, Wild JM JMrim. 3d diffusion‐weighted 129xe MRI for whole lung morphometry. 2018;79:2986-2995.
12.Baraldo S, Ieva F, Mainardi L, Paganoni AM. Estimation approaches for the apparent diffusion coefficient in rice-distributed MR signals. Complex models and computational methods in statistics: Springer; 2013. p 13-26.
13.Jha AK, Rodríguez JJ. A maximum-likelihood approach for ADC estimation of lesions in visceral organs. 2012. IEEE. p 21-24.
Figures