3555
Integrated Spin-Echo EPI scans for Fast Simultaneous B1 and B0 mapping in the Human Brain
Sofia Chavez1,2
1Centre for Addiction and Mental Health (CAMH), Toronto, ON, Canada, 2Psychiatry, University of Toronto, Toronto, ON, Canada
1Centre for Addiction and Mental Health (CAMH), Toronto, ON, Canada, 2Psychiatry, University of Toronto, Toronto, ON, Canada
Synopsis
Quantitative MRI requires accurate knowledge of the spatially varying B1 and B0 fields in order to accurately account for their effects on relevant parameters included in the signal models. B1 maps in the human brain are commonly produced from a double-angle method (DAM) with many variations in the implementations. B0 maps are usually estimated from the distortions in two 2D axial EPI scans acquired with opposing phase encode directions (topup). Here, we propose to integrate the SE-EPI scan requirements for B0 mapping with topup and B1 mapping with the DAM, for simultaneous B1 and B0 mapping with reduced scan time.
Introduction
Quantitative MRI requires accurate knowledge of the spatially varying B1 and B0 fields in order to accurately account for their effects on relevant parameters included in the signal models. In particular, B1 inhomogeneity affects the flip angle and B0 inhomogeneity causes off-resonance effects which can impact phase, signal decay and also flip angle. Several methods have been proposed to quantify B1 and B0 effects (so-called B1 and B0 maps) but to our knowledge, none have used the same scans to acquire both as we are proposing in this work.B1 maps in the human brain are commonly produced from a double-angle method (DAM)1 which requires two volumes acquired with flip angles (α,2α). There are many variations in the implementations for the DAM which can be spin-echo (SE) or gradient-echo (GRE) based and acquired with various fast imaging sequences (fastSE, FSE2, or echo-planar imaging, EPI3). Due to timing constraints, the DAM is typically performed using 2D acquisitions. Generally, B1 mapping methods using 3D scans (Bloch-Siegert4, Actual Flip Angle Imaging5) are preferred because they avoid slice profile effects. Recently, we have proposed an empirical method to correct the bias in the B1 maps resulting from the various implementations, accounting for effects such as slice profile and poor spoiling6. The resulting calibration of B1-mapping methods improves the accuracy of B1 maps computed from 2D acquisitions such as the recently proposed EPI-based DAM3. B0 maps that were traditionally computed from the phase rotation between two, or more, echo times are now usually estimated from the distortions in two 2D axial EPI scans acquired with reversed phase encode (PE) directions: anterior to posterior (AP) & PA7. The latter has been implemented in FSL (FMRIB Software Library) and is called topup8. In this work, we propose to integrate the requirements for SE-EPI based B0 mapping with topup (AP & PA), with those for B1 mapping with the SE-EPI-DAM (α1=60° and 120°), for simultaneous B1 and B0 mapping with reduced scan time.
Methods
Three healthy volunteers were scanned using a 32-channel head coil (Nova Medical), in a 3T MRI scanner (MR750, GE Healthcare, WI) according to the institutional REB. Our scanning protocol consisted of four SE-EPI volumes collected such that there were two at each value of α1: 60° and 120° (required for the SE-based DAM) acquired with reversed PE directions (AP and PA). The B1 and B0 fields are expected to vary gradually (with the exception of B0 near the sinuses) thus the scans were acquired with a somewhat coarse 2.4 mm isotropic resolution in a scan time of 15 s per volume, with scanning parameters: TE/TR=80 ms/15 s, 90×90 in-slice, FOV=21.6 cm, 70×2.4 mm slices (total scan time= 4×15 s=1 min). No in-plane acceleration (ASSET=1) was used in order to allow for large distortions to better inform topup. Standard acquisitions for FSE-DAM B1 mapping (as per ref.2) and topup field mapping (DTI sequence with three b=0 volumes acquired at 2 mm3, ASSET=2,128x128, TE/TR=60.8 ms/8.8 s in each PE direction, AP and PA) were acquired for comparison/validation.The processing steps are illustrated in the cartoon of Fig.1. For all computations across volumes, the images were first co-registered using FSL’s flirt to account for any motion across scans. A calibration procedure was performed to reduce the bias in the B1 map as per ref.6.
Results
The two SE-EPI scans collected with reversed PE directions, for a given α1, were of good contrast to be undistorted using topup (which was designed for DTI data sets) such that undistorted volumes for α1 =60° and α1=120° were readily produced (Fig.2). These could then be processed in the usual way by the DAM for B1 mapping (with a calibration6). Resulting B1 and B0 maps compared well with standard (i.e., published) methods as shown in Figs.3 and 4.Discussion
The B0 map could be made two different ways: (i) each (AP,PA) dataset at a given α1 was used to produce a B0 map and the two resulting B0 maps were subsequently averaged or (ii) using topup on the set of (AP,PA) images produced by averaging over α1 for each PE direction. The latter method (ii) gave much better results (assessed visibly as in Fig.3).Conclusion
By acquiring SE-EPI scans in reversed PE directions (AP,PA) while modifying the contrast to include two values for α1 required for the DAM (α,2α), we were able to integrate the requirements for the simultaneous acquisition of data for B1 and B0 mapping. This enabled the production of B1 and B0 maps in 1 min of scan time that compare well with other established protocols.Acknowledgements
We acknowledge the support of the Natural Sciences and Engineering Research Council of Canada (NSERC).References
- Stollberger R, Wach P. Imaging of the active B-1 field in vivo. Magnetic Resonance in Medicine. 1996;35:246-251.
- Samson RS, Wheeler-Kingshott CAM, Symms MR, Tozer DJ, Tofts PS. A simple correction for B-1 field errors in magnetization transfer ratio measurements. Magnetic Resonance Imaging. 2006;24:255-263.
- Boudreau M, Stikov N, Pike GB. B-1-sensitivity analysis of quantitative magnetization transfer imaging. Magnetic Resonance in Medicine. 2018;79:276-285.
- Sacolick LI, Wiesinger F, Hancu I, Vogell MW. B-1 Mapping by Bloch-Siegert Shift. Magnetic Resonance in Medicine. 2010;63:1315-1322.
- Yarnykh VL. Actual flip-angle imaging in the pulsed steady state: A method for rapid three-dimensional mapping of the transmitted radiofrequency field. Magnetic Resonance in Medicine. 2007;57:192-200.
- Desmond KL, Xu R, Sun Y, Chavez SE. A practical method for post-acquisition reduction of bias in fast, whole-brain B1-maps. Magnetic Resonance Imaging. 2020.
- Andersson JLR, Skare S, Ashburner J. How to correct susceptibility distortions in spin-echo echo-planar images: application to diffusion tensor imaging. Neuroimage. 2003;20:870-888.
- Smith SM, Jenkinson M Fau - Woolrich MW, Woolrich Mw Fau - Beckmann CF, et al. Advances in functional and structural MR image analysis and implementation as FSL.
Figures
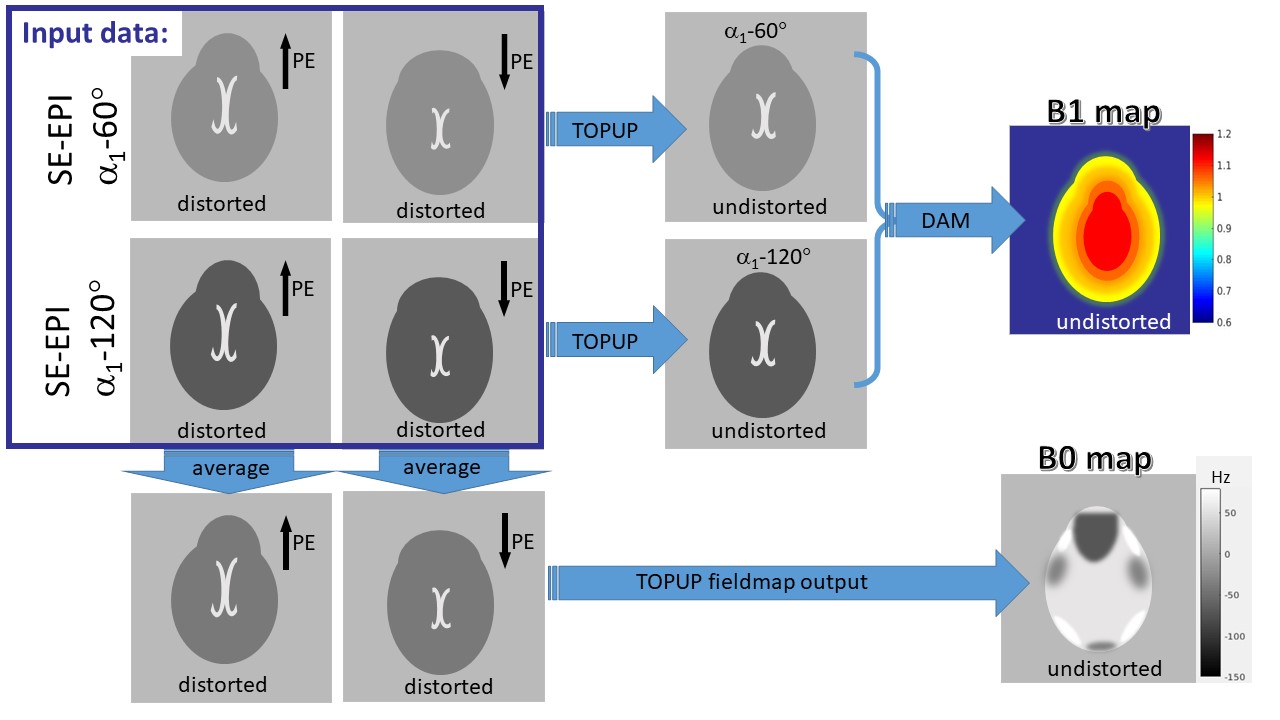
Fig.1 Cartoon depicting the proposed acquisitions and processing pipeline. The images contained in the purple square (top left) represent the four SE-EPI scans that need to be acquired (each in 15 s).
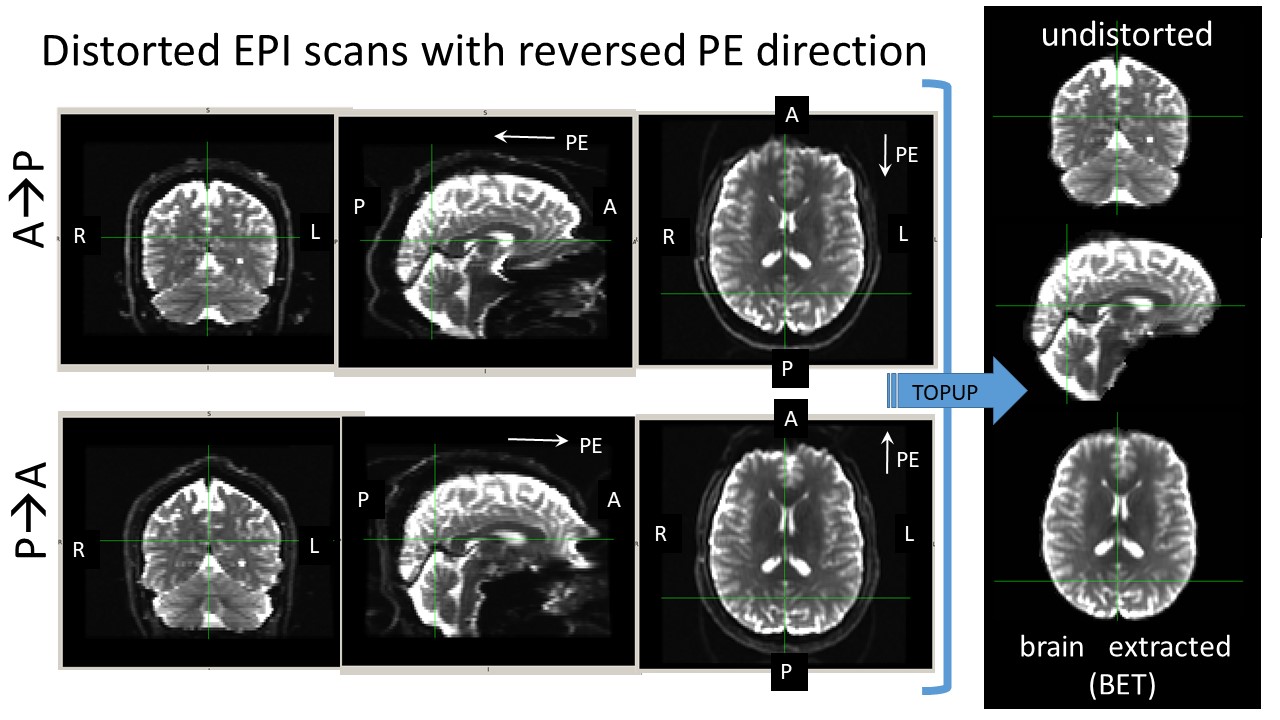
Fig.2 Example of the two distorted reversed PE EPI acquisitions for α1 =60°: top row is for AP and bottom row is for PA. On the right is the final undistorted image using FSL's topup and brain extraction tool (bet).
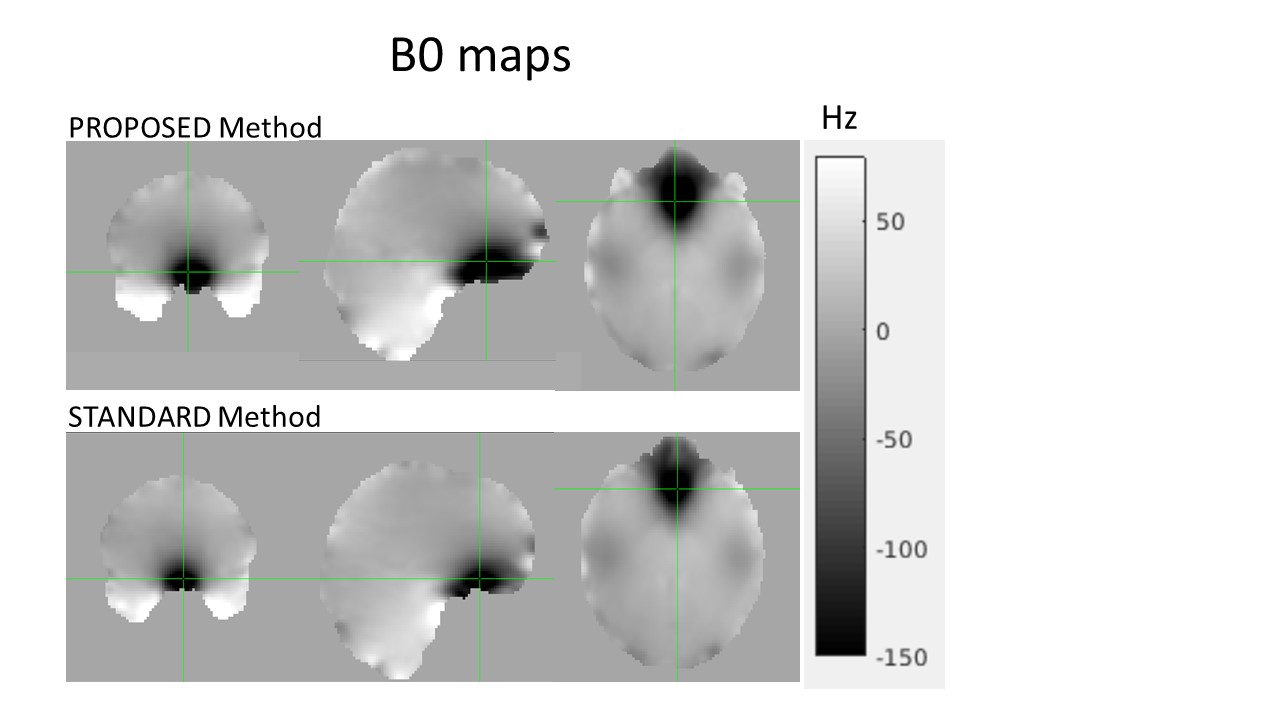
Fig.3 Sample of the B0 map produced using the proposed method compared to the B0 map produced using a typical DTI-based protocol in our Centre (where α1 has not been modified from the standard 90°).
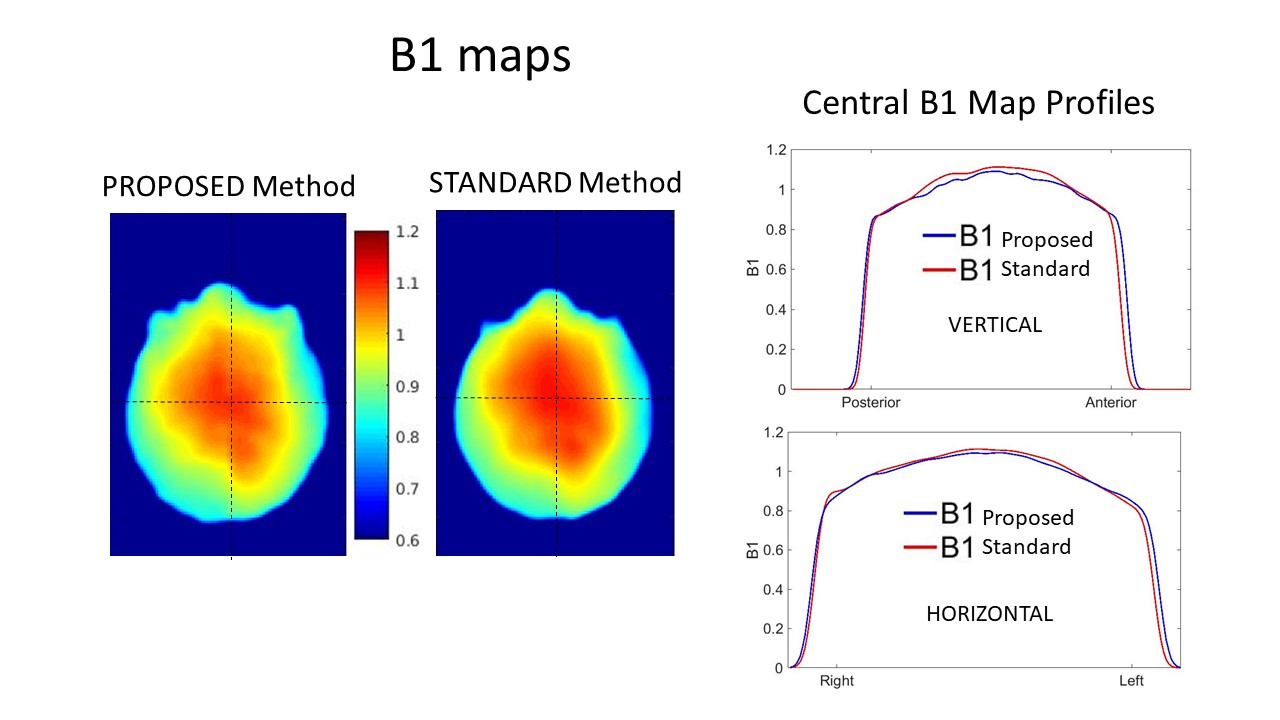
Fig.4 Sample of the B1 map produced using the proposed method compared to the B1 map produced using a typical SE-DAM protocol in our Centre (as per ref.2). The horizontal and vertical profiles are plotted on the right to show the very good agreement between these two B1 maps.