3554
Correction of transmit-field induced signal inhomogeneity in 3D MP-FLAIR at 7T1Philips Healthcare, Copenhagen, Denmark, 2Danish Research Centre for Magnetic Resonance, Centre for Functional and Diagnostic Imaging and Research, Copenhagen University Hospital, Hvidovre, Denmark, 3Department of Radiology, University Medical Center Utrecht, Utrcecht, Netherlands, 4Section for Magnetic Resonance, DTU Health Tech, Technical University of Denmark, Kgs Lyngby, Denmark
Synopsis
In order to ease radiological assessment of 7T MP-FLAIR images, we have developed a fully automated bias-field correction that reduces apparent signal loss caused by inhomogeneities in the RF transmit field. Using simulations and measurements of the transmit field, the bias-field can be corrected for without relying on the simplifying assumptions used in a typical bias-field correction. The algorithm is expandable to other TSE-based sequences and adds limited additional scan time.
Introduction
3D Magnetization Prepared FLuid-Attenuated Inversion Recovery (MP-FLAIR) is widely used at 7T as a whole-brain lesion contrast sequence. The combined effect of magnetization preparation, excitation and the turbo-spin echo readout makes the sequence highly dependent on the transmit field (B1+), (figure 2). Image quality is challenged by spatial inhomogeneity in the B1+ field, which causes local loss of signal, alteration of contrast, and broadening of the point spread function (PSF), which complicates radiological assessment of the images [1] (figure 3). Assuming acceptable SNR is pertained in the affected areas, bias-field correction can counter-act the apparent signal loss. Bias-field correction algorithms based solely on the input image itself are widely used in e.g., segmentation pre-processing. While these may address inhomogeneous B1+, receive field (B1-), and B0, they rely on assumptions of the bias-field, for example it being spatially slowly varying, or resemblance of the imaged brain to an atlas. This typically makes them ill-liked by radiologists, as they fear introduction of atypical artefacts not easily distinguishable from pathology, unexpected behavior for atypical images, or degradation of pathological signal characteristics. As an alternative, we show that a B1+ bias-field correction can be performed through acquisition of a B1+ map and simulations that predict signal dependency to B1+.Method
An extended phase graph simulation of an MP-FLAIR sequence (based on [2]. Parameters are outlined in figure 1) was repeated for multiple relative B1+ amplitudes using literature-values for T1, T2 [2] and proton density (PD) [3]. Scaling was only applied to non-adiabatic pulses. The TSE flip-angle train, simulated FLAIR intensity, gray/white matter contrast and simulated PSF are depicted in figure 2.A B1+ map (DREAM, 3.75mm×3.75mm, slice thickness: 3.50mm, preparation angle: 40o, scan time: 19 sec [4]) was acquired before 5 repetitions of the MP-FLAIR sequence on a Philips Achieva 7T MR scanner (Best, Netherlands) using a 2Tx/32Rx head coil (Nova Medical, Wilmington, MA, U.S). For each repetition the scanner’s RF gain was manually changed to 0.6, 0.8, 1.0, 1.2 and 1.4 of the initial RF gain. All scans were performed with dielectric pads (7TLF, Multiwave Imaging, Marseille, France) and are depicted in figure 3.
A (20mm)3 Gaussian smoothing kernel was applied to the DREAM B1+ map before it was resampled to the voxel space of the MP-FLAIR image. Values below 40% were rounded up to 40% to avoid noise-amplification where the DREAM sequence had low SNR (typically coinciding with areas of low SNR for the MP-FLAIR). The simulated signal dependency for white and grey matter was averaged after correction for difference in PD and adaptions made to mimic behavior of the scanner’s coil-addition algorithm. A B1+ bias-field was finally generated by voxel-wise interpolation of the measured B1+ map to the simulated MP-FLAIR-dependency to B1+.
Results
The high dependency of MP-FLAIR to B1+ and RF gain at 7T is exemplified in figure 3. Low RF gain leads to good image quality in the center of the brain, but image darkening in the peripheral areas. Contrary, a high RF gain leads to image darkening in the center and improvements peripherally.Figure 4 depicts the pixel-wise FLAIR intensity versus the measured relative B1+ amplitude for the 5 repeated FLAIR images. The simulated signal dependency used for generation of the bias field is likewise shown. Below 60% and above 140%, the ability of the simulation to predict the measured signal’s dependency of B1+ starts to decrease, which we ascribe to bias inherent to the DREAM sequence for very low and high flip angles [2].
Figure 5 depicts an MP-FLAIR image (RF gain: 1.0) before (top) and after (mid) applying the generated bias field. The measured B1+ map is likewise depicted (bottom). Centrally in the brain, where the B1+ map is hyper-intense (blue arrow), less intensity distortion is seen after correction. In more peripheral areas, where B1+ is hypo-intense (red arrows), the apparent signal intensity loss is partially mitigated, but the corrected images still appear somewhat dark. We ascribe this to the rounding of B1+ done to avoid amplifying noise in low-SNR areas.
Discussion and Conclusion
We have developed a B1+ bias-field correction aimed at easing radiological assessment of 7T MP-FLAIR images. While bias-field correction may improve human interpretation, it does not improve SNR, PSF or contrast affiliated with inhomogeneous B1+, and this approach remains inferior to techniques that successfully homogenize B1+. Such techniques are however typically cumbersome, expensive or prolongs scan time significantly, limiting their use outside advanced research protocols. In comparison, if a B1+ map is not already acquired, the suggested approach adds 20 seconds of additional scan time. Bias at low and high flip-angles may be reduced by using other B1+ mapping techniques or by acquisition of multiple DREAM maps [4], which may be advantageous for more inhomogeneous B1+ fields, e.g., if dielectric pads are not used. While the corrected image shows less signal intensity variation, other sources of local signal variation (e.g., B1- and B0 inhomogeneities) remain uncorrected for. While not investigated, we expect similar performance for other TSE-weighted sequences.The demonstrated implementation is computationally cheap, and can be implemented directly on the scanner console, easing implementation in the data flow downstream of the MR-scanner.
Acknowledgements
The 7T scanner was donated by the Danish Agency for Science, Technology and Innovation grant no. 0601-01370B, and The John and Birthe Meyer Foundation.References
[1] Trattnig, et al. "Key clinical benefits of neuroimaging at 7 T." Neuroimage 168 (2018): 477-489.
[2] Saranathan et al. "Optimization of magnetization-prepared 3-dimensional fluid attenuated inversion recovery imaging for lesion detection at 7 T." Investigative radiology 49.5 (2014): 290.
[3] Tofts, Paul S. "PD: proton density of tissue water." Quantitative MRI of the Brain (2003): 85-108.
[4] Olsson et al. "Reducing bias in DREAM flip angle mapping in human brain at 7T by multiple preparation flip angles." Magnetic Resonance Imaging 72 (2020): 71-77.
Figures
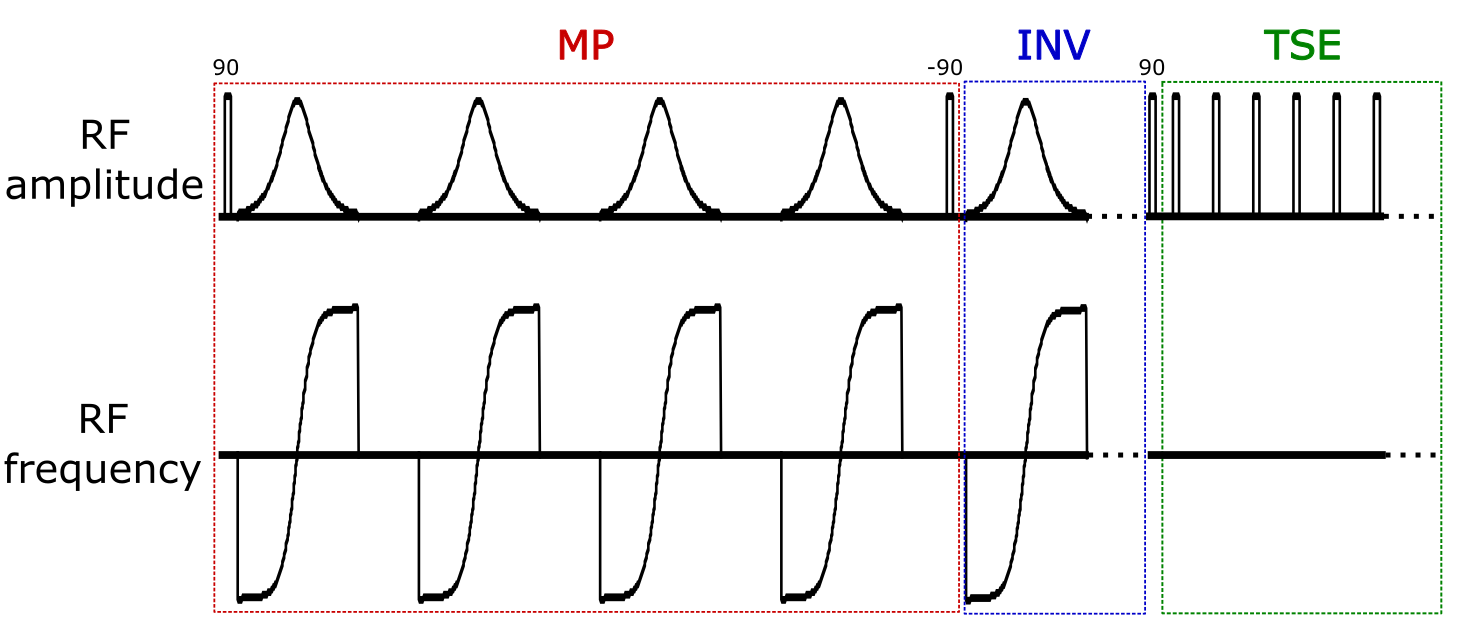
Figure 1:
Sequence diagram of the MP-FLAIR sequence. Sequence parameters: MP:107ms, INV: 2200ms, TSE echo-train length: 176, echo-spacing: 3.7ms, repetition time: 7140ms, image resolution: (0.7mm)3 FOV(mm): 250x250,190, sagital read-out, ~6:30min scan time. Numbers above RF pulses denotes flip-angles in degrees.
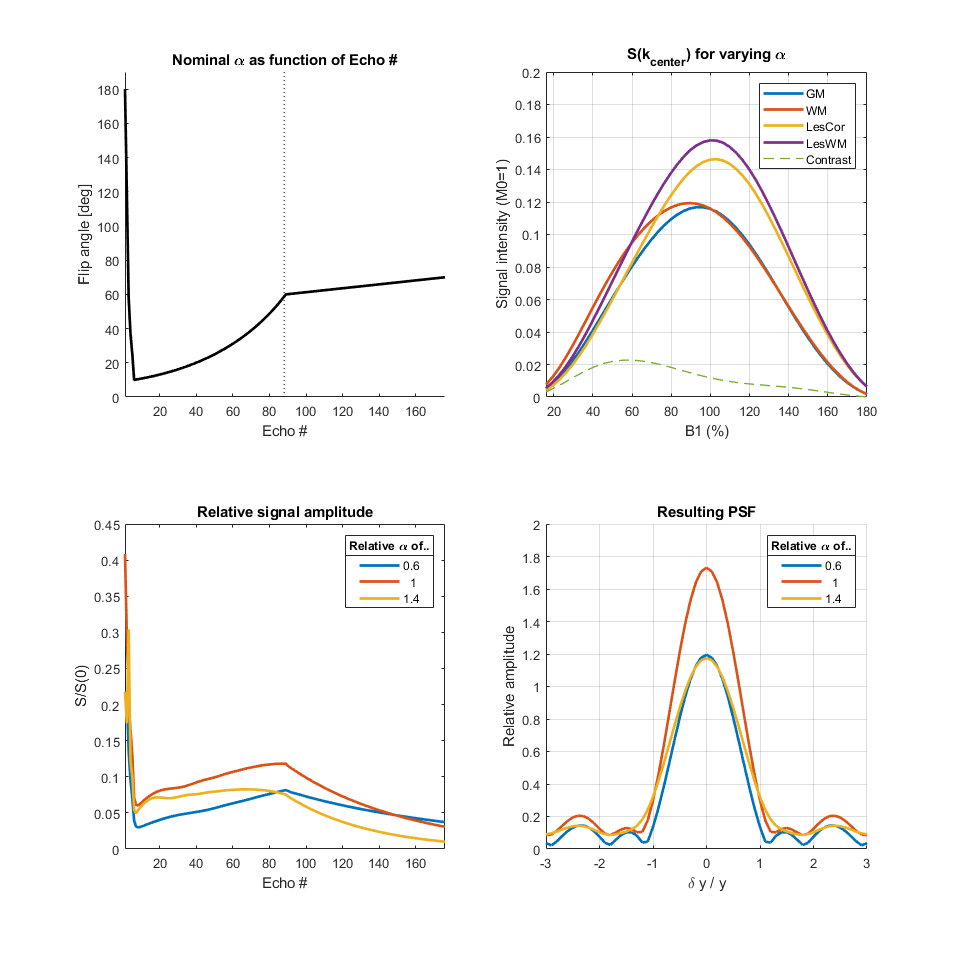
Figure 2:
Top left: The applied
flip-angle train. The dotted line denotes center of k-space.
Top right: Signal dependency to B1+ for grey matter (GM), white matter (WM), cortical lesions (LesCor), white matter lesions (LesWM). The contrast (difference between GM and WM after PD-correction) is depicted as a punctured line.
Bottom left: Simulated signal evolution through all echoes for 3 relative scalings of nominal B1+ (average of WM and GM after PD-correction).
Bottom right: Simulated PSF for 3 scalings of B1+ in the phase-encoding direction (average of WM and GM after PD-correction).
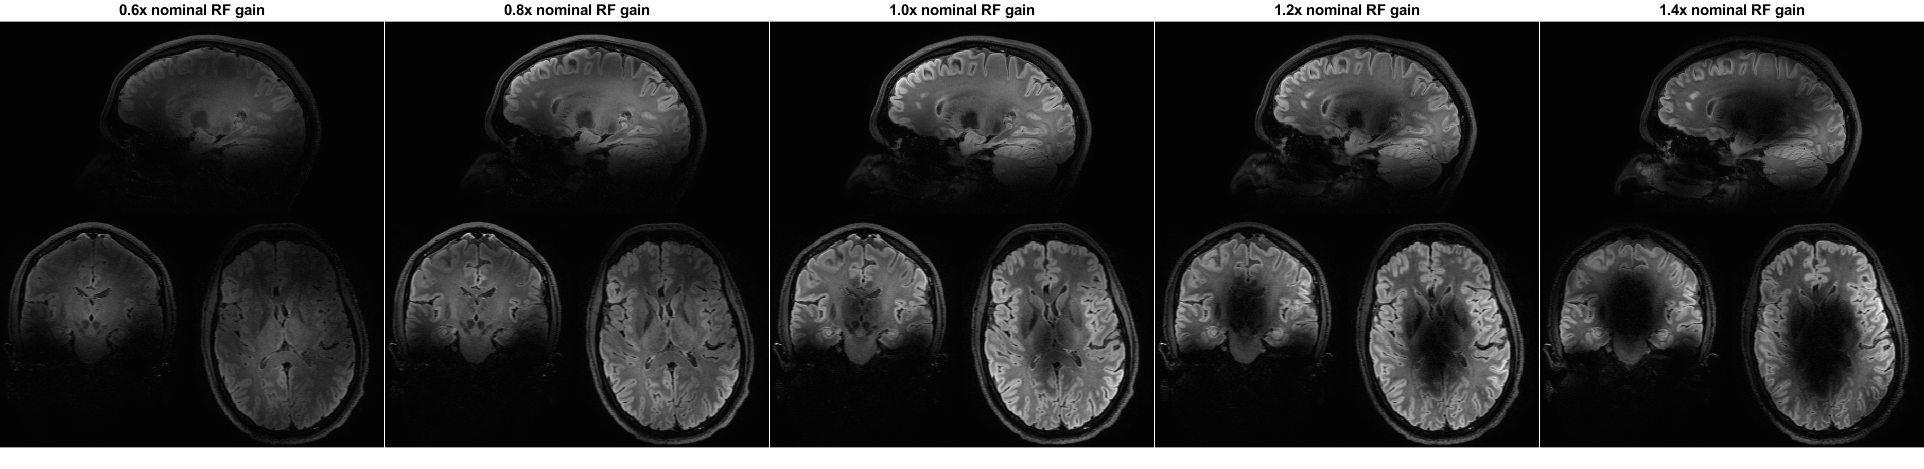
Figure 3:
5 repetitions of an MP-FLAIR scan with different
RF gains (0.6 – 1.4). For low RF gains, only the mid brain (where B1+ is
relatively large) experience close to nominal flip-angles. For RF gains higher
than 0.8, the mid brain shows as hypo-intense due to flip-angles being larger
than the nominal flip-angle. The lower occipital lobe (where B1+ is relatively
small), show as hypo-intense for all but the highest RF gain, where it
experiences close to nominal flip angles and shows as hyper-intense, due to the
surrounding tissue experiencing higher than nominal flip-angles.
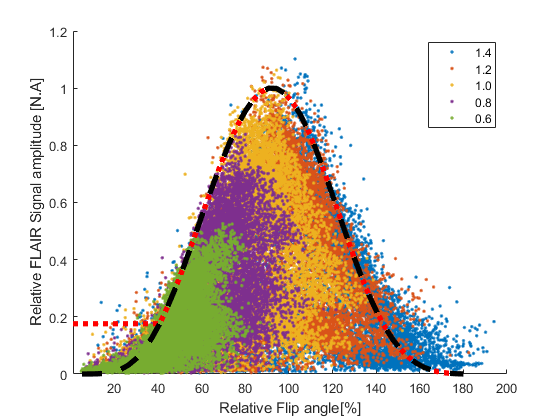
Figure 4:
Simulated versus
measured dependency of MP-FLAIR image intensity to B1+. Dots: Measured MP-FLAIR intensities as a function of measured
DREAM B1+. Colors depict different RF gains. Other sources of signal loss
(e.g. B1-/B0, fluid-content) cause
the measured intensities to “fill out” the area under the curve.
Black line: Simulated FLAIR intensities. Increasing discrepancy
between simulation and measurements is seen below 60% and above 140% of B1+, which is ascribed to inherent bias in the measured B1+.
Red line: The MP-FLAIR
dependency to B1+ used for bias-field correction.
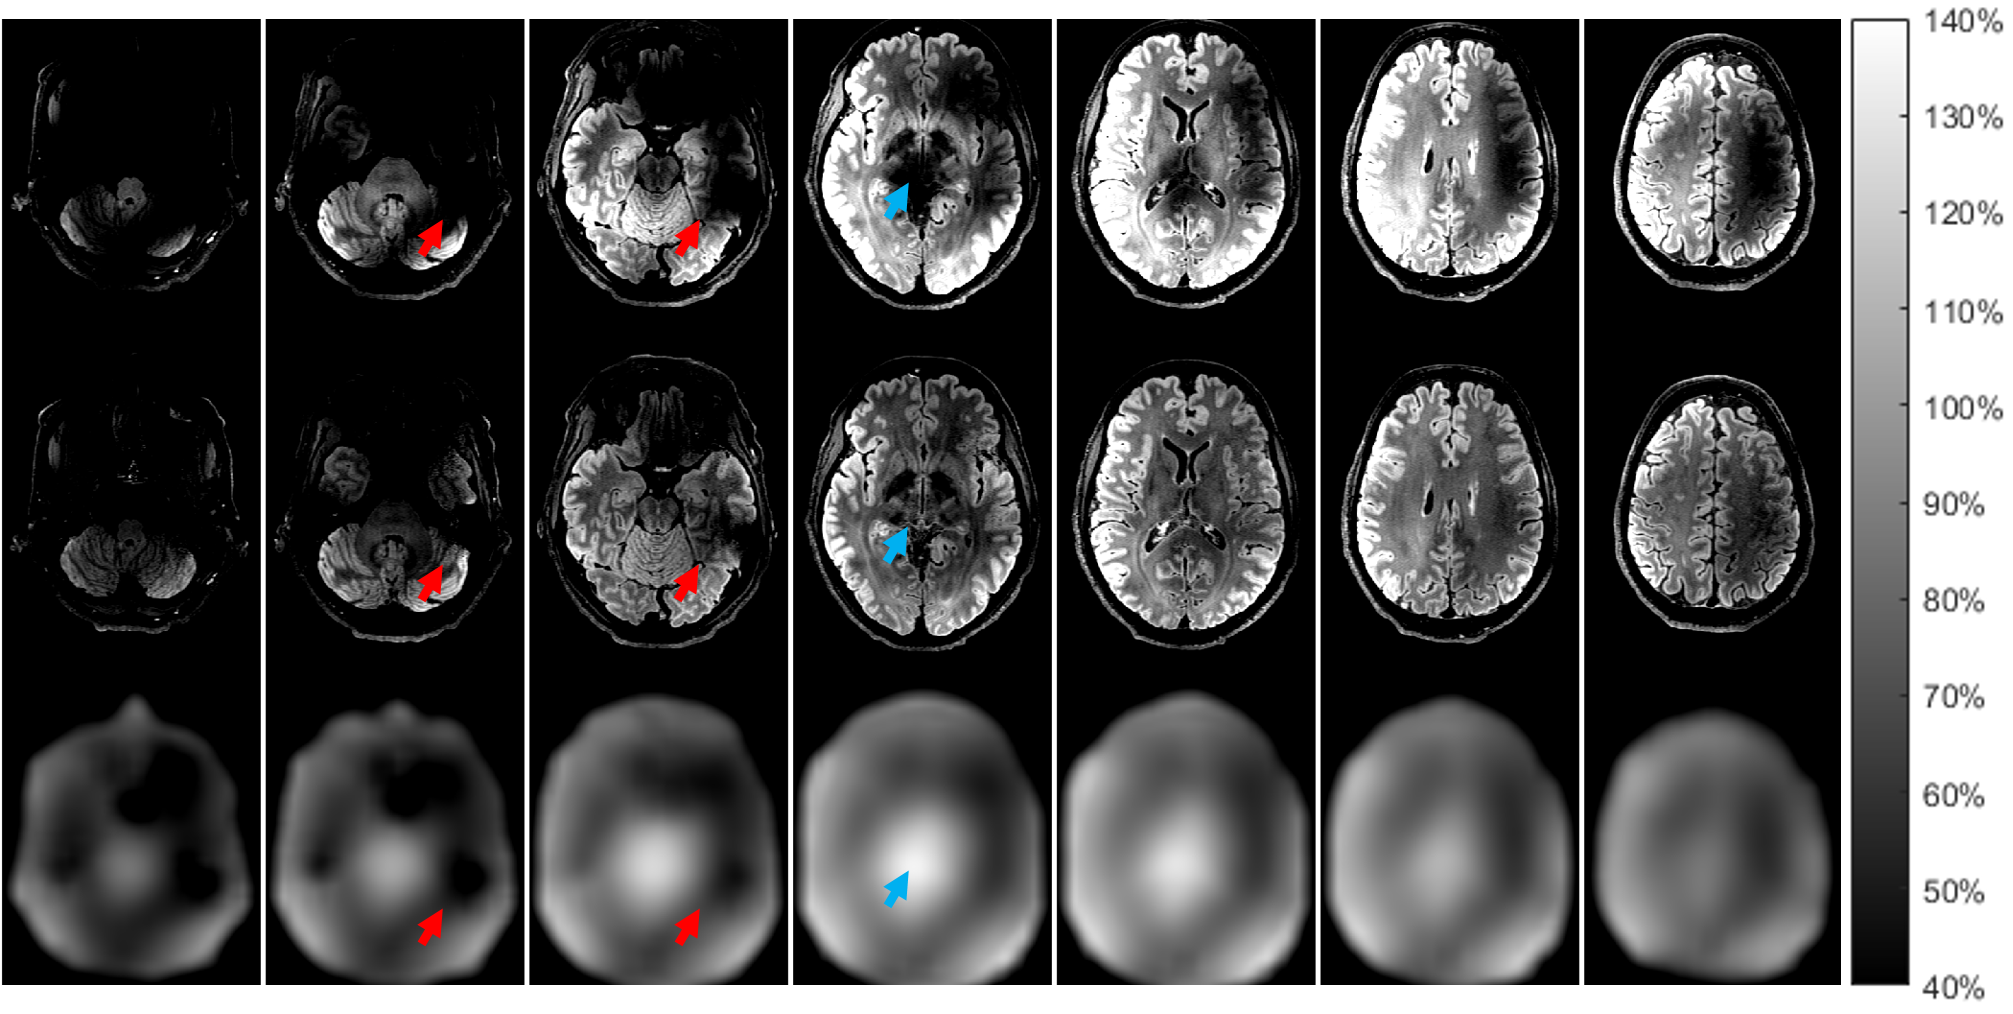
Figure 5:
Axial slices of a FLAIR image before (top), and
after (mid) bias-field correction. The MP-FLAIR images are depicted with
identical scaling. The intensity scale refers to percentage of B1+ by the measured DREAM map (bottom). While
the bias-field correction addresses B1+ induced intensity loss in the MP-FLAIR
images, SNR and WM/GM contrast remain uncorrected. Hypo-intensity due to a
large B1+ (blue arrow) appears completely accounted
for. Hypo-intensities due to low B1+ (exemplified at red arrows) is partially
accounted for and will remain appearing dark in low SNR areas.