3553
Application of Voxel Spread Function Method for Correction of Magnetic Field Inhomogeneity at 7T1electrical and computer engineering, auburn university, auburn, AL, United States, 2radiology, Washington university school of medicine in St. Louis, St. Louis, MO, United States
Synopsis
Imaging in ultra-high field (7T and above) has pros and cons as compared with 3T. The pros are increases in SNR and frequency shifts that helps in separating the available biophysical compartments in the brain. Con is the increased effect of magnetic field inhomogeneity on T2* that renders the quantification unreliable. Therefore, the field correction methods are critical for ultra-high field quantitative T2* mapping. We have demonstrated the application of Voxel Spread Method, a post-processing technique, to addresses this issue at 7T. F-term correction significantly reduces magnetic field inhomogeneity effects for quantitative T2* mapping.
Introduction
Ultra-high field (7T and above) MRI scanners are becoming more common and offer higher SNR and resolution but suffer from increased macroscopic magnetic field inhomogeneity artifacts. GRE pulse sequence and T2* contrast has become an important tool at high field imaging because of the SAR limitations of spin-echo pulse sequence [1]. Accurate knowledge of T2* relaxation time in brain tissue is important as it can be used to identify the sources of local magnetic field inhomogeneity such as myelin, calcium or iron deposition [2-5]. Proper compensation for macroscopic magnetic field inhomogeneity is important, especially at high fields, for quantitative and reproducible T2* estimation. Numerous methods have been proposed to deal with this problem [5-7]. Voxel Spread Function (VSF) methods is a post-processing technique that addresses this issue and has been successfully demonstrated with promising results on the 3T MRI scanners [8, 9]. It is the core processing algorithm in Gradient Echo Plural Contrast Imaging (GEPCI) technique which allows one to generate simultaneous co-registered images with T2*, T1, local frequency and Susceptibility-Weighted Imaging (SWI) contrasts. Successful implementation of this technique at 7T will enable detailed investigations of brain structure at high resolution. The aim of this work is to demonstrate the feasibility of VSF method at 7T. Here we show the feasibility of correcting for the background field inhomogeneities at 7T MRI as well as the possibility to create naturally co-registered multiple contrast images from high resolution 3D gradient echo scan.Methods
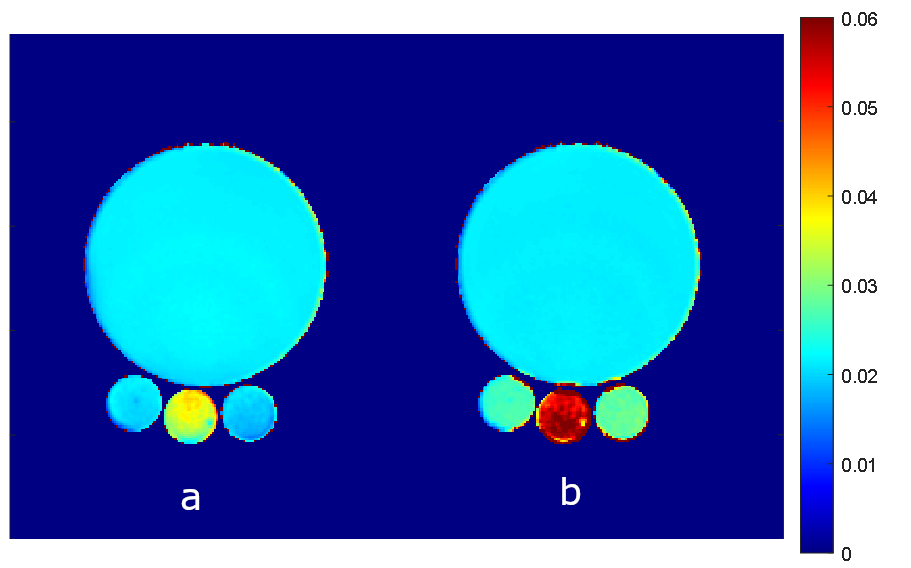
All the experiments were performed with Siemens 7T Magnetom with 32 channel head coil. The feasibility of the technique was first validated in a phantom designed to create magnetic field inhomogeneity and results compared with SE pulse sequence (Figure 1). Large phantom consists of nickel chloride doped saline solution. The smaller outer tubes consist of 4% agarose and the center tube consists of 2% agarose in saline. This arrangement creates magnetic field inhomogeneities within the tubes. The study was then conducted in 8 healthy control subjects. Images were acquired with the following parameters: in-plane resolution of 1×1x1 mm3, TR = 30 ms, 11 gradient echo images were acquired with TE(0) = 1.95 ms and echo spacing of 2.63 ms. Raw data was transferred to a workstation and VSF method implemented in MATLAB (MathWorks, Natick, MA) was used for processing as described before [9]. The VSF approach calculates F-function from multi gradient echo phase images to determine the contribution of the magnetic field inhomogeneity on the signal decay. This F-function is then used to eliminate/reduce the effect of magnetic field inhomogeneity in T2* calculations.Results
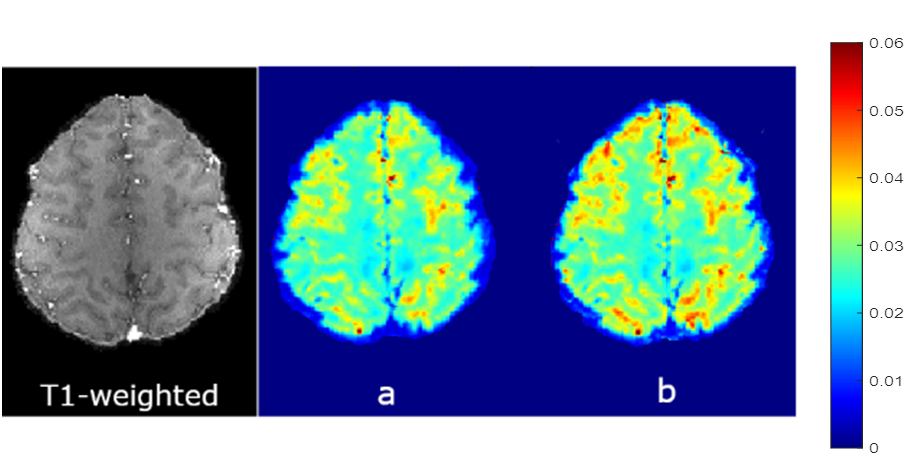
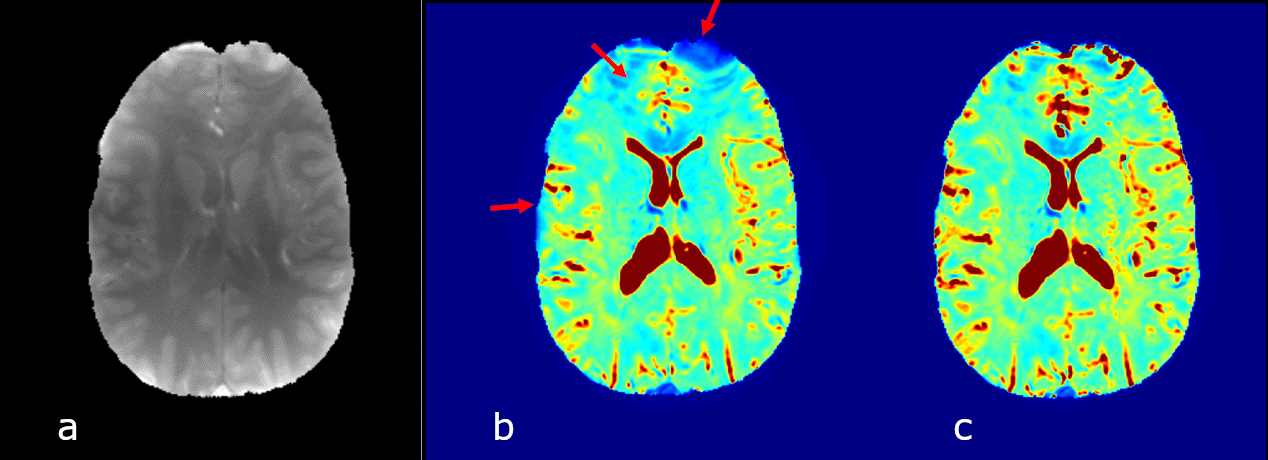
Results for the phantom experiment are shown in Figure 1. T2* in the middle tube without accounting for background field correction is 41.6±6.5 ms and increased to 53.2 ± 2.1 ms with F-term correction. The outer tube T2* changed from 21.3±2.0 ms (without) to 26.1 ± 0.7 ms (with) F-term correction. T2* value after correction are comparable to the true T2* value (~ 50 ms for the central tube and ~25 ms for the side tubes). Figure 2 shows the in vivo experiment results. The T2* value in general is increased after background field inhomogeneity correction and the the method was able to enhance gray/white matter (GM/WM) contrast. GEPCI also generates simultaneous co-registered images such as T1-weighted image as shown in figure 2. Figure 3 shows sample images from a different subject with flip angle 7° to generate co-registered proton density image. In addition to improving the estimate of gray and white matter T2* contrast the F-term correction significantly reduces magnetic field inhomogeneity artifacts in the regions marked with arrows.Discussion and Conclusion
The presence of background field inhomogeneities affects quantitative estimates of the T2* value. By applying proper background field inhomogeneity correction, the true values of T2* can be achieved. As it is shown in this work, the VSF method in GEPCI imaging is effective in the 7T MRI scanner. In the phantom study, the true value of T2* was achieved after correction. The technique is able to sharpen the T2* maps in gray and white matter and has the potential to recover T2* values in regions of significant magnetic field inhomogeneity. Applications such as myelin water imaging and iron quantification can benefit from this approach at ultra-high field (7T and above). This findings may become useful while imaging white matter especially for patients diagnosed with MS and other neurodegenerative diseases. This technique at ultra-fields will not only enable us to get an increased SNR or improve spatial resolution but it also allows us to achieve increased frequency shifts that may help to reliably separate biophysical compartments in the brain tissue.Acknowledgements
We appreciate helpful discussions from Dr. Ronald Beyers with data acquisition and analysis.References
[1] Chavhan, Govind B et al. “Principles, techniques, and applications of T2*-based MR imaging and its special applications.” Radiographics : a review publication of the Radiological Society of North America, Inc vol. 29,5 (2009): 1433-49. doi:10.1148/rg.295095034
[2] Liu, Tian et al. “A novel background field removal method for MRI using projection onto dipole fields (PDF).” NMR in biomedicine vol. 24,9 (2011): 1129-36. doi:10.1002/nbm.1670
[3] Haacke, E Mark et al. “Susceptibility weighted imaging (SWI).” Magnetic resonance in medicine vol. 52,3 (2004): 612-8. doi:10.1002/mrm.20198
[4] Lee, Jongho et al. “Mechanisms of T2 * anisotropy and gradient echo myelin water imaging.” NMR in biomedicine vol. 30,4 (2017): 10.1002/nbm.3513. doi:10.1002/nbm.3513
[5] Ferdinand Schweseret al. Differentiation between diamagnetic and paramagnetic cerebral lesions based on magnetic susceptibility mapping. Medical Physics, 37(10):5165–5178, 2010
[6] Hongfu Sun and Alan H Wilman. Background field removal using spherical mean value filtering and tikhonov regularization. Magnetic Resonance in Medicine, 71(3):1151–1157, 2014
[7] Dong Zhou, et al. Background field removal by solving the laplacian boundary value problem. NMR in Biomedicine, 27(3):312– 319, 2014
[8] Luo, Jie et al. “Gradient echo plural contrast imaging--signal model and derived contrasts: T2*, T1, phase, SWI, T1f, FST2*and T2*-SWI.” NeuroImage vol. 60,2 (2012): 1073-82. doi:10.1016/j.neuroimage.2012.01.108
[9] Yablonskiy, Dmitriy A et al. “Voxel spread function method for correction of magnetic field inhomogeneity effects in quantitative gradient-echo-based MRI.” Magnetic resonance in medicine vol. 70,5 (2013): 1283-92. doi:10.1002/mrm.24585
[10] Wen, Jie et al. “Fast library-driven approach for implementation of the voxel spread function technique for correcting magnetic field inhomogeneity artifacts.” (2020) https://arxiv.org/abs/2001.09400
Figures