3552
Characterizing the acquisition protocol dependencies of B0 field mapping and the effects of eddy currents and spoiling1Martinos Center for Biomedical Imaging, Charlestown, MA, United States, 2Department of Radiology, Harvard Medical School, Boston, MA, United States, 3Boston Children’s Hospital, Boston, MA, United States, 4Qbio Inc., San Carlos, CA, United States, 5Division of Health Sciences and Technology, Massachusetts Institute of Technology, Cambridge, MA, United States
Synopsis
Maps of the B0 field are routinely used for MRI scanner calibration and for post-processing corrections of geometric distortions. However, several sources of bias are present in conventional field estimates, which will result in uncorrected image artifacts, yet it is unclear what the magnitude of these biases are, whether these are large enough to warrant concern, and how to reduce these errors to extract more accurate field estimates. Here we investigate the accuracy of the standard B0 field map acquisition, demonstrate that the estimated fields vary with several acquisition parameters, and investigate sources of these errors.
Introduction
B0 fieldmaps are routinely used both for scanner calibration to improve spatial uniformity of the B0 field and for correcting distortions due to spatial inhomogeneity of susceptibility [1-5]. Imaging readouts such as EPI—used in functional, diffusion, perfusion and, increasingly, in anatomical [6], ultra-high field (7 Tesla) and clinical [7] imaging—are particularly vulnerable to artifacts due to nonuniform B0 fields, and conventional imaging readouts at higher resolutions. However, several sources of bias corrupt conventional field estimates, and it is unclear what the magnitude of these biases are, whether these are large enough to warrant concern, and how to extract accurate field estimates. Here we investigate the accuracy of the standard two-echo B0 fieldmap acquisition, demonstrate that the estimated fields vary with several acquisition parameters indicating protocol-specific biases, and investigate sources of these errors. Specifically, we evaluate the dependence on TE, TR, flow compensation and fat saturation, and evaluate if these artifacts are attributable to either eddy currents or incomplete spoiling.Method
Data were acquired using a clinical 7T MRI scanner on an anthropomorphic agar-gel phantom and on two healthy volunteers (with written informed consent). Fieldmaps were acquired using the standard two-echo gradient-echo-based acquisition, which acquires one line of k-space per excitation [8]. We acquired fieldmaps after sweeping several acquisition parameters:- Multiple TRs (211 ms, 500 ms, 850 ms, 3000 ms) with TE of 10 ms
- Multiple TEs (10 ms, 30 ms, 50 ms) with TR of 850 ms
- Repeated 1. and 2. with reversed phase-encode (PE) and frequency-encode (FE) gradient directions.
- Reversed slice-select (SS) gradient directions, similar to our previous method [5].
- Flow compensation on and off.
- Fat saturation on and off
Results
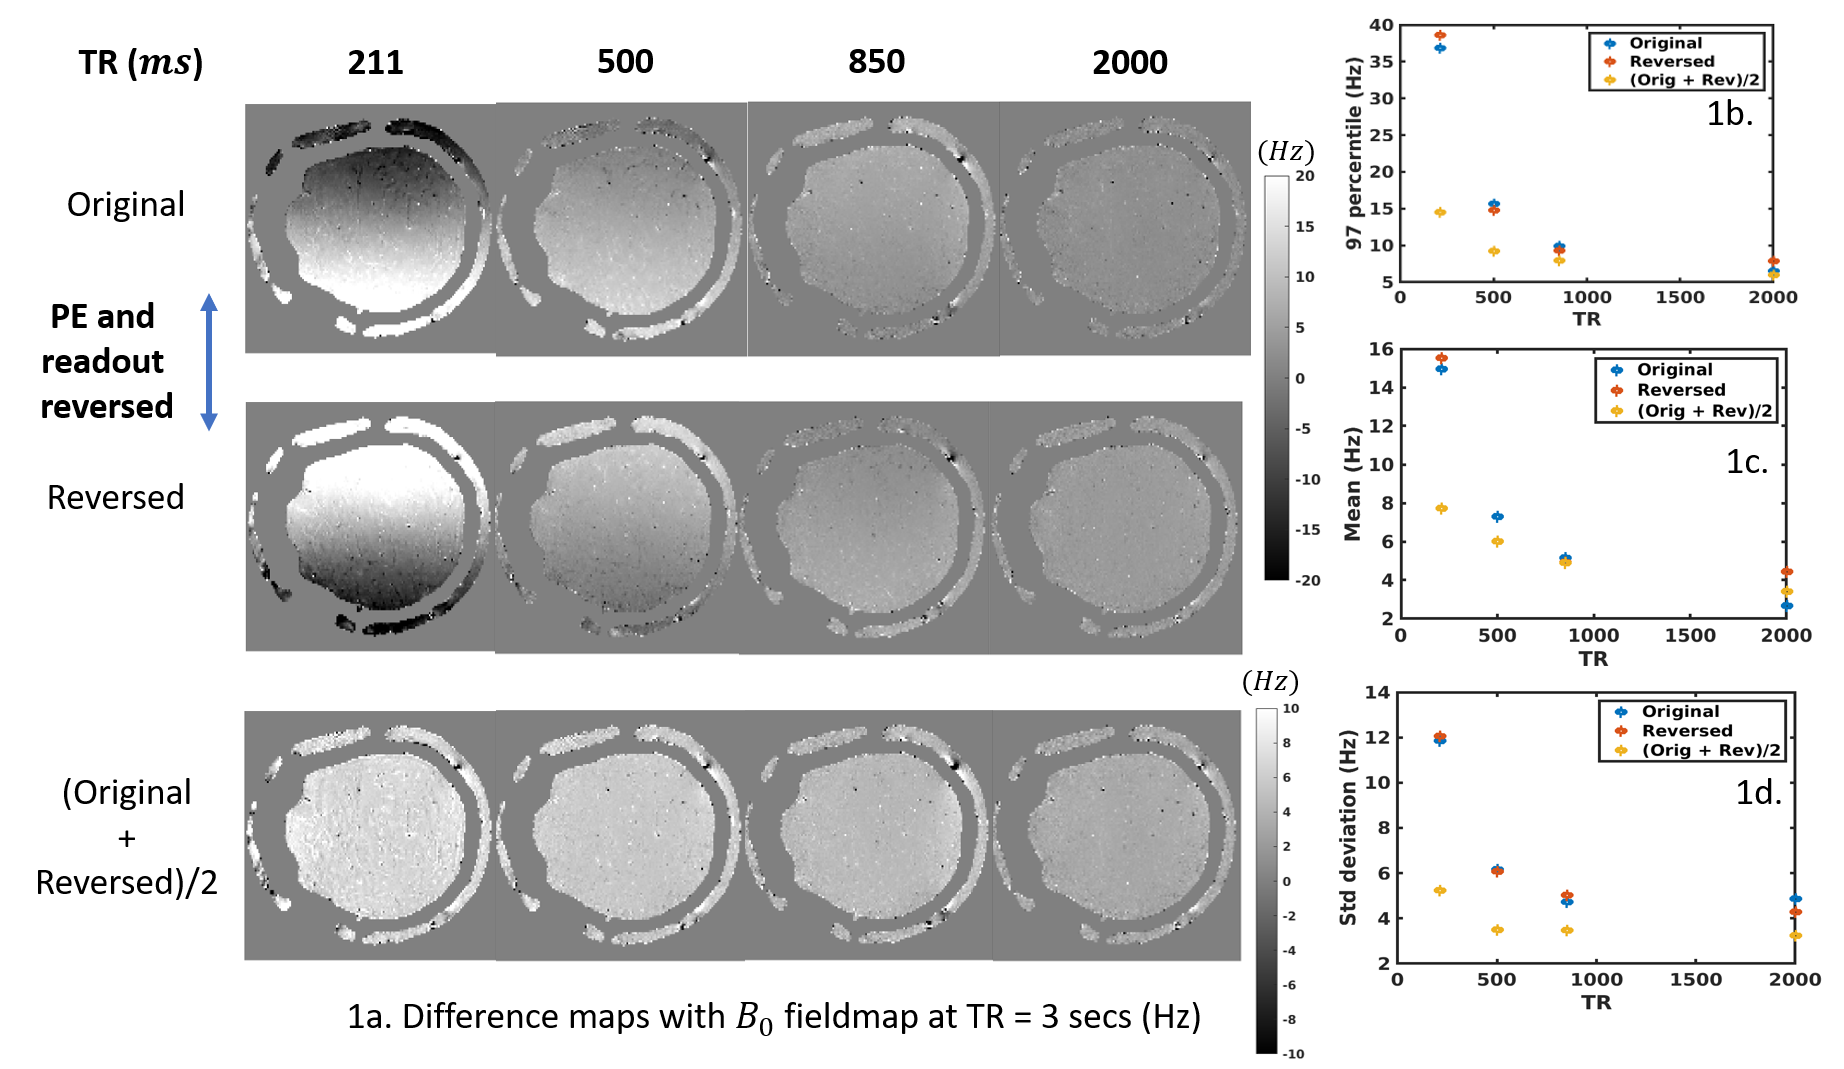
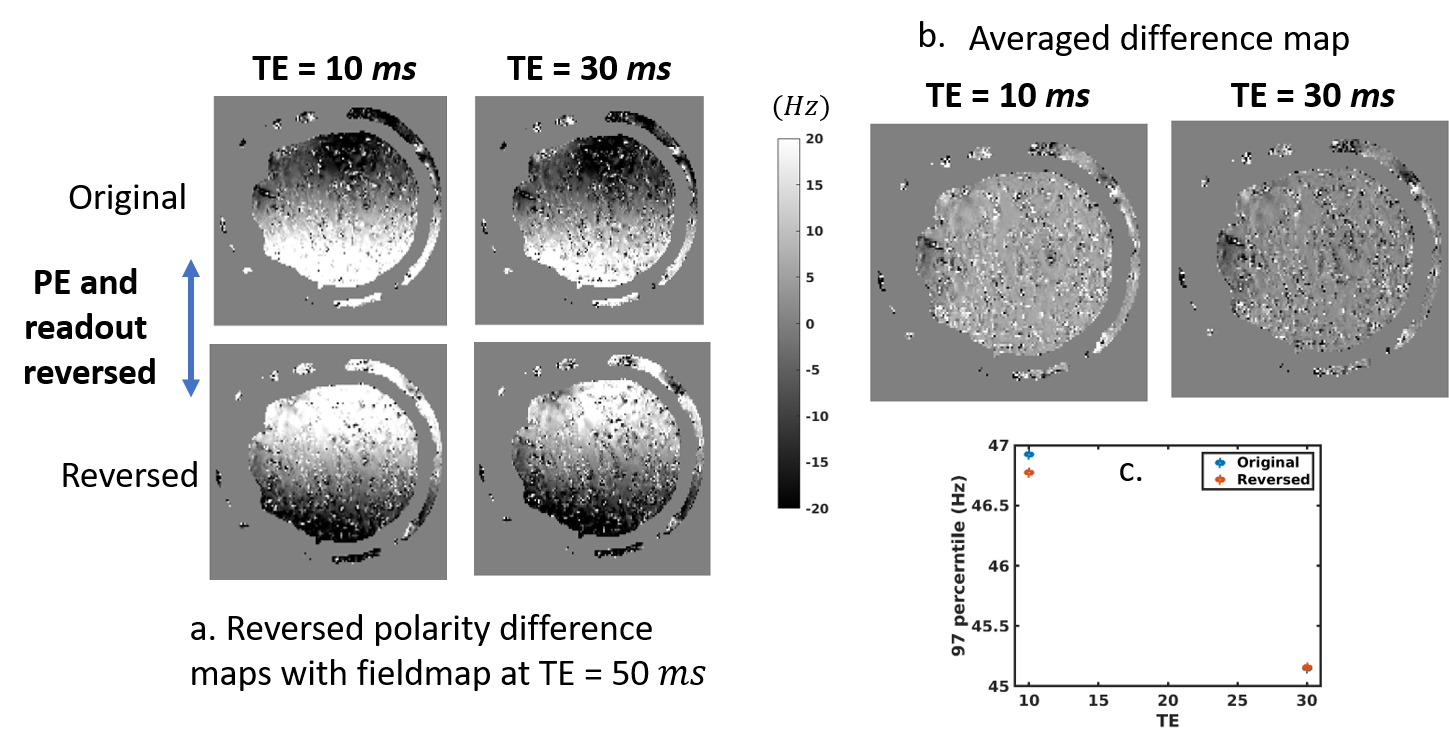
TR variation: Figure 1a rows 1-2 show the difference between fieldmaps at several TRs and the 3-sec TR fieldmap, for both gradient directions. Row 3 shows the fieldmap generated from summing the PE/FE reversed data, which cancels much of the spatial nonuniformity, suggesting that this was due to short-term eddy currents from these image-encoding gradients, however TR variation remains. Figures 1b-1d present the statistics of the absolute differential error. Fieldmaps show a bias of upto 39.8 Hz at 211 ms TR, reducing to ~12 Hz after PE/FE eddy current cancellation.TE variation: Figure 2 shows fieldmaps across multiple TEs, relative to the 50 ms TE fieldmap. Fig. 2a shows the reversed PE/FE polarities, while Fig. 2b shows the variation of the averaged fieldmap. All difference maps show variation in TE which is reduced after averaging.
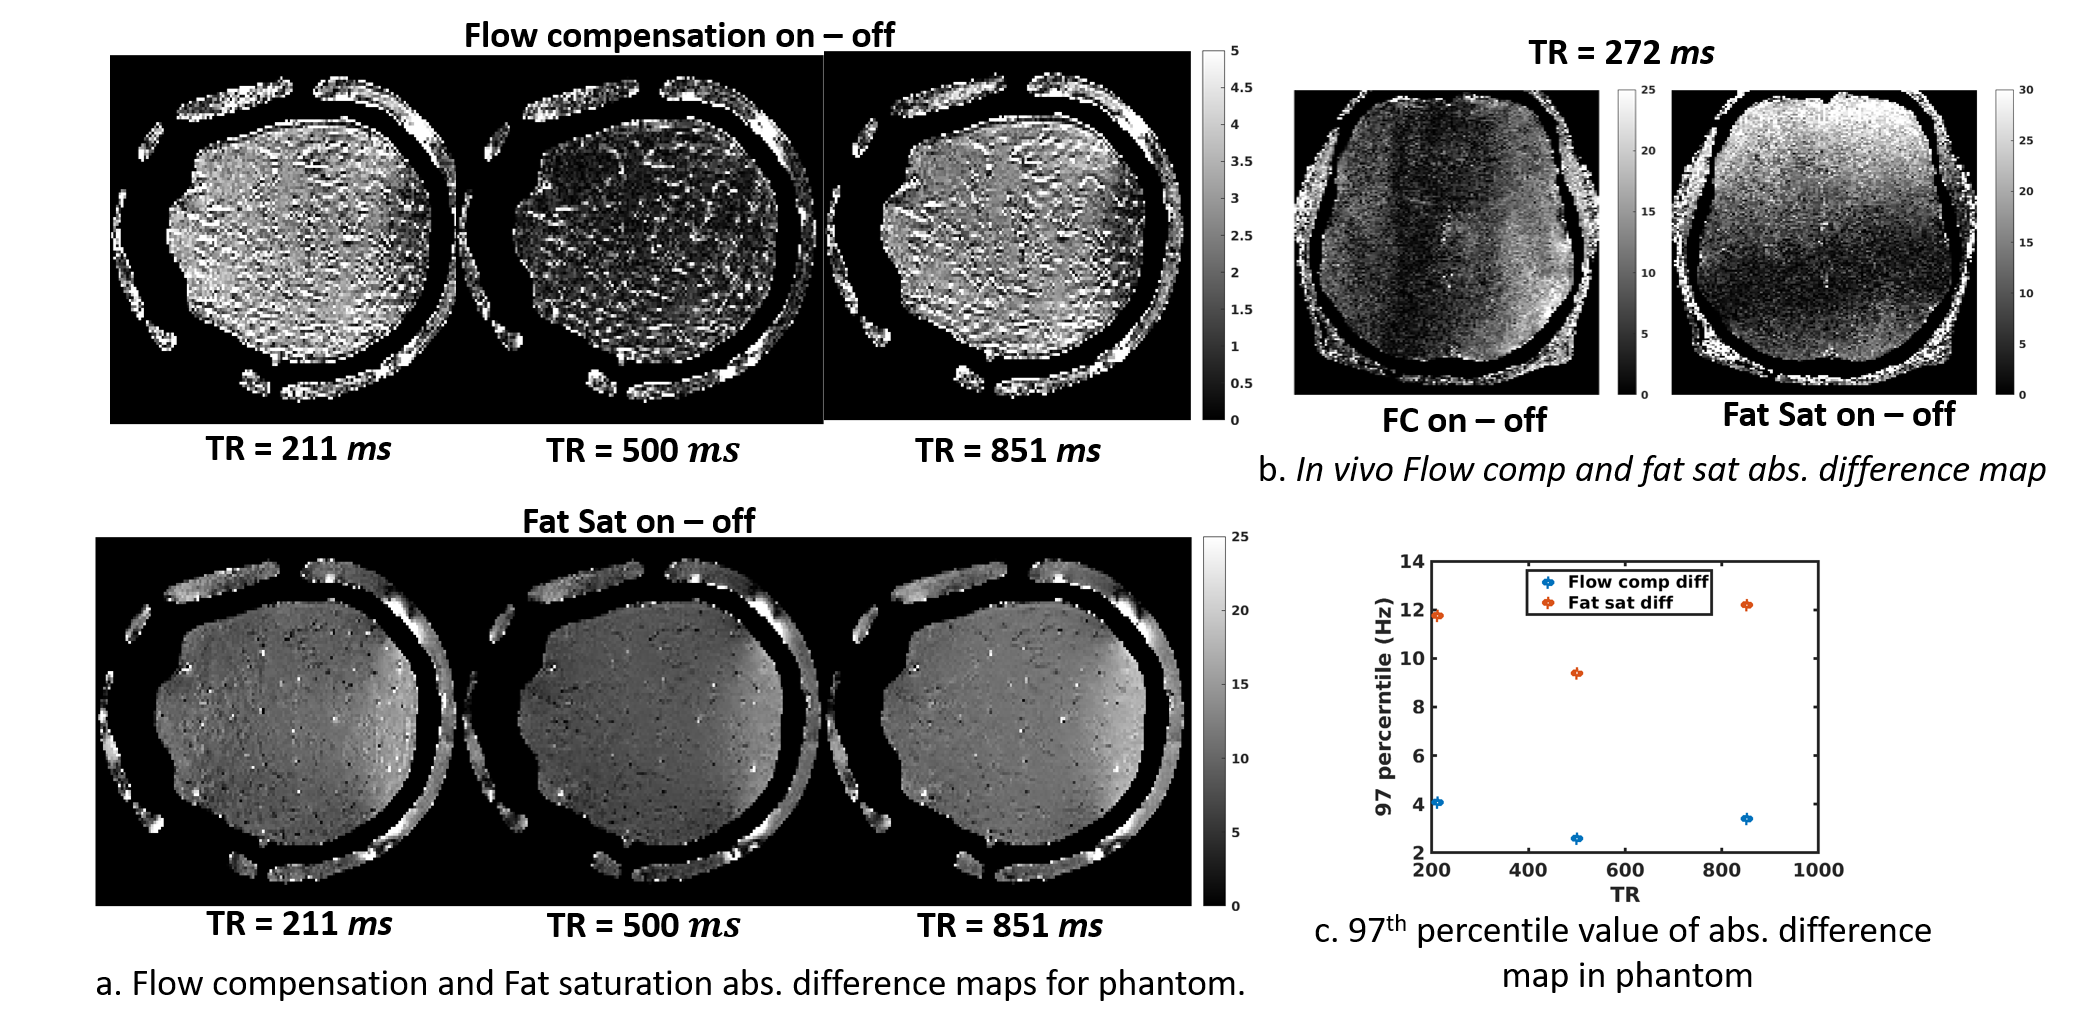
Flow compensation and Fat sat: Figure 3a shows the difference maps in a phantom when flow compensation (FC) and fat saturation (FS) are switched on and off for multiple TRs. FC and FS difference does not show TR decreasing trend. The in-vivo result shows bias amounting to 25–30 Hz, which aligns with our phantom measurements. The 12 Hz residual thus could not be explained by these parameters.
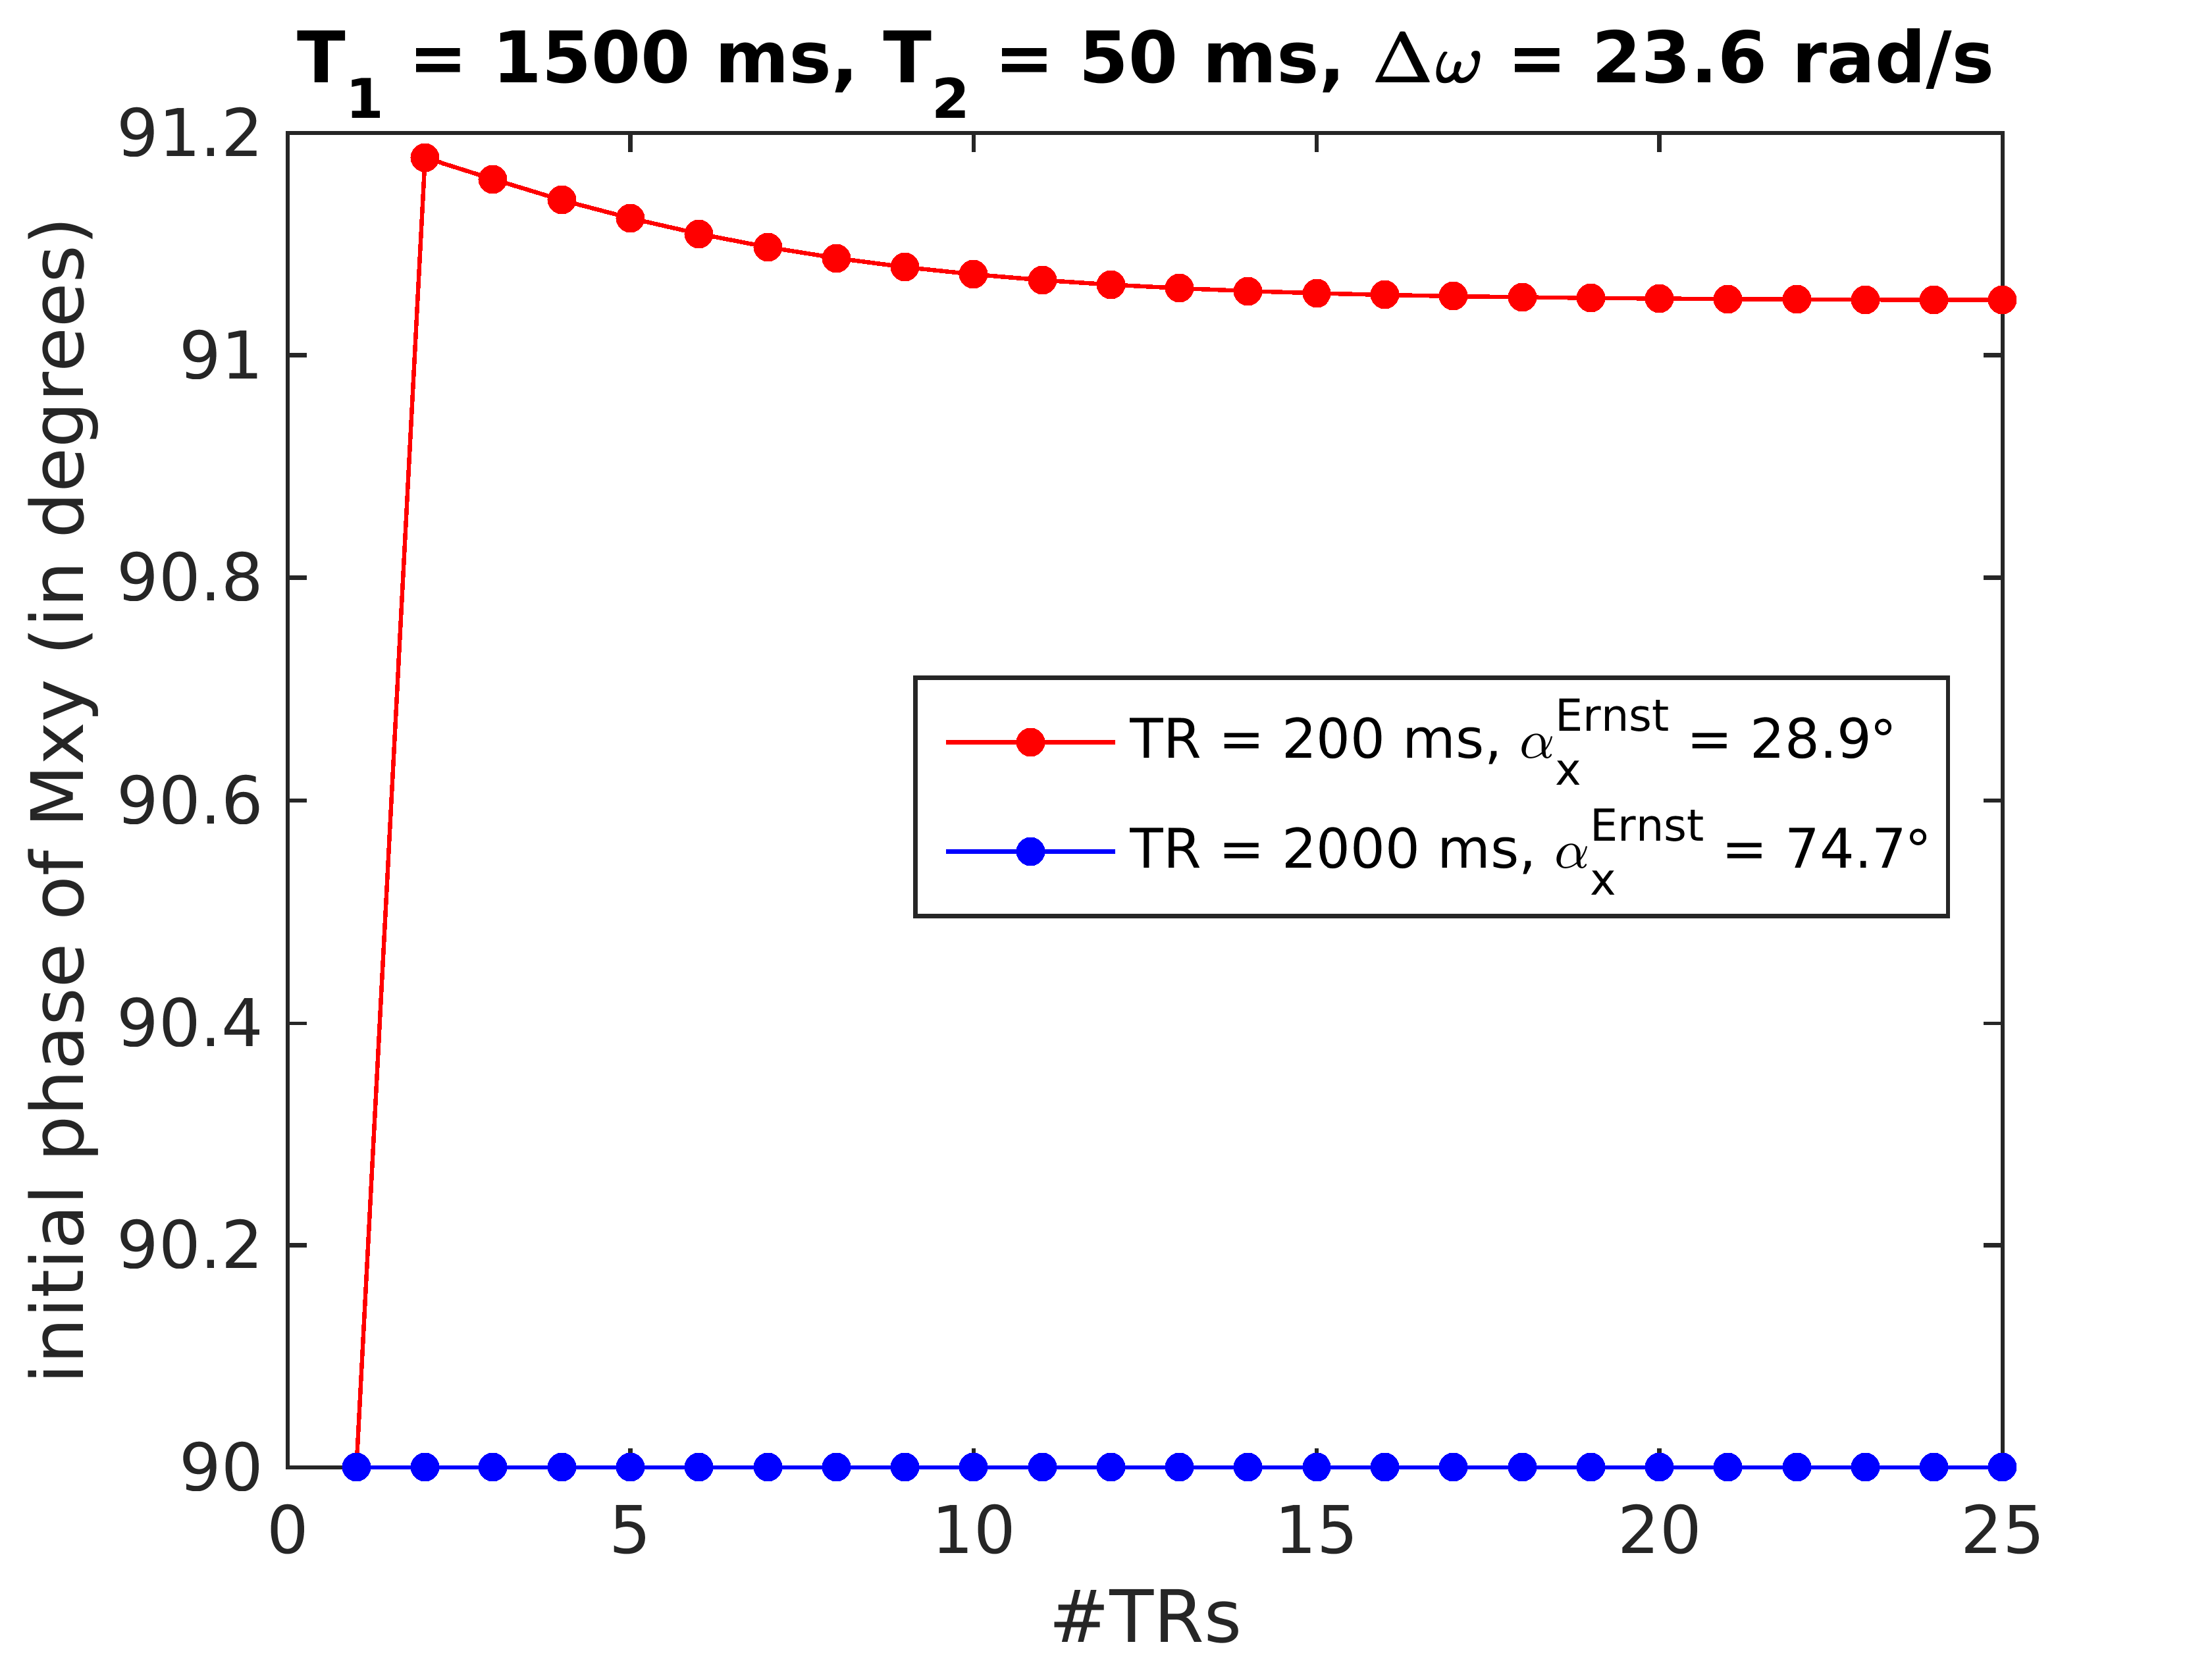
Investigating spoiling via Bloch simulations: Figure 4 plots the phase immediately after RF excitation assuming T1=1500 ms and T2=50 ms (for brain parenchyma at 7T), for TRs of 200 and 2000 ms. The phase stabilizes after a few excitations, suggesting that spoiling is unlikely to cause TR-dependent bias. Few dummy scans could remove any errors occurring in the approach to steady state.
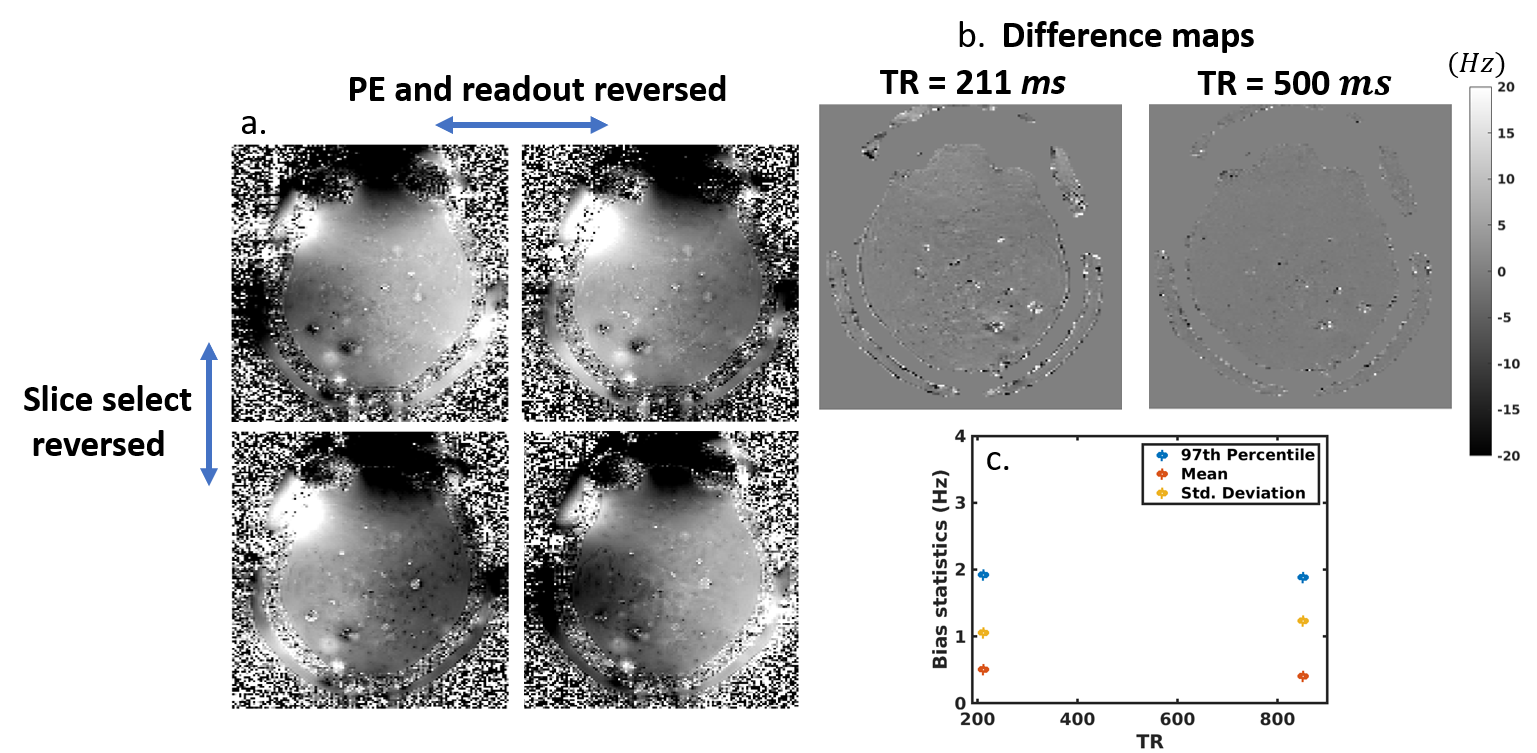
Slice select gradient: Lastly, we tested whether variations are due to long-term eddy currents caused by the SS gradient. Figure 5a. plots the reversed-polarity fieldmaps with PE, FE, and SS directions reversed. Remaining fieldmap nonuniformity is canceled by averaging these data. Figure 5b. shows the post-correction difference maps with fieldmap at TR=851 ms. We observe no TR variation, mean bias of 0.5 Hz and 97th percentile bias of ~2 Hz. Therefore, we conclude that most of the 12-Hz residual was due to long-term eddy currents from the SS gradients.
Discussion and Conclusion
Here we disentangled contributors to fieldmap inaccuracy on a modern 7T scanner. We identified both short-term and long-term eddy current bias, with the SS gradient contributing to the TR dependence. We ruled out incomplete spoiling as a contributor to the errors. The presence of eddy current errors in fieldmaps suggests that either similar gradients to the imaging acquisition of interest, such as EPI-based fieldmaps [1], or steps similar to those performed here are necessary for accurate fieldmap estimates. Distortion correction approaches that combine data-driven correction with a soft fieldmap constraint may be best to compensate for low accuracy [9].Acknowledgements
We thank Mr. Kyle Droppa for help with scanning, and Drs. Yulin Chang and John Kirsch for helpful discussions. This work was supported in part by the NIH NIBIB (grants P41-EB030006 and R01-EB019437), the NIH NIMH (grant R01-MH124004), by the BRAIN Initiative (NIH NIMH grants R01-MH111419, U01-EB026996 and U01-EB025162), and by the MGH/HST Athinoula A. Martinos Center for Biomedical Imaging; and was made possible by the resources provided by NIH Shared Instrumentation Grant S10-OD02363701.References
[1] Reese TG, Davis TL, Weisskoff RM. Automated shimming at 1.5 T
using echo-planar image frequency maps. J Magn Reson Imaging.
1995;5(6):739-745. PMID: 8748496.
[2] Dymerska B, Poser BA, Bogner W, Visser E, Eckstein K, Cardoso
P, Barth M, Trattnig S, Robinson SD. Correcting dynamic distortions in 7T echo
planar imaging using a jittered echo time sequence. Magn Reson Med.
2016;76(5):1388-1399. PMID: 26584148.
[3] Reber PJ, Wong EC, Buxton RB, Frank LR. Correction of off
resonance-related distortion in echo-planar imaging using EPI-based field maps.
Magn Reson Med. 1998;39(2):328-330. PMID: 9469719.
[4] In M-H, Speck O. Highly accelerated PSF-mapping for EPI
distortion correction with improved fidelity. Magn Reson Mater Physics, Biol
Med. 2012;25(3):183-192. PMID: 21814756.
[5] Błażejewska AI, Witzel T, Wald LL, Polimeni JR. Correction of
EPI geometric distortion in slice direction using reversed slice-select
gradients and topup. Proc Intl Soc Mag Reson Med. 2017:1650.
[6] Skare S, Sprenger T, Norbeck O, Rydén H, Blomberg L, Avventi E,
Engström M. A 1-minute full brain MR exam using a multicontrast EPI sequence.
Magn Reson Med. 2018;79(6):3045-3054. PMID: 29090483.
[7] Prakkamakul S, Witzel T, Huang S, Boulter D, Borja MJ,
Schaefer P, Rosen B, Heberlein K, Ratai E, Gonzalez G, Rapalino O. Ultrafast
Brain MRI: Clinical Deployment and Comparison to Conventional Brain MRI at 3T.
J Neuroimaging. 2016;26(5):503-510. PMID: 27273370.
[8] Bernstein MA, King KF, Zhou XJ. Handbook of MRI Pulse
Sequences. Academic Press; 2004.
[9] Varadarajan D, Frost R, van der Kouwe A, Morgan L, Diamond B,
Boyd E, Fogarty M, Stevens A, Fischl B, Polimeni JR. Edge-preserving B0
inhomogeneity distortion correction for high-resolution multi-echo ex vivo MRI
at 7T. International Society for Magnetic Resonance in Medicine. 2020 p.664.
Figures