3549
Suppressing the ballistocardiography artifacts on EEG collected inside MRI using the dynamic modeling on heartbeats1Physical Sciences Platform, Sunnybrook Research Institute, Toronto, ON, Canada, 2Department of Medical Biophysics, University of Toronto, Toronto, ON, Canada, 3Department of Epilepsy, Neurological Institute, Taipei Veterans General Hospital, Taipei, Taiwan, 4School of Medicine, National Yang-Ming University, Taipei, Taiwan, 5Brain Research Center, National Yang-Ming University, Taipei, Taiwan, 6Department of Neurosurgery, Neurological Institute, Taipei Veterans General Hospital, Taipei, Taiwan, 7Institute of Neuroscience, National Yang-Ming University, Taipei, Taiwan, 8Department of Neuroscience and Biomedical Engineering, Aalto University, Espoo, Finland
Synopsis
We developed the dynamic modeling of heartbeats (DMH) method to suppress the ballistocardiography (BCG) artifacts on the electroencephalography (EEG) data collected inside MRI. DMH estimates the instantaneous EEG signals at specific phases in the cardiac cycle by combining EEG signals at those phases in other cardiac cycles showing similar dynamic features. Using both simulations and empirical data at 3T, we demonstrated that the DMH approach can suppress the BCG artifacts more efficiently than Optimal Basis Set (OBS) method in both epilepsy and steady-state visual evoked potential data.
Introduction
Ballistocardiogram (BCG) is a major source of pulse artifacts on the EEG measurements collected inside an MRI scanner. BCG is the EEG signal attributed to heartbeats related motions of EEG sensors in a strong static magnetic field 1. Concurrent yet asynchronous occurrences of BCG reduce the sensitivity and specificity of the detection of the EEG signals of interest. The size of BCG scales with the field strength of MRI 2,3. The need of suppressing BCG from the EEG collected inside MRI is more pressing in high field applications.Current template-based BCG artifact suppression methods 1,4,5 do not consider the variations in heartbeat frequency, EEG shape, and EEG amplitudes and suffer from out-of-phase artifact subtraction, systematic errors, and large residuals 6-8. Data-driven components-based approaches 9-12 require the heuristic categorization of the decomposed components as either “signal” or “noise”. This may reduce the stability in BCG artifact suppression 11,13.
Here we propose a dynamic modeling of heart (DMH) method, which was motivated by the causal modeling method 14, to suppress BCG artifacts on EEG collected inside MRI. DMH estimates the instantaneous EEG signals at specific phases in the cardiac cycle by combining EEG signals at those phases in other cardiac cycles showing similar dynamic features. We demonstrate the performance of DMH using both simulations and empirical data by comparing to the results from the Optimal Basis Set (OBS) method 10.
Methods
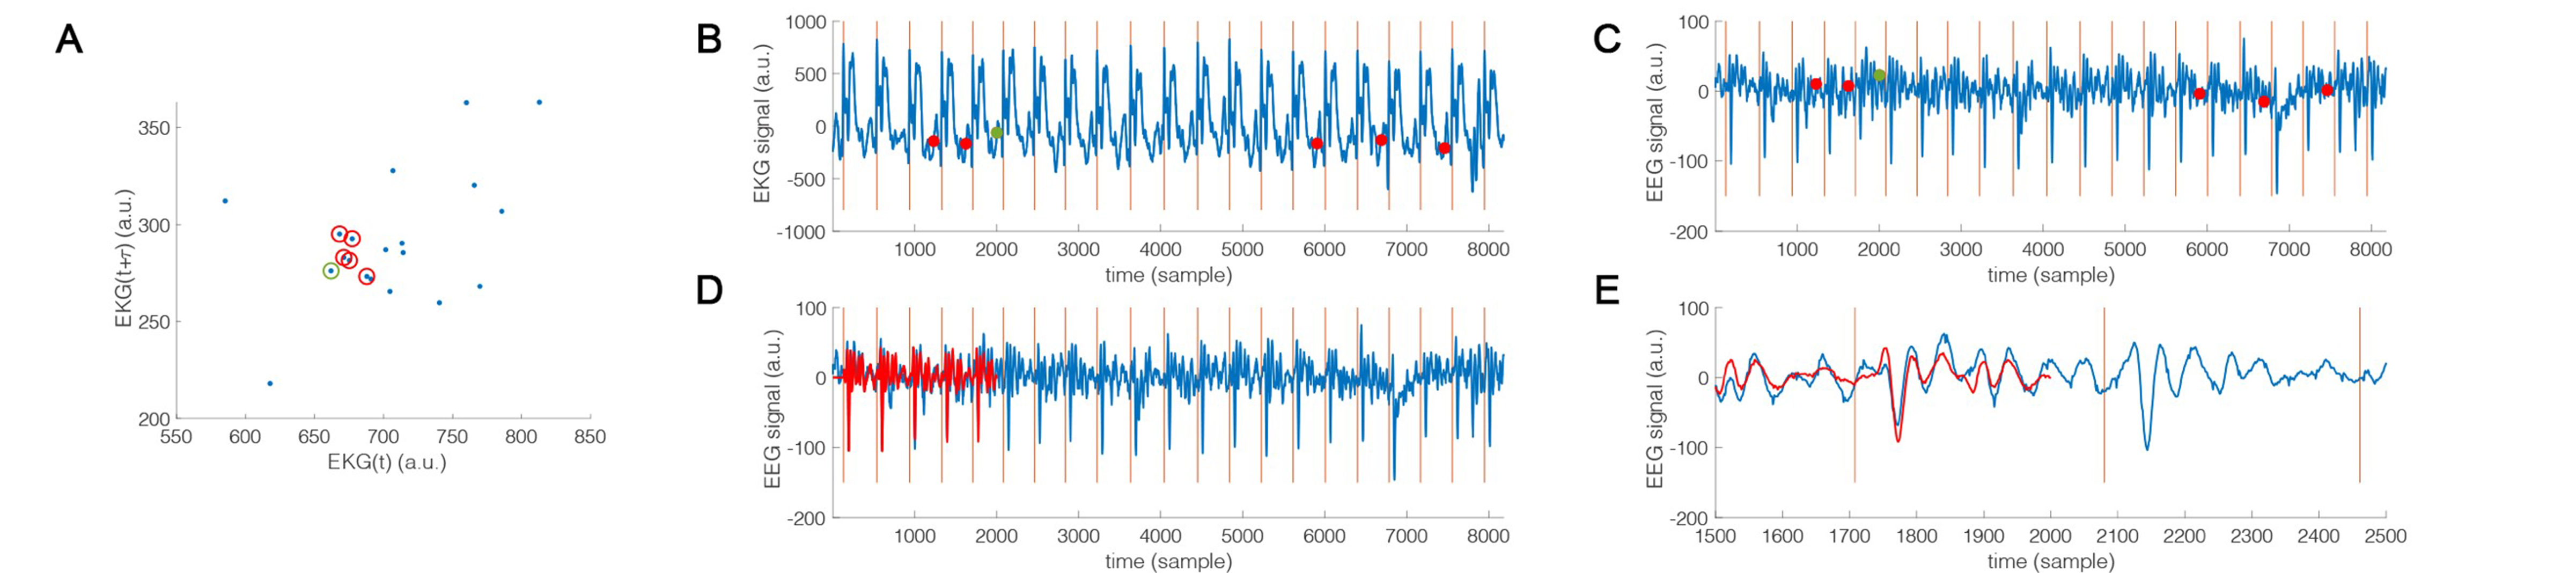
DMH measures the similarity between EKG signals at time instants with the same cardiac cycle phase. Similarity was taken as the inverse of the Euclidean distance between their representations on a manifold created by the EKG waveform at multiple time lags with respect to each QRS peak. EEG signals at the same cardiac phase with high similarity in EKG dynamics were used to interpolate the EEG recording at the instant of interest. The difference between the predicted and measured EEG recordings was taken as the noise-suppressed EEG signal. Figure 1 illustrates the procedure of building a two-dimensional manifold to model the dynamics of heartbeats and seeking five nearest neighbors in the dynamics to approximate the EKG with BCG artifacts.The DMH was applied to suppress the BCG artifacts in a steady-state visual evoked potential (SSVEP) experiment. Checker board patterns flashing at the rate of 7.5 Hz were shown to participants to elicit 15-Hz SSVEP. EEG data were acquired with interleaved simultaneous multi-slice inverse imaging (SMS-InI) and EEG (SMS-InI-EEG) 15 or inside the 3T MRI scanner (Skyra, Siemens) without any MRI acquisition (Inside-MRI). EEG was measured by an MR-compatible system with a 32-channel EEG cap (BrainAmp MR Plus, Brain Products). The EEG was sampled at 5 kHz and synchronized with the onset of each MR acquisition volume10,16. Maps of SSVEP in the brain were estimated by the minimum-norm estimate using realistic head models 17.
We also performed simulations to study the performance of DMH in identifying epileptic spikes. Specifically, an EEG spike template was created from the EEG of an epilepsy patient taken outside the MRI. Detected inter-ictal spikes (IIS) were temporally aligned to their peaks and then averaged to generate an IIS template. Subsequently, the IIS template was numerically added to the resting-state EEG waveforms, which were 10-minute resting-state EEG waveforms acquired using with interleaved SMS-InI-EEG 15 or continuous EPI-EEG on a healthy participant, at 60 random instants.
Results
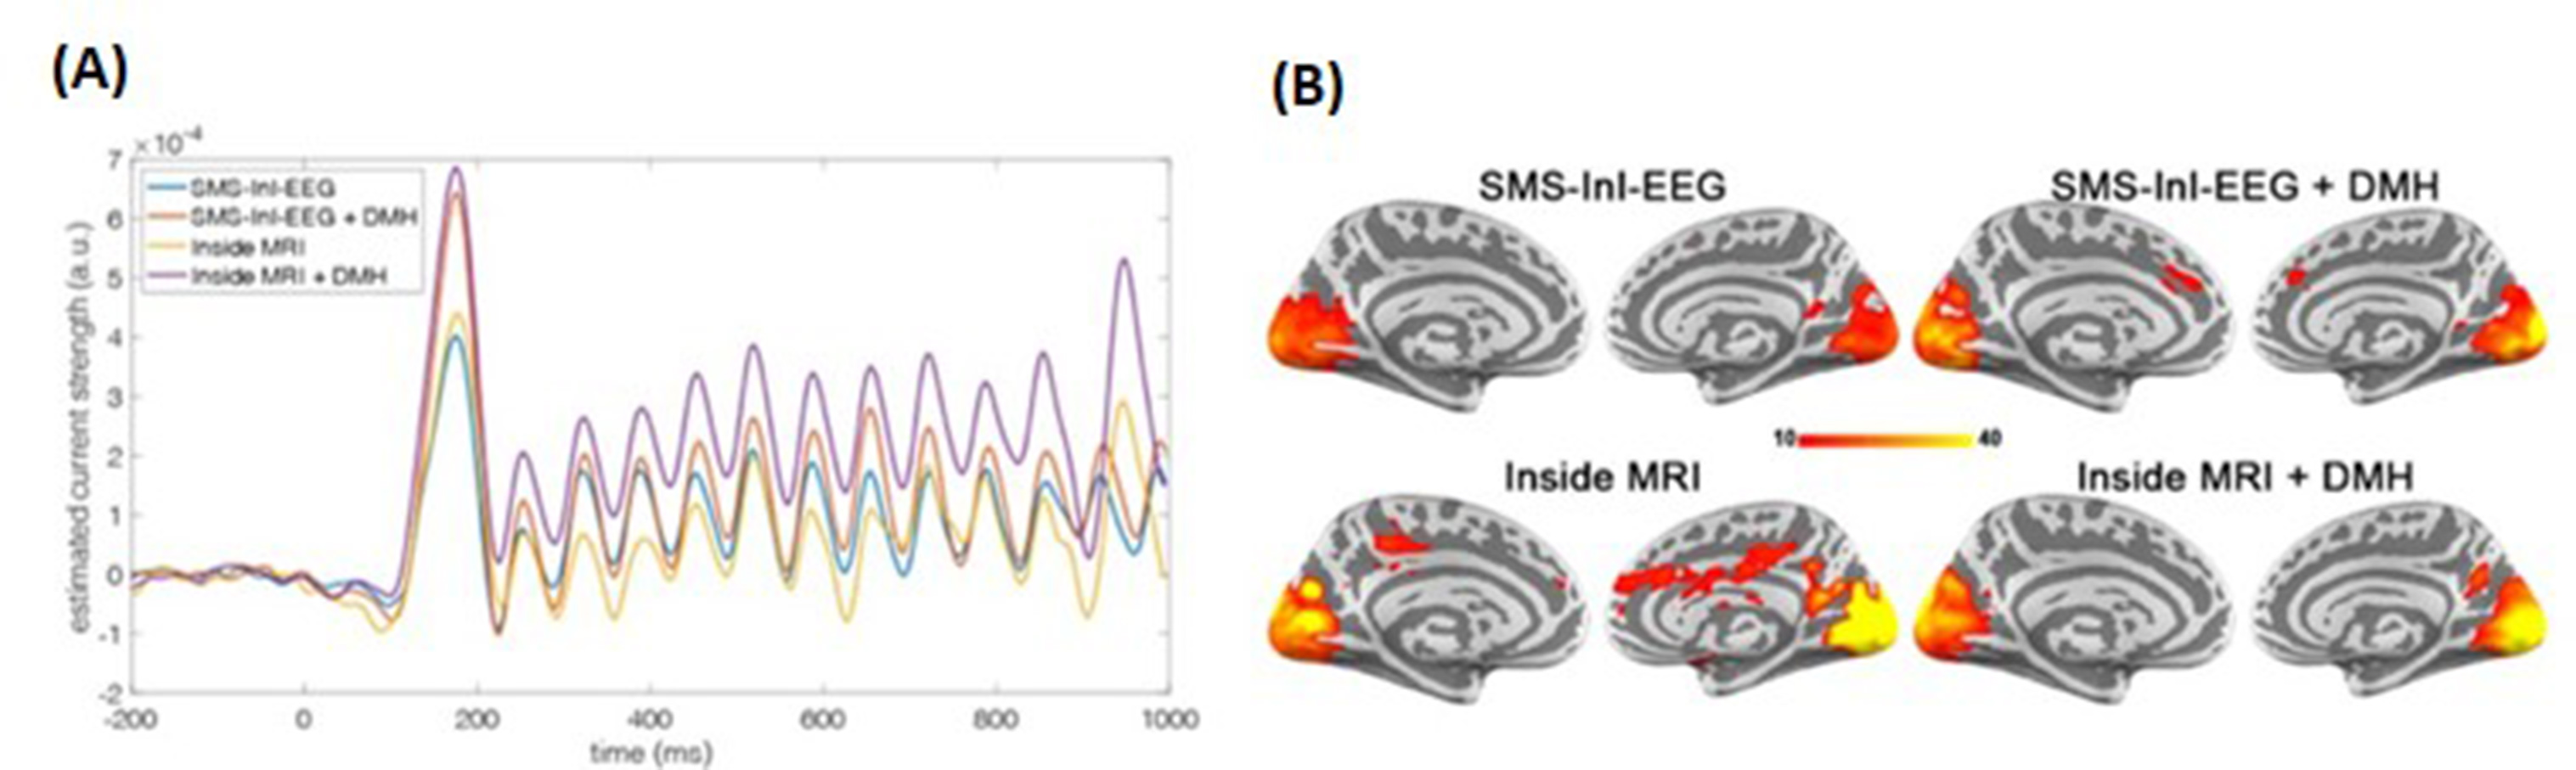
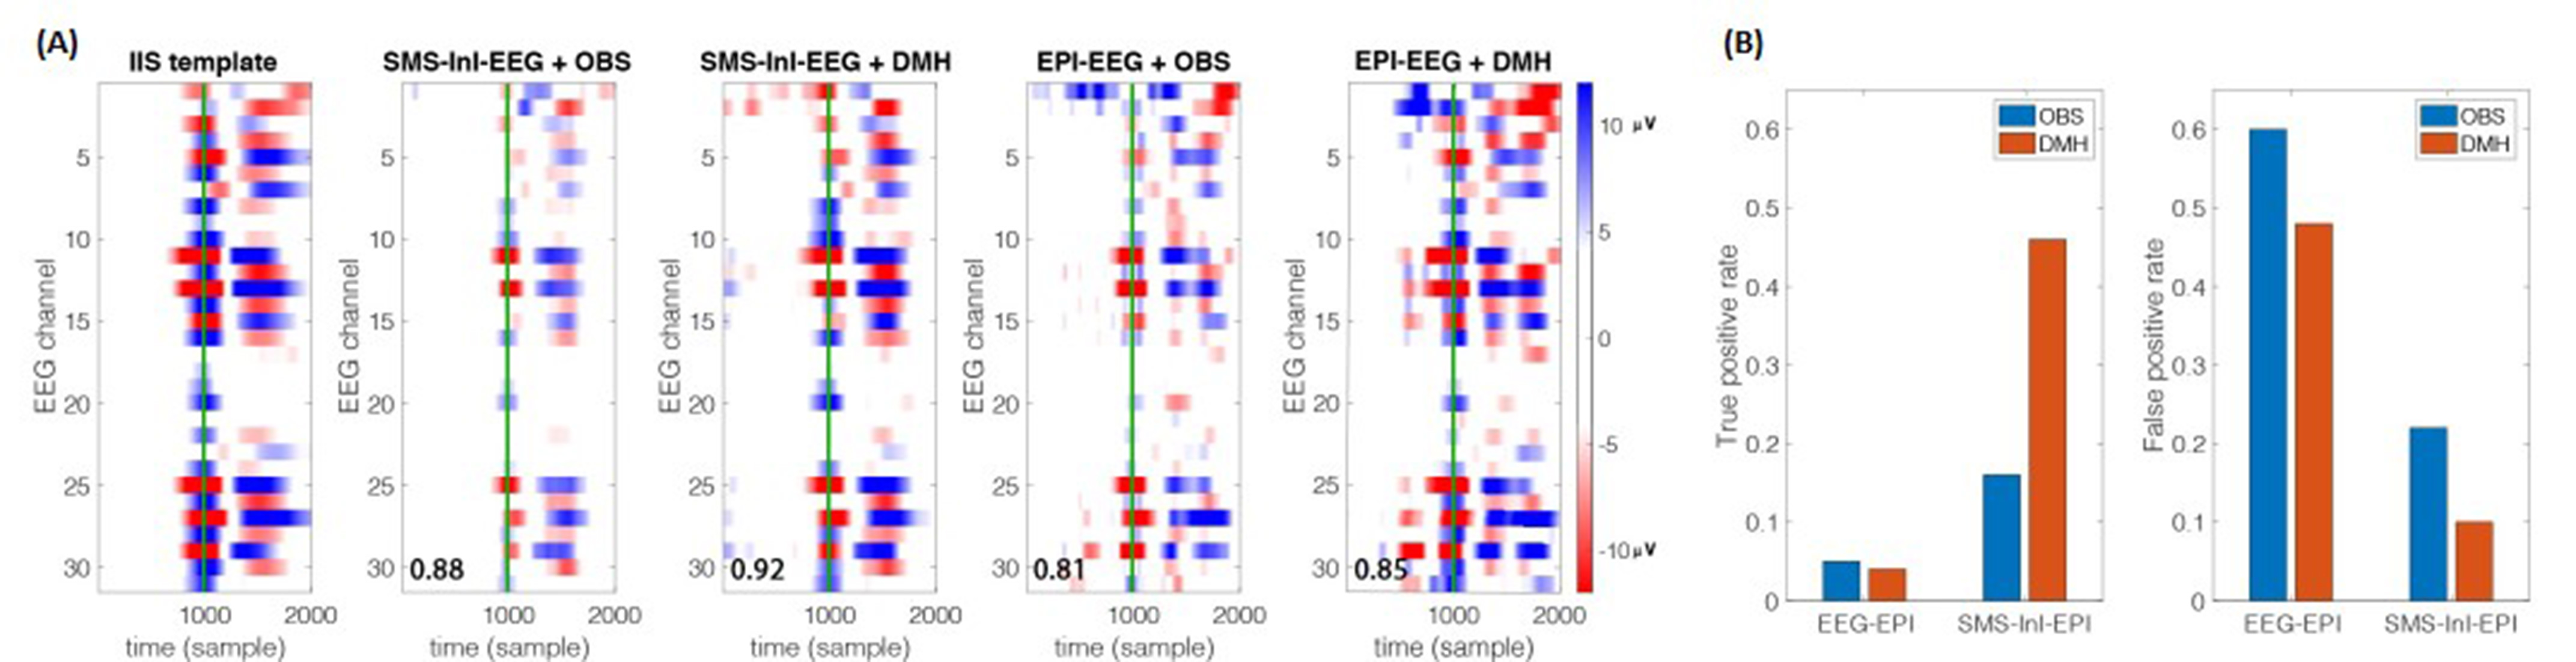
EEG time courses at the visual cortex after DMH gave stronger transient (~200 ms after the stimulus onset) and 15-Hz SSVEP (between 300 ms and 1000 ms after the stimulus onset) responses than OBS in both inside-MRI and SMS-InI-EEG conditions (Figure 2A). The spatial distribution of the 15-Hz oscillation power ratio with respect to the pre-stimulus baseline was also stronger within the visual cortex in both Inside-MRI (OBS: 5.24+/-0.64; DMH: 16.19+/-2.41) and SMS-InI-EEG (OBS: 11.43+/-1.10; DMH: 13.17+/-1.06) conditions when DMH was used (Figure 2B).Figure 3A shows the simulated IIS template and the averaged EEG data across 60 simulated IIS occurrences using SMS-InI-EEG and EPI-EEG using either OBS or DMH for BCG suppression. Overall, SMS-InI-EEG produced results that were more similar to the IIS template than those from EPI-EEG. DMH provided a more similar IIS pattern than OBS in both EPI-EEG and SMS-InI-EEG. Figure 3B shows the true and false positive rates of detecting IIS using the simulated data from three doctors. SMS-InI-EEG showed 2- to 3-fold improvement over EPI-EEG. SMS-InI-EEG with DMH gave the highest true positive and the lowest false positive rate among the four method combinations.
Discussion
Using both simulations and empirical data, we demonstrated that the DMH approach can suppress significantly more BCG artifacts on EEG collected in 3T MRI than the OBS method. The performance was tested in both epilepsy data (2- to 3-fold gain) and SSVEP data (20% to 300% gain). The performance of DMH likely depends on parameters of the dimension, latency between samples, and the number of neighbors in the dynamics manifold. The DMH approach is expected to be applied to suppress gradient artifact. The EEG data collected inside MRI with the field strength higher than 3T is expected to benefit more by DMH.Acknowledgements
This work was partially supported by the Academy of Finland (No. 298131), and the Natural Sciences and Engineering Research Council of Canada (RGPIN-2020-05927).References
1. Allen P. J., Polizzi G., Krakow K. et al. Neuroimage.1998; 8:229-239.
2. Debener S., Mullinger K. J., Niazy R. K. et al. Int J Psychophysiol.2008; 67:189-199.
3. Mullinger K. J., Havenhand J. & Bowtell R. Neuroimage.2013; 71:75-83.
4. Ellingson M. L., Liebenthal E., Spanaki M. V. et al. Neuroimage.2004; 22:1534-1542.
5. Sijbersa J., Van Audekerke J., Verhoye M. et al. Magn Reson Imaging.2000; 18:881-886.
6. Musso F., Brinkmeyer J., Ecker D. et al. Neuroimage.2011; 58:508-525.
7. Jorge J., Bouloc C., Brechet L. et al. Neuroimage.2019; 191:21-35.
8. Niazy R. K., Beckmann C. F., Iannetti G. D. et al. Neuroimage.2005; 28:720-737.
9. Benar C., Aghakhani Y., Wang Y. et al. Clin Neurophysiol.2003; 114:569-580.
10. Niazy R. K., Beckmann C. F., Iannetti G. D. et al. NeuroImage.2005; 28:720-737.
11. Nakamura W., Anami K., Mori T. et al. IEEE Trans Biomed Eng.2006; 53:1294-1308.
12. Srivastava G., Crottaz-Herbette S., Lau K. M. et al. Neuroimage.2005; 24:50-60.
13. Grouiller F., Vercueil L., Krainik A. et al. Neuroimage.2007; 38:124-137.
14. Sugihara G., May R., Ye H. et al. Science.2012; 338:496-500.
15. Lee H. J., Huang S. Y., Kuo W. J. et al. Neuroimage.2020; 217:116910.
16. Mullinger K. J., Castellone P. & Bowtell R. Journal of visualized experiments: JoVE.2013.
17. Lin F. H., Belliveau J. W., Dale A. M. et al. Hum Brain Mapp.2006; 27:1-13.
Figures