3546
A Survey of Faraday Cage Attenuation Measurements of Clinical MRI Systems
Francesco Padormo1, Joe Martin1, Jane Ansell1, Elizabeth Gabriel1, Laurence H. Jackson1, Caitlin O'Brien1, Simon Shah1, David Price1, and Geoff Charles-Edwards1
1Guy's & St Thomas' NHS Foundation Trust, London, United Kingdom
1Guy's & St Thomas' NHS Foundation Trust, London, United Kingdom
Synopsis
Manufacturers typically specify new MRI systems to have a minimum Faraday Cage (FC) attenuation of 90-100dB at the resonant frequency. Anecdotal observations have suggested that systems can operate successfully with FC attenuation levels below this specification. We present a survey of attenuation measurements across eleven systems in order to gain insight into realistic values on systems in routine clinical use.
Introduction
Faraday cages (FCs) are essential components of MRI systems, allowing images to be produced free from the characteristic ‘zipper’ artifacts which can arise from external sources of radiofrequency (RF) electromagnetic radiation, whilst also ensuring that radiation generated by MR systems is not radiated into the surrounding environment.When replacing or upgrading an MRI system, one of the decisions that must be made is whether to keep the existing RF cage or to replace it, with the latter option adding significant cost and time to the project. Scanner manufacturers typically require a minimum attenuation of 90-100dB at the resonant frequency, as confirmed by FC attenuation measurements performed in accordance with internationally recognised guidelines [1-3]. Consequently, for existing FCs that fail to meet the attenuation requirement the MRI manufacturer will typically advise the site to replace the cage, even if the existing MR system has operated without RF interference issues.
We present a survey of FC measurements acquired across eleven active MRI systems across multiple hospital sites (five within our institution, six external; ten 1.5T, one 3T) to provide normative data for clinical MRI systems. By additionally evaluating images acquired on institutional systems to establish the frequency of RF interference artifacts, we provide evidence to evaluate the risk of operating an MRI system with FC attenuation below those recommended by system manufacturers.
Methods
Measurements were performed according to IEEE 299-2006 [2] utilising four quarter-wave dipole antenna arms mounted onto two baluns (Com-Power Corporation, AD-100A) to construct two separate antennas. Each was placed on a tripod (Com-Power Corporation, AT-110) at equal heights and oriented parallel to each other and to the floor, and separated by a fixed distance of 2m. The antennas were tuned to the desired frequencies (corresponding to 1.5T, 3T and 7T) by adjusting the length of each arm (total antenna length at 65MHz: 2.3m; 128MHz: 1.2m; 297MHz: 0.5m). The designated transmitter was connected to a signal generator (AnaPico APSIN 3000HC) and amplifier (RF Lambda RAMP01M03GC) connected in series. The receiver was connected to a spectrum analyser (Rohde & Schwarz FSH4) to measure the received power (receive BW: 100Hz, video BW:1Hz, reference amplitude 10dBm, span 100kHz at 65 & 128MHz, span 20kHz at 296MHz). All equipment was calibrated on 8/2/2019.The decibel attenuation provided by a FC at frequency f is given by $$$A(f) = S_{FC}(f) - S_{ref}(f)$$$. Here, $$$S_{FC}(f)$$$ denotes the power transmission (in dBm) between two antennas with the FC present, and $$$S_{ref}(f)$$$ denotes the measured power transmission (in dBm) with all factors kept the same except for the removal of the FC. Reference values $$$S_{ref}(f)$$$ were taken as the average of two measurements acquired on consecutive days at an outdoor location distant from any neighbouring structures to minimise possible electromagnetic interference. RF power transmission through the FC $$$S_{FC}(f)$$$ was subsequently measured at typical locations of FC vulnerability – at the console room window, the magnet room door, and the penetration panel. The antennae and associated hardware were relocated to each test location with the transmitter outside of the room and the receiver within the FC.
FC attenuation measurements were acquired on eleven MRI systems (5 within our institution, 6 external).
Additionally, three experienced assessors (FP, JM, JA) examined a subset of images acquired on the 5 institutional systems (all 1.5T) to assess the regularity of RF zipper or spike artifacts. For each system, the ten most recent studies containing both gradient-echo localizers and diffusion-weighted imaging (specifically TRACE images) were examined qualitatively for RF related artefacts.
Results
The results are presented in Figures 1 and 2. The median attenuation for all frequencies and FC locations were below the 90-100 dB quoted by manufacturers. Taken across all sites and frequencies, the magnet door position demonstrated the lowest attenuations, followed by the window and penetration panel. Measurements at 297MHz demonstrated the lowest attenuations at all locations.Figure 3 displays the measured FC attenuation for all systems versus their year of installation. There is no clear correlation.
The review of images acquired on 1.5T systems within our institution discovered no images with RF interference.
Discussion
Clinical MR imaging without noticeable RF interference is routinely being carried out on scanners where the FC attenuation is lower than specified by MRI manufacturers. This suggests that new FCs may not necessarily be needed when upgrading an MRI system. As expected, magnet room doors were found to be a weak point. However, the results suggest that care is necessary for penetration panels of 7T systems.Future work will focus on expanding the image review, as well as investigating the effect of door maintenance (e.g. cleaning and replacing missing contact leaves).
Acknowledgements
FP and JM contributed equally to this work.References
[1] IEEE 299-2006 - IEEE Standard Method for Measuring the Effectiveness of Electromagnetic Shielded Enclosures
[2] ASTM D4935-18 - Standard Test Methods for Measuring the Electromagnetic Shielding Effectiveness of Planar Materials
[3] EN 50147-1 – CENELEC - Anechoic Chambers Part 1: Shield Attenuation Measurement
Figures
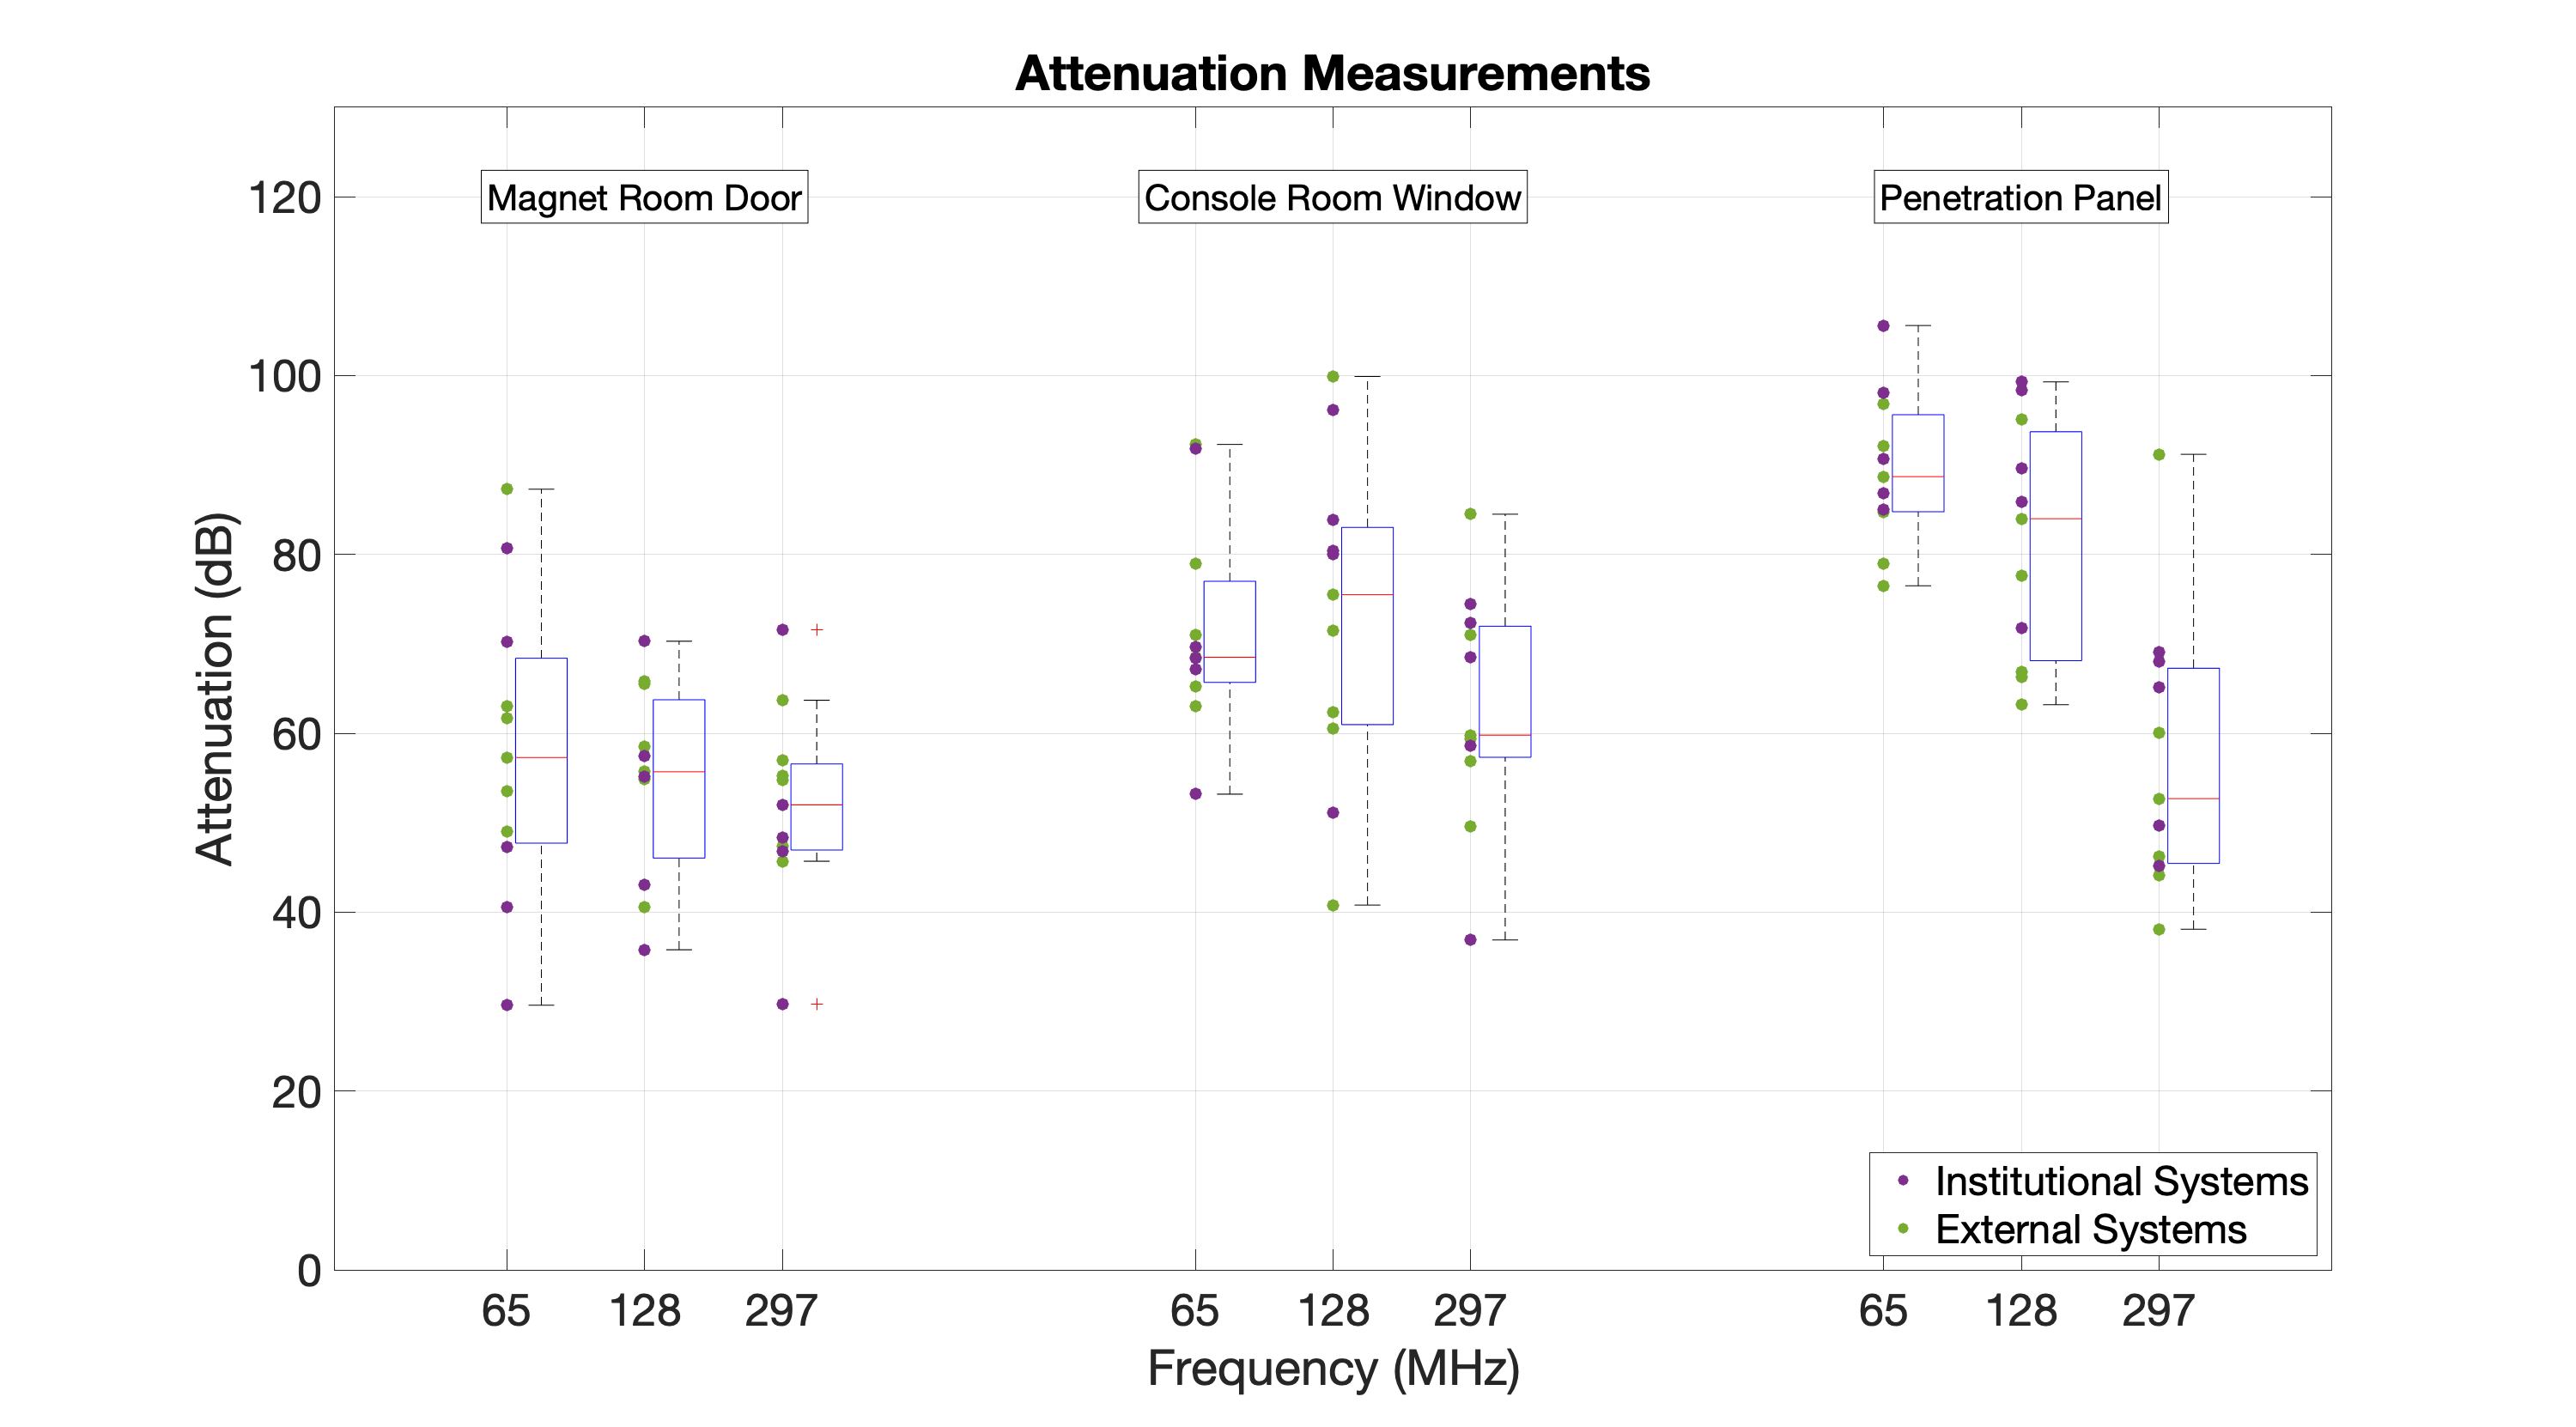
Figure 1 - Faraday cage attenuation measurements of eleven clinical MRI systems: measurements were acquired at 65MHz, 128MHz and 297MHz at the magnet room door, console room window and penetration panel. Box and whisker plots adjacent to the data show the median in red, interquartile range within the box, whilst the whiskers show the range of data excluding outliers, which are indicated with a red cross.
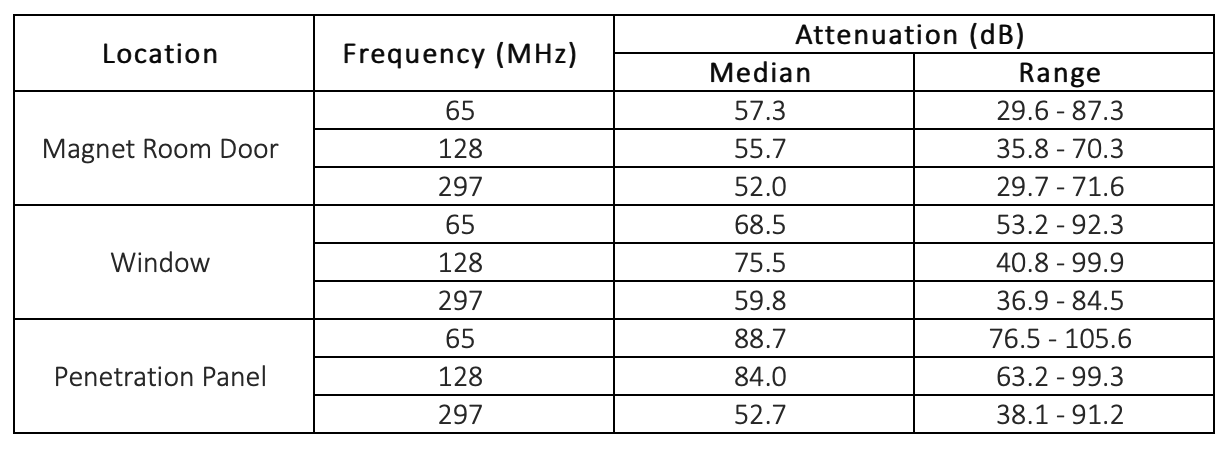
Figure 2 - Summary of RF attenuation measurements in eleven clinical MRI systems
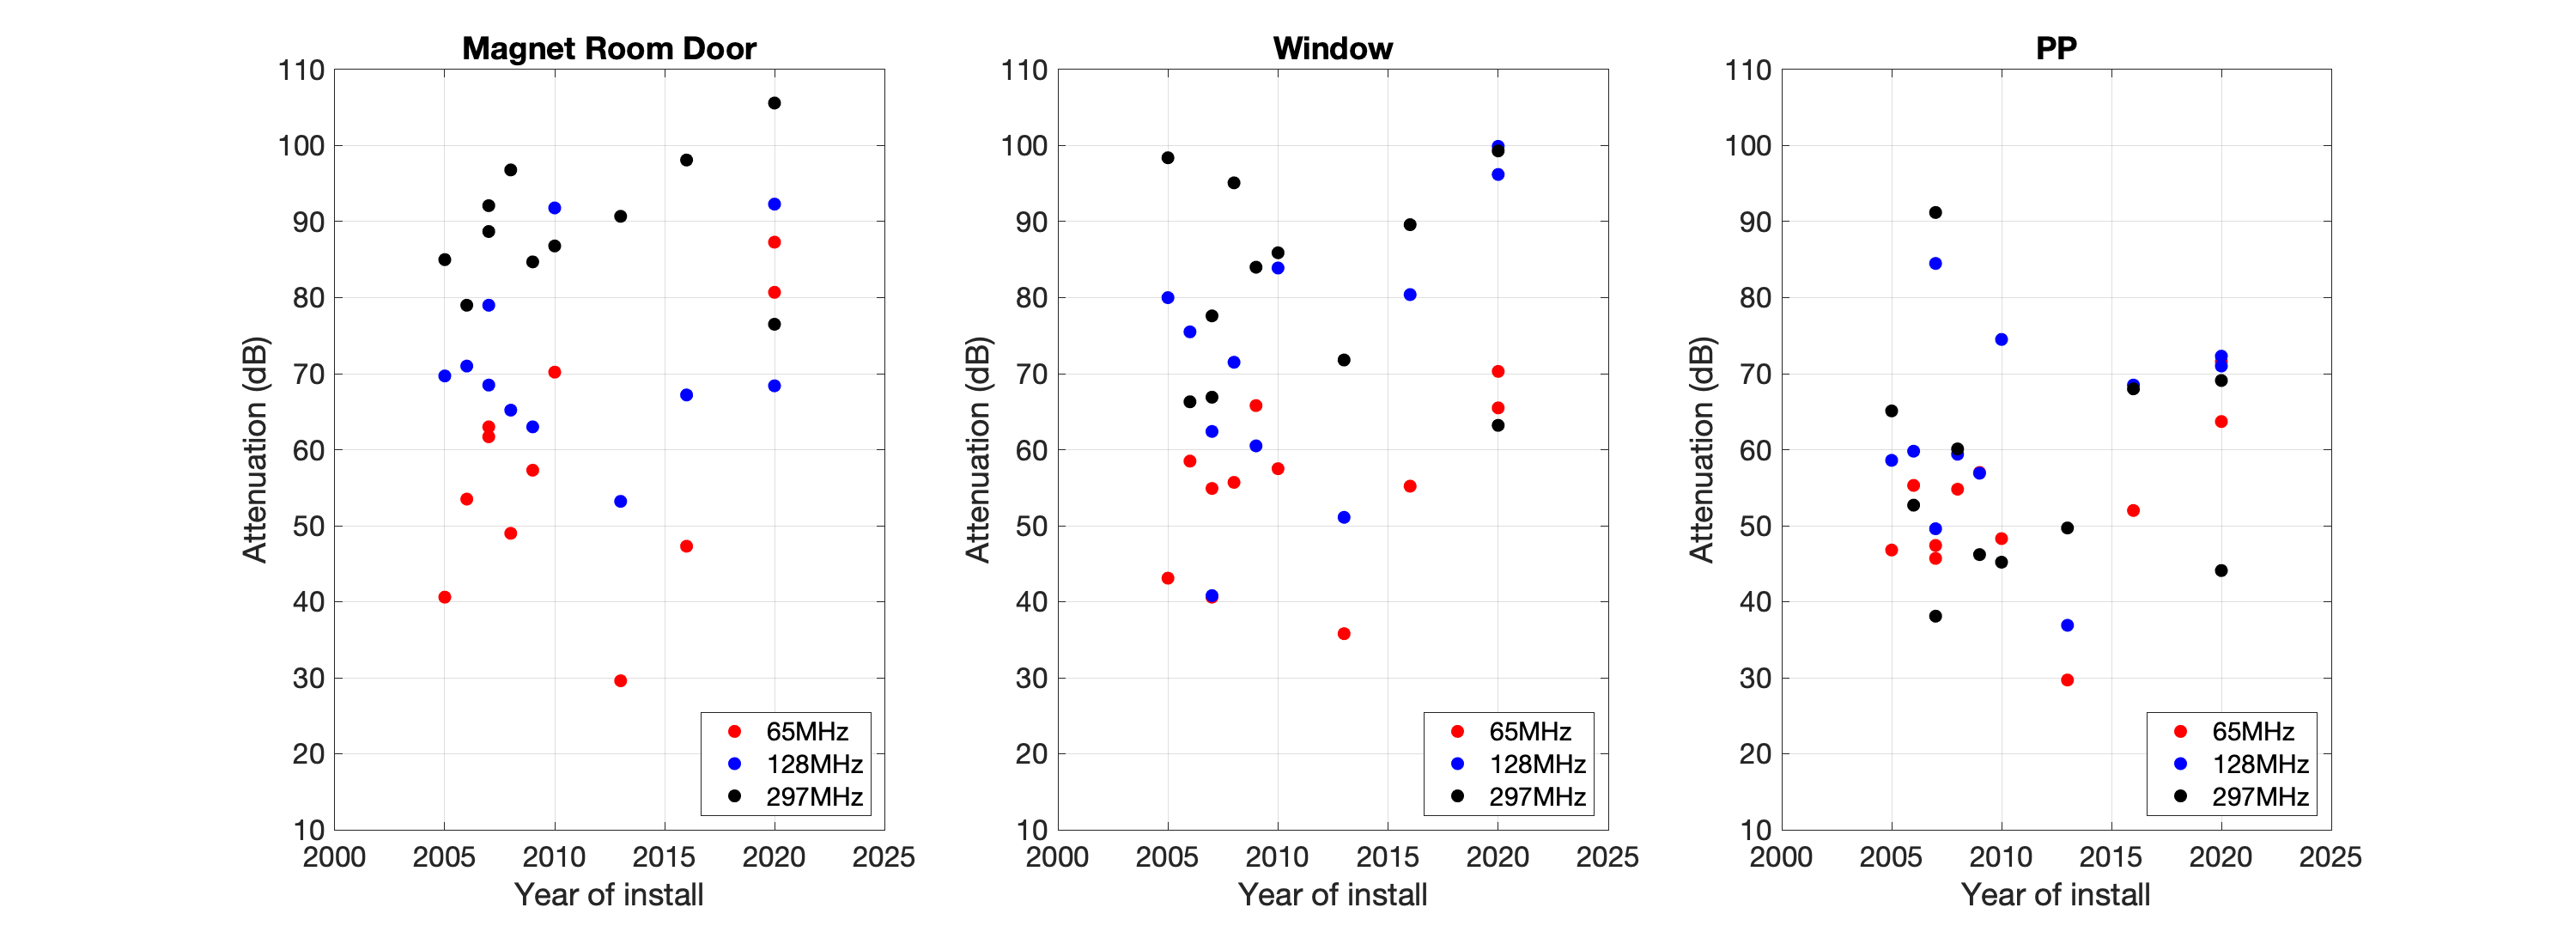
Figure 3 - Measured FC attenuations as a function of year of installation