3545
Characterising the variance and reproducibility of low rank denoising methods for spectroscopic data1Wellcome Centre for Integrative Neuroimaging, NDCN, University of Oxford, Oxford, United Kingdom
Synopsis
Low rank denoising methods can reduce the noise present in spectroscopic data, a typically signal-to-noise limited technique. Low rank denoising is a data driven technique, typically exploiting the linear predictability or spatio-temporal separability of the data. Despite high levels of apparent denoising it is not clear whether denoising decreases the final uncertainty in the measurement, as the denoised data can be biased. In this work we assess the uncertainty reduction using Monte Carlo simulation and by measuring reproducibility of noisy and denoised 1H MRSI. We find low rank denoising reduces uncertainty but by much less than is apparent.
Introduction
Increasing the signal-to-noise ratio (SNR) of magnetic resonance spectroscopy (MRS) by exploiting denoising techniques to reduce the noise level allows for faster acquisitions, more reliable quantification, or higher resolution acquisitions. Low rank denoising methods achieve this in spectroscopic data by exploiting the linear predictability and/or spatio-temporal separability of the data in a data-driven way.1Despite the high levels of apparent denoising achieved by low rank denoising algorithms it is not clear whether they decrease the overall uncertainty in estimated metabolite concentrations. Denoising will lower the apparent noise in any given measurement but can introduce systematic model-based errors affecting the bias and variance of the output, ultimately resulting in lower reproducibility and higher mean squared error. Furthermore, as spectroscopic signals are typically converted to metabolite concentrations by fitting of an explicit spectroscopic model to the data,2 it is not clear whether denoising prior to fitting is statistically advantageous.
In this work we assess the actual uncertainty reduction achieved by low rank denoising using Monte Carlo (MC) simulations and by assessing reproducibility in 1H-MRSI of the human brain. We assess three algorithms based on linear predictability (LP) of the time-domain signal 3, spatio-temporal (ST) separability 4, and a combination of the two: Low Rank Approximations method (LORA).1
LP denoising operates on each spectrum independently, whilst ST denoising incorporates data across multiple voxels. Exploiting low rankness across multiple data dimensions may achieve lower overall measurement uncertainty. We therefore also assess data denoised before coil combination.
Methods
MC simulations were carried out on a simple signal model: a single on-resonance Lorentzian peak with constant amplitude. In each MC repetition 128 different complex, equal-variance Gaussian noise instantiations were generated, representing voxels. Data was then denoised (to rank 1) using LP, ST, or LORA denoising using 4, 32, or 128 of the voxels. In addition, the mean signal across all voxels formed a “best case”. Subsequently one spectrum from each denoising case, the original noisy data, and the average was fitted using AMARES in MATLAB.5 This process was repeated 1000 times and at seven noise levels. The root-mean-square-error of the fitted amplitude was then calculated for each of the different cases.This process was repeated with the simulation of signal from 32 coils. Coils had equal noise variance, random (but Hermitian) noise covariance, and random amplitude and phase. Two cases of ST denoising were then assessed: denoising before, and after WSVD coil combination.6
Reproducibility of in vivo human 1H-MRSI after denoising was assessed in five subjects after coil combination. Data from ten sequential acquisitions of 2D-CONCEPT 1H-MRSI was used to measure reproducibility of metabolite concentrations (TA: 4:30 minutes, total 45 minutes).7 Reproducibility was assessed as the standard deviation of the metabolite concentrations across the ten acquisitions in each subject for the: original unmodified 4.5-minute acquisitions, after LP (truncation to rank 20), ST (rank 10) and LORA denoising (rank 10 & 20). RMSE was calculated as the deviation from the concentrations fitted to the mean of the ten noisy acquisitions. Fitting was done in FSL-MRS with basis spectra consisting of 19 metabolites, and FSL-MRS's default macromolecules.7,8
Results
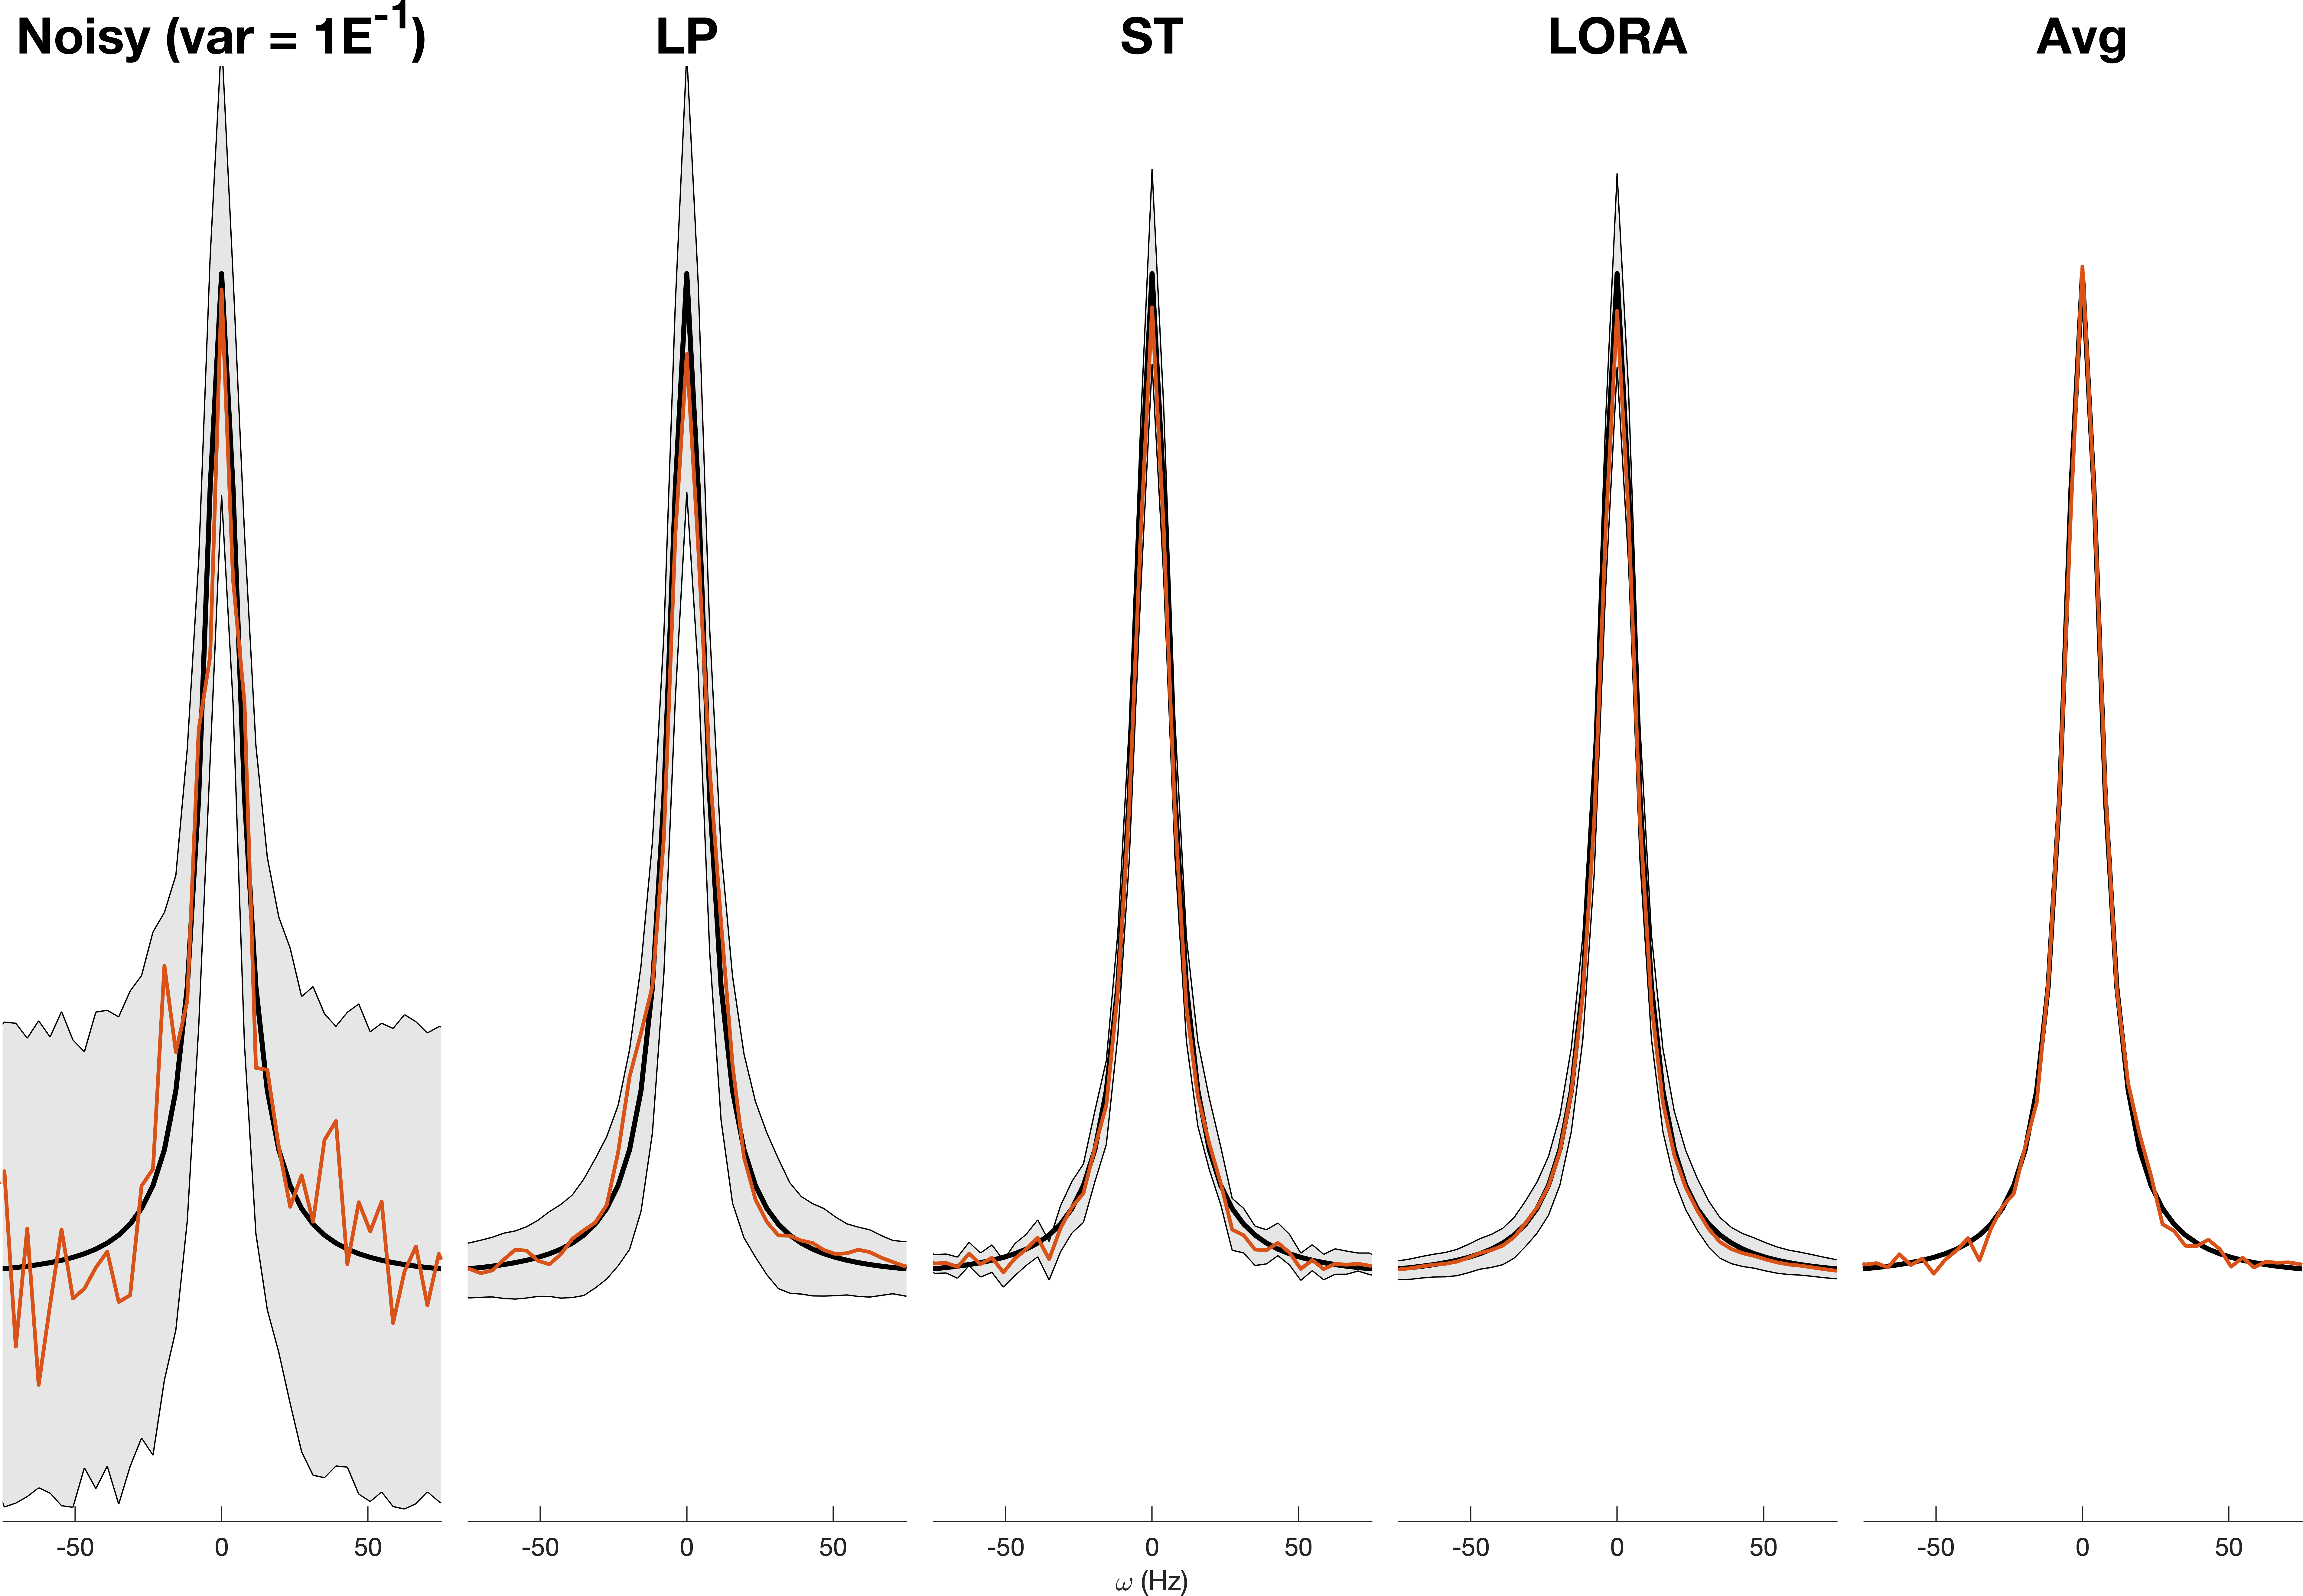
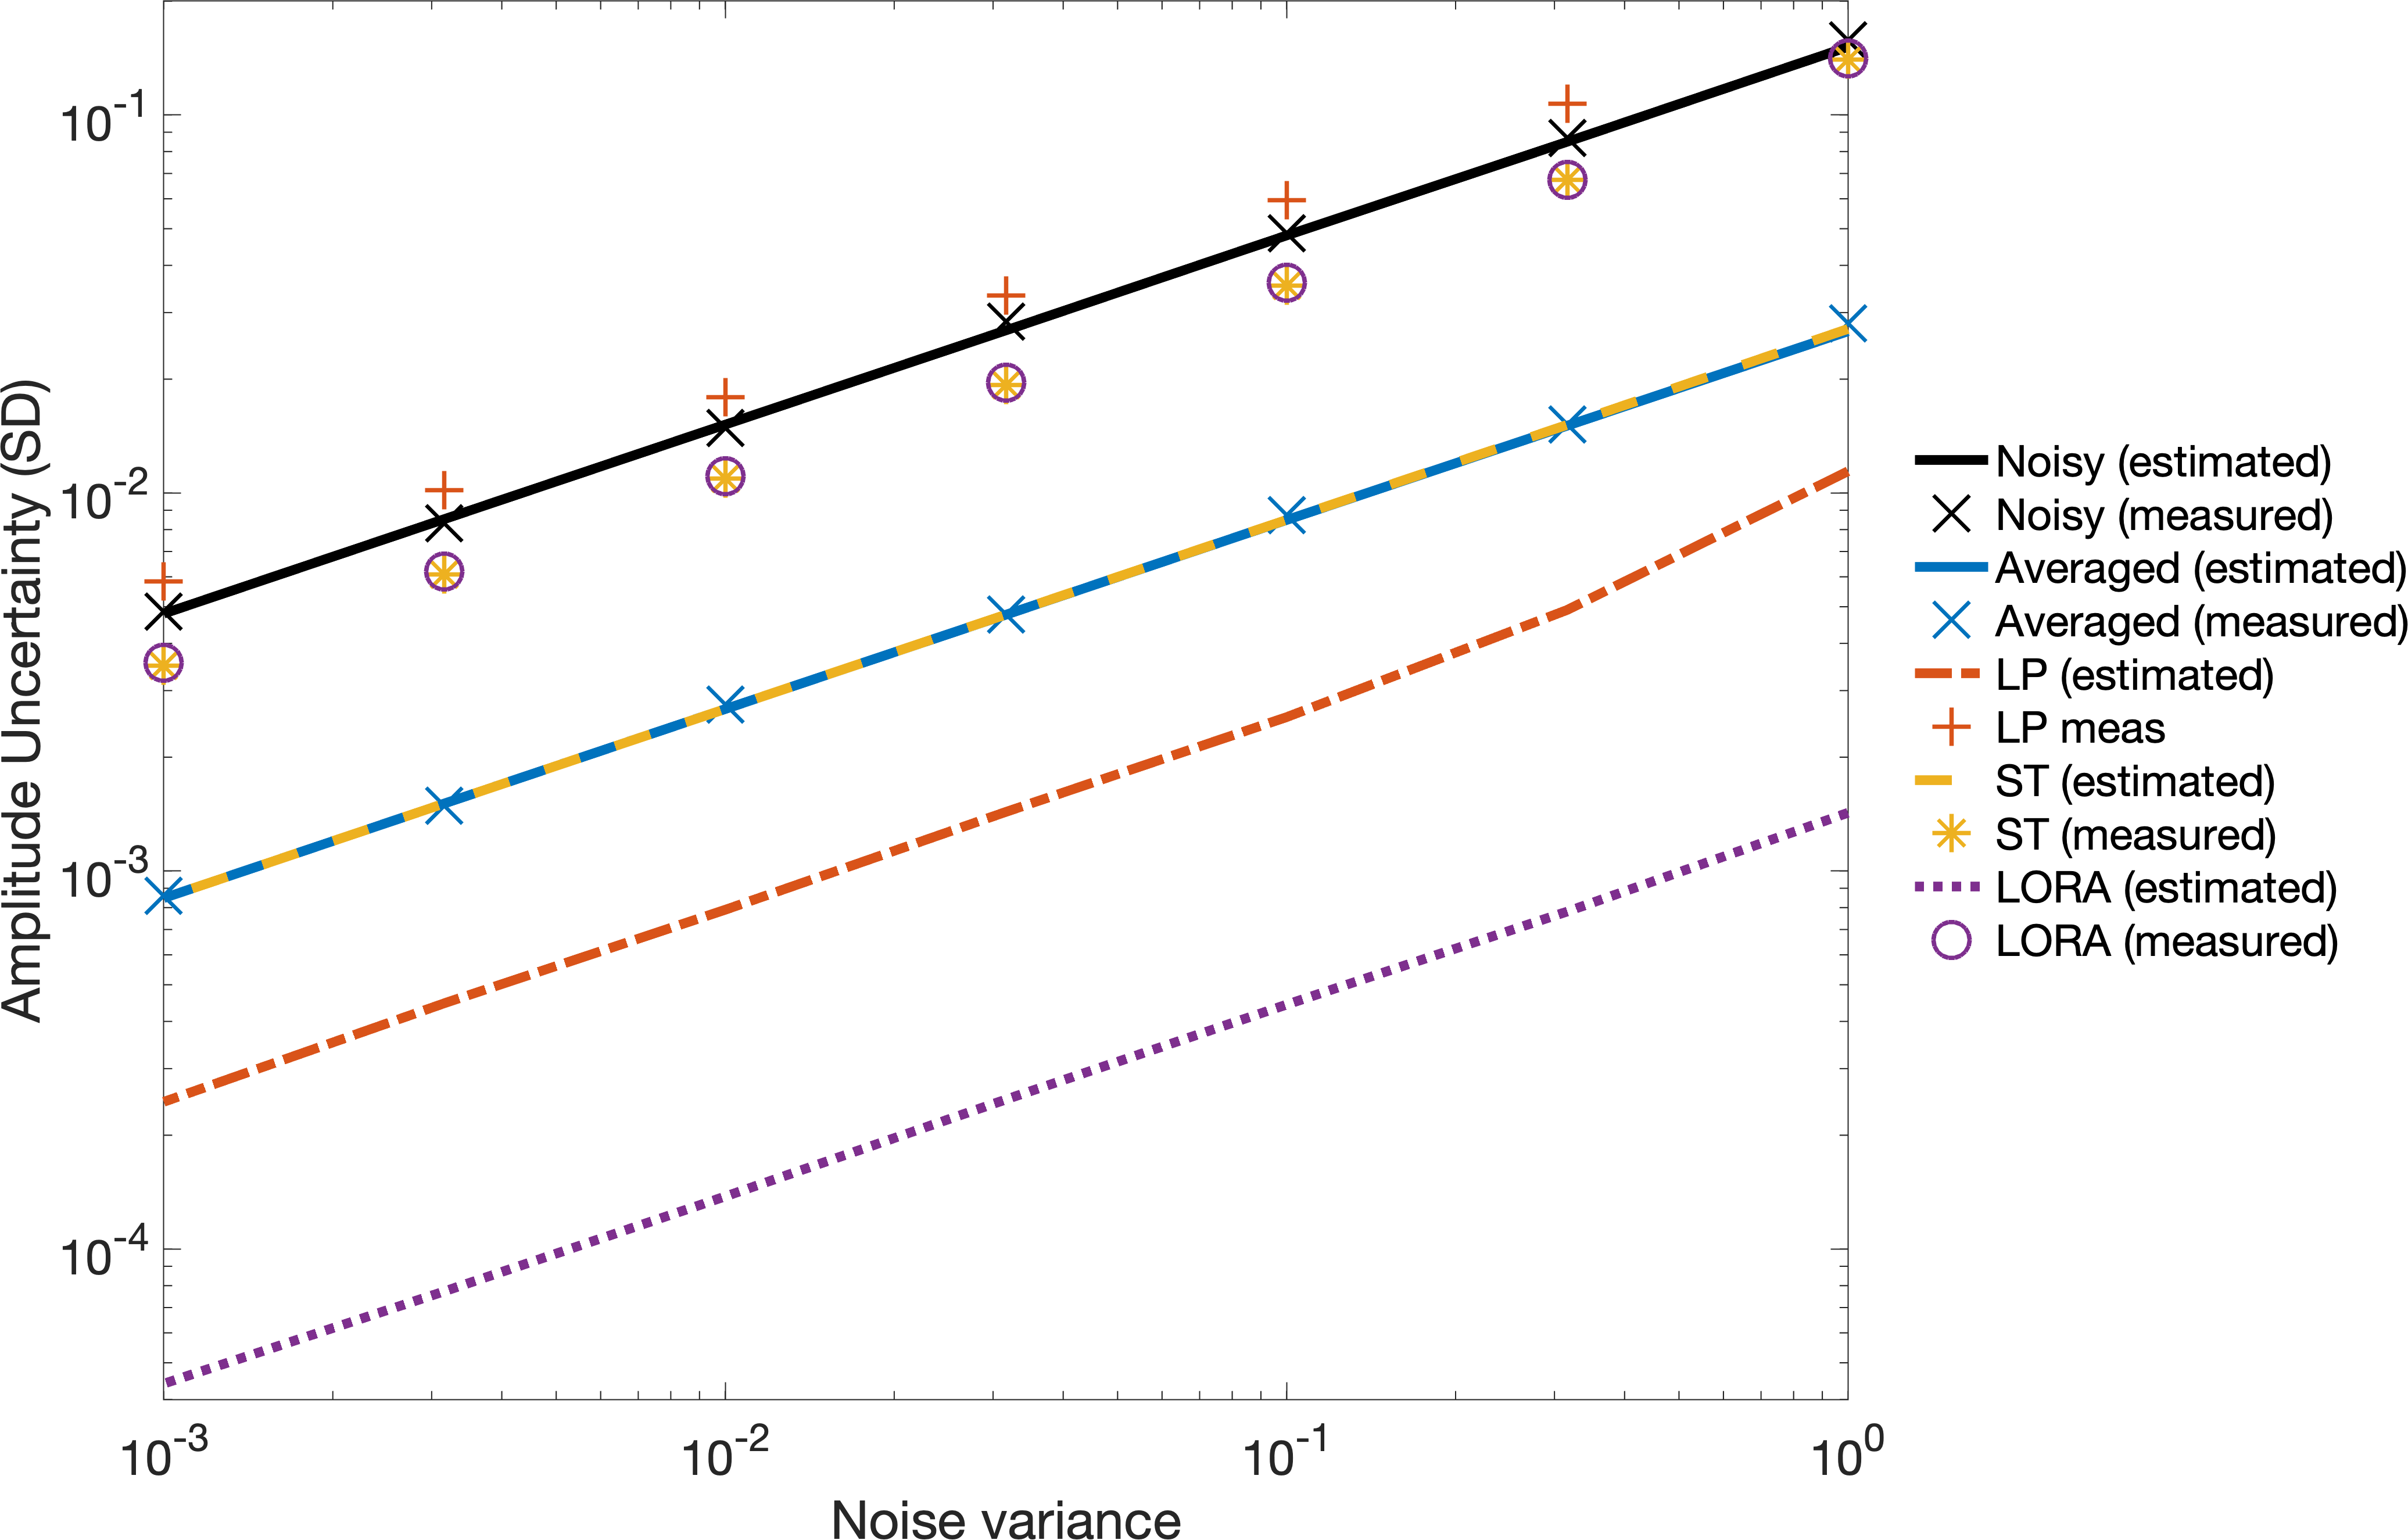
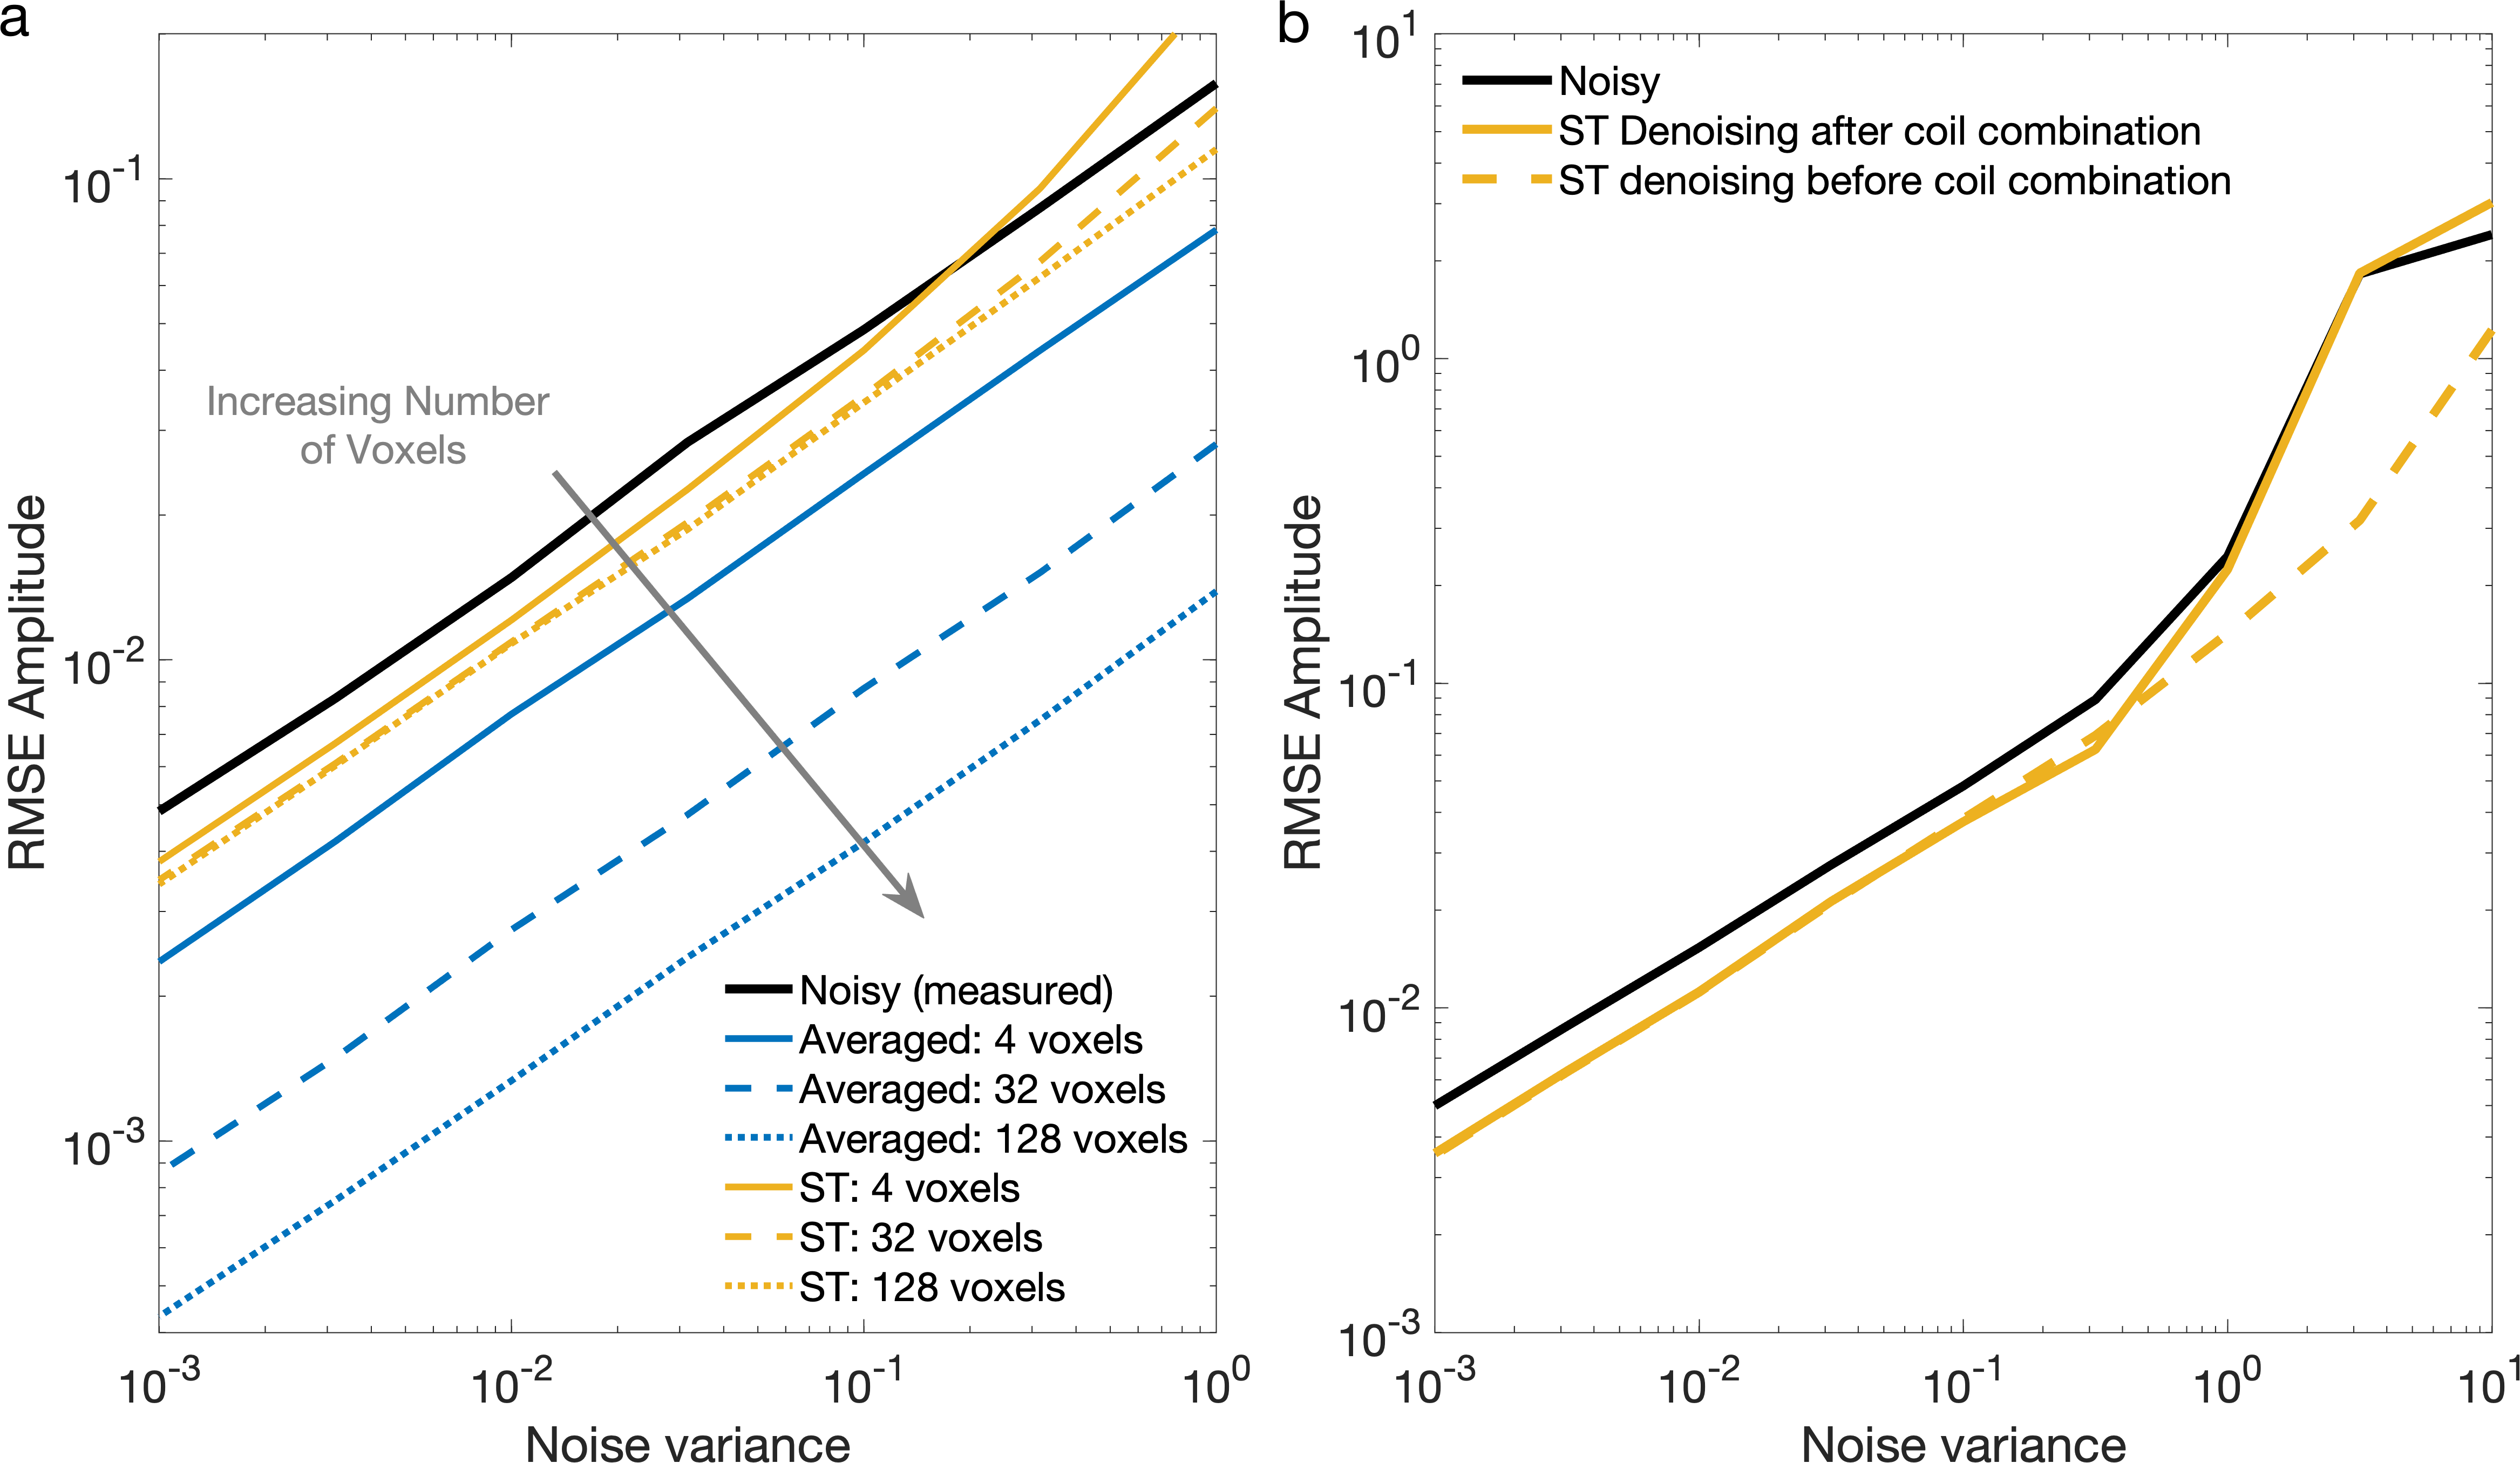
Apparent reduction in noise variance was high for all methods (Figure 1): AMARES estimated Cramér-Rao Lower Bounds (CRLB) for LP, ST, and LORA denoising had amplitude CRLBs 5.6%, 17.7%, and 0.9% of the original noisy data (averaged data CRLB was 17.7%). This was consistent across all noise levels (Figure 2). However, the MC measured amplitude standard deviation showed either smaller reductions or even increases: ST and LORA had 75.2% and 76.1% whilst LP had 145% of the noisy data. The averaged data showed only 17.8% of the variance of noisy data, matching the CRLB estimates and the expected theoretical square-root relationship.Increasing the number of voxels used by the ST and LORA denoising algorithms showed only marginal improvements in MC measured RMSE, however it did improve robustness to noise (Figure 3a). Similarly ST denoising before combining coils did not reduce RMSE, but improved robustness at high noise levels (Figure 3b).
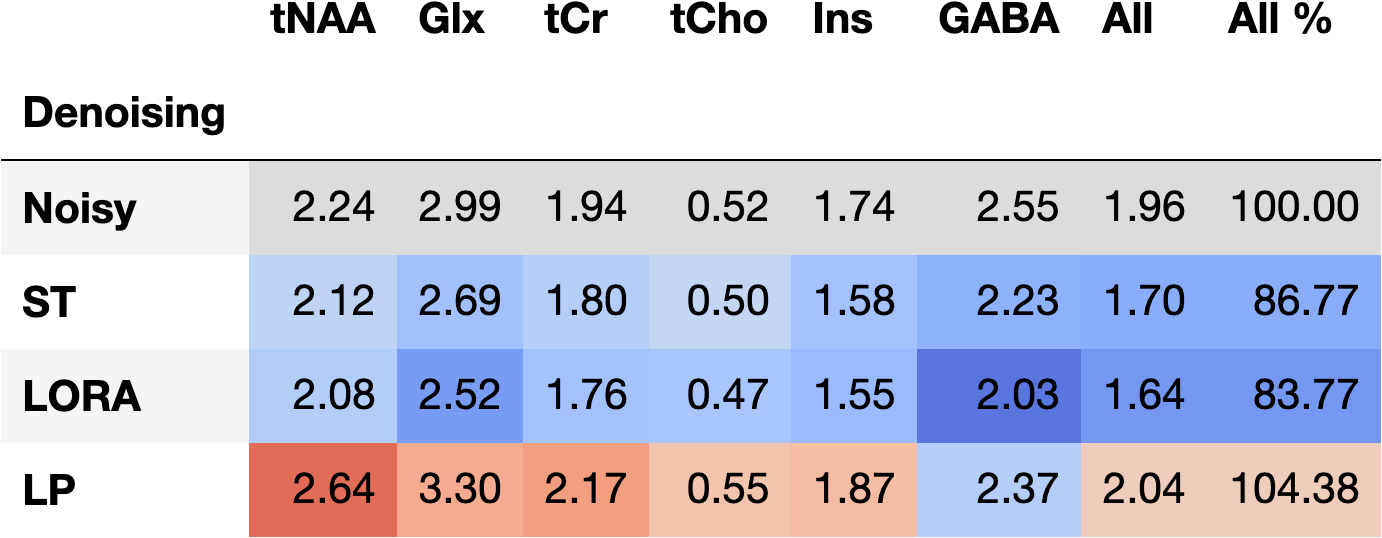
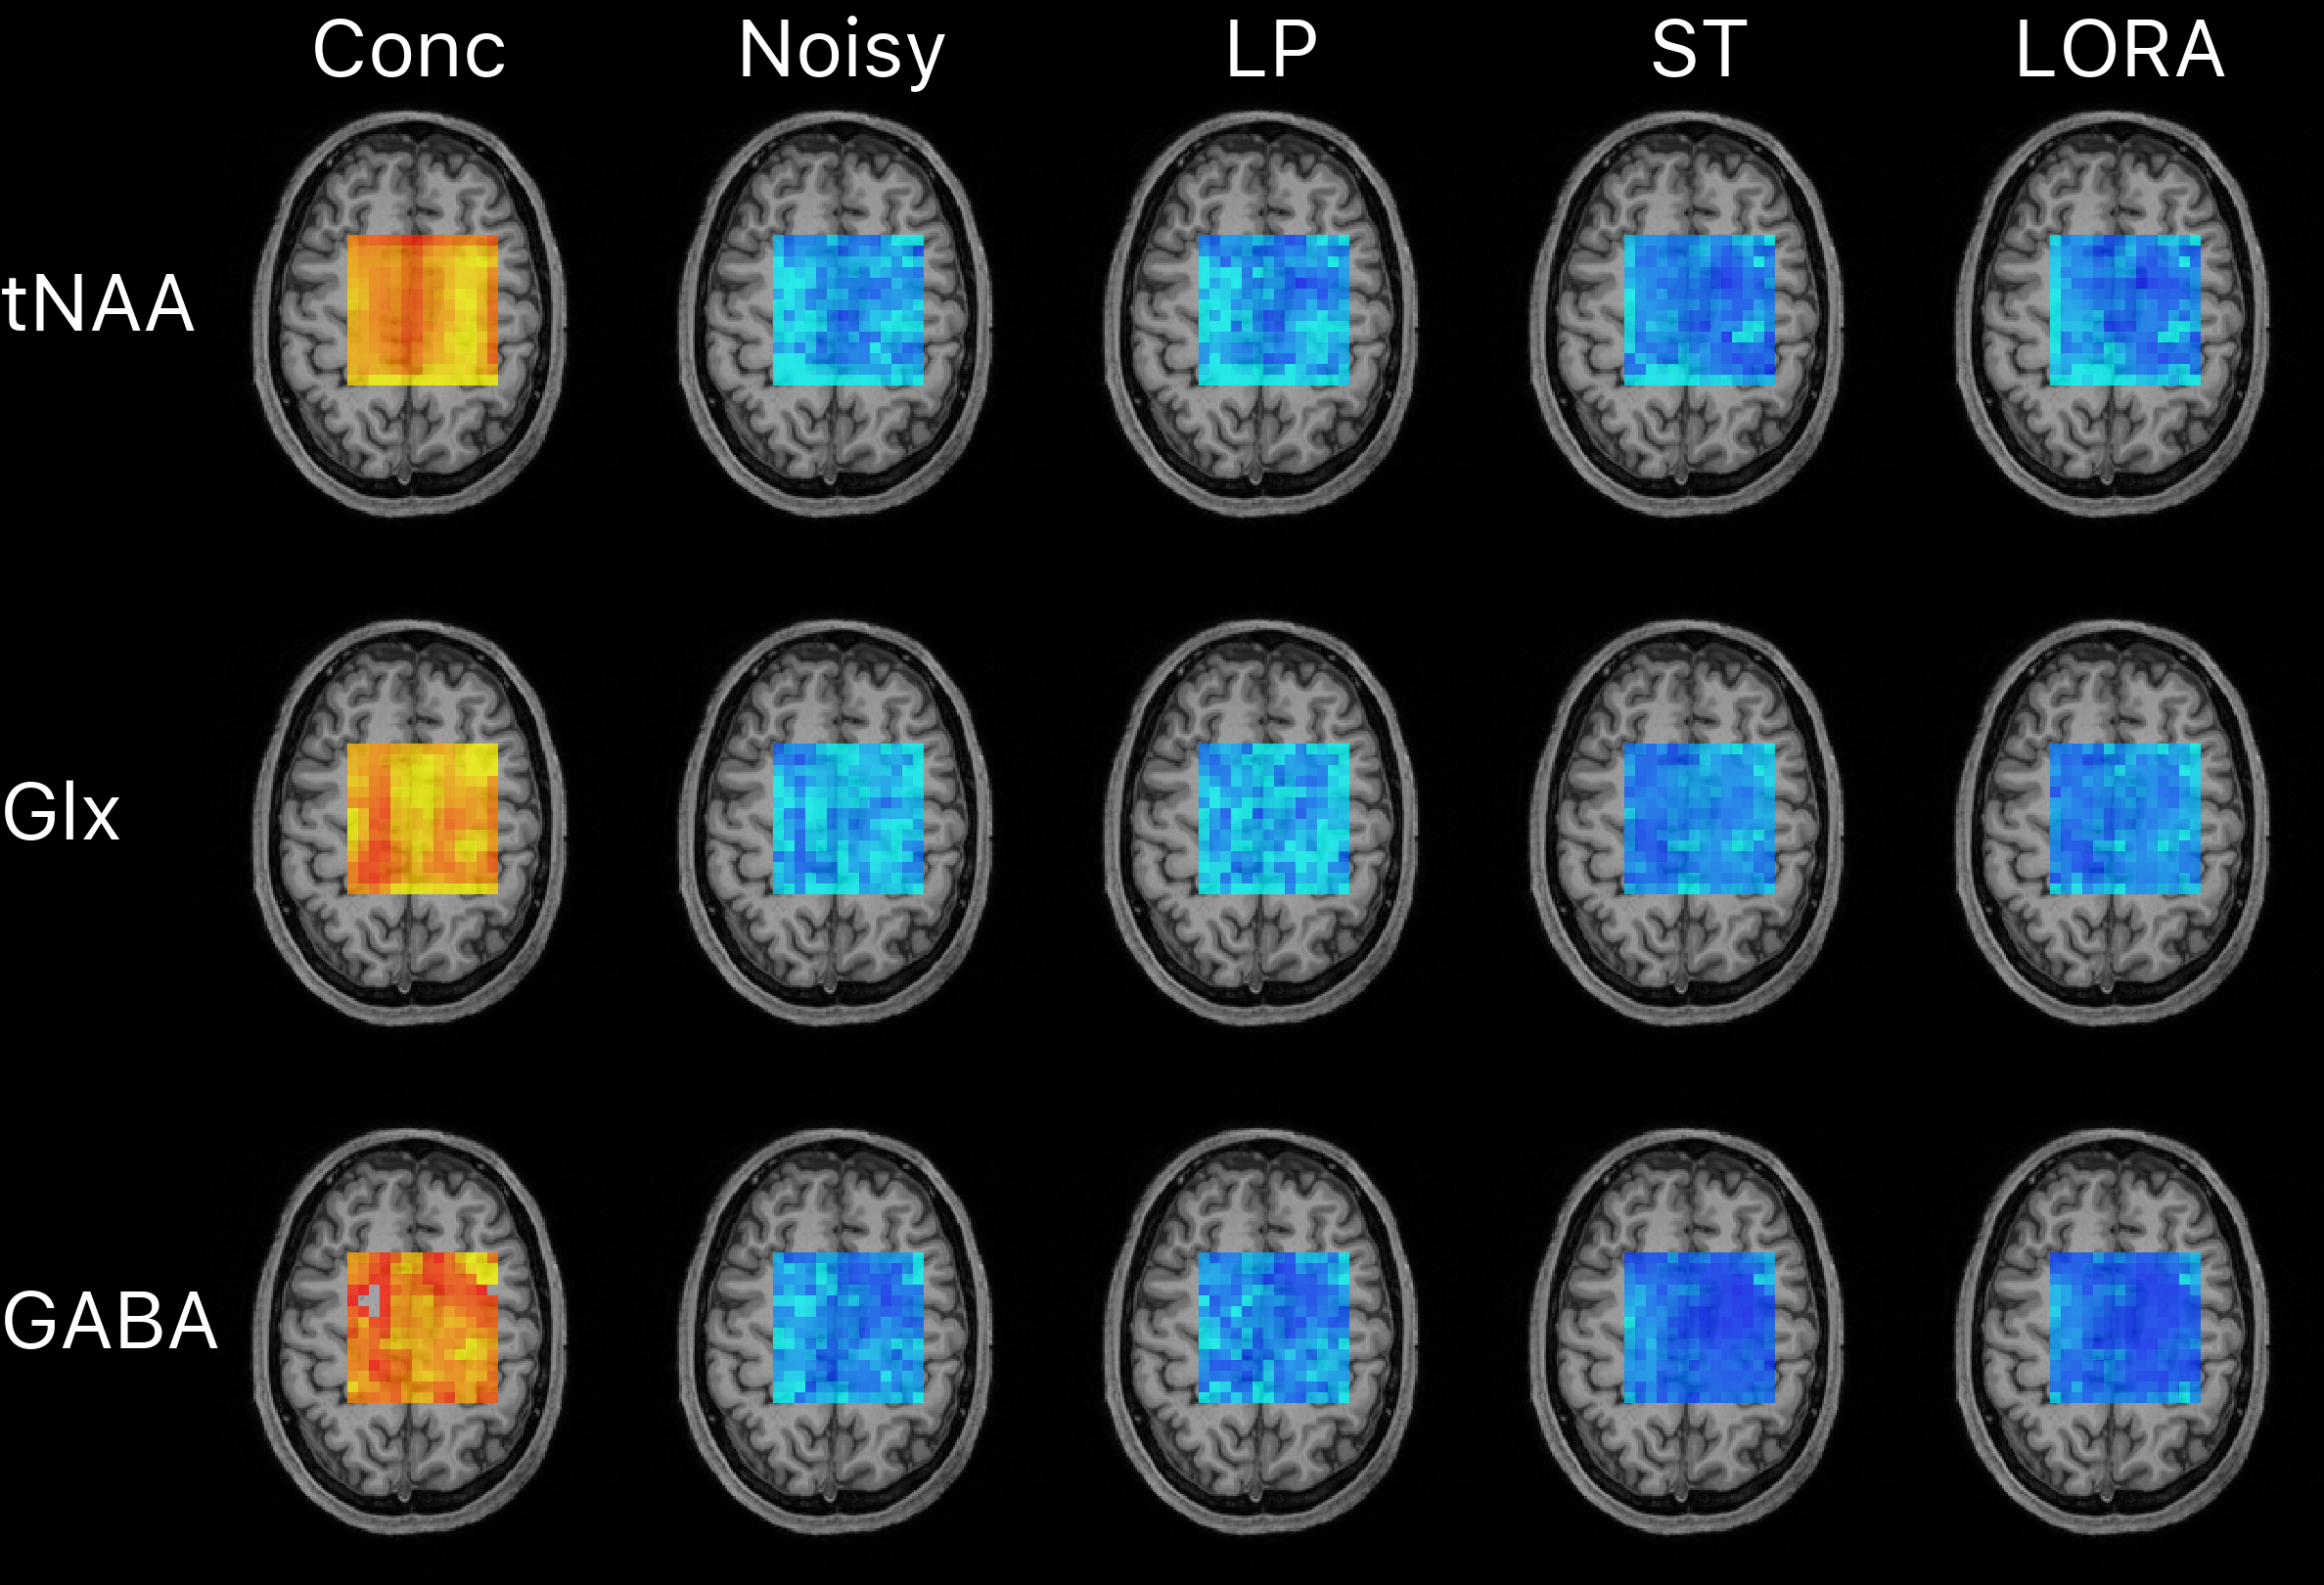
The effect of denoising on in vivo reproducibility demonstrated a similar pattern to that of simulation. Reproducibility (mean ± SD) after LP, ST, and LORA denoising was 1.10±0.43, 0.85±0.35, and 0.84±0.34 times that of the noisy data. RMSE for individual metabolites is given in Figure 4, and voxel-wise maps of reproducibility are shown in Figure 5.
Discussion
We have shown in simulation and in vivo data that the apparent noise reduction of low rank denoising methods is not representative of the true reduction in measurement uncertainty. Denoising algorithms combining data across spectra achieve a modest reduction in uncertainty, but the LP algorithm which only operates on single spectra increases measurement uncertainty. This matches the poor performance of the LP algorithm when applied independently in Reference 1. Applying denoising to individual coil data (before combination) or increasing the number of spectra in ST or LORA denoising improves robustness to noise, but does not significantly decrease uncertainty.Low rank denoising methods can increase the SNR of MRS data, but thorough assessment should be undertaken before using them as users cannot rely on the apparent denoised noise baseline or estimated CRLBs to understand their net statistical impact.
Acknowledgements
MC is supported by the Royal Academy of Engineering (RF201617\16\23). Data in this work was collected using funding from the Wellcome Trust and the Royal Society (102584/Z/13/Z). The Wellcome Centre for Integrative Neuroimaging is supported by core funding from the Wellcome Trust (203139/Z/16/Z).References
1. Nguyen HM, Peng X, Do MN, Liang Z. Denoising MR Spectroscopic Imaging Data With Low-Rank Approximations. IEEE Trans. Biomed. Eng. 2013;60:78–89 doi: 10.1109/TBME.2012.2223466.
2. Near J, Harris AD, Juchem C, et al. Preprocessing, analysis and quantification in single-voxel magnetic resonance spectroscopy: experts’ consensus recommendations. NMR Biomed. n/a:e4257 doi: 10.1002/nbm.4257.
3. Cadzow JA. Signal enhancement-a composite property mapping algorithm. IEEE Trans. Acoust. Speech Signal Process. 1988;36:49–62 doi: 10.1109/29.1488.
4. Liang Z. SPATIOTEMPORAL IMAGINGWITH PARTIALLY SEPARABLE FUNCTIONS. In: 2007 4th IEEE International Symposium on Biomedical Imaging: From Nano to Macro. ; 2007. pp. 988–991. doi: 10.1109/ISBI.2007.357020.
5. Purvis LAB, Clarke WT, Biasiolli L, Valkovič L, Robson MD, Rodgers CT. OXSA: An open-source magnetic resonance spectroscopy analysis toolbox in MATLAB. PloS One 2017;12:e0185356 doi: 10.1371/journal.pone.0185356.
6. Rodgers CT, Robson MD. Coil combination for receive array spectroscopy: Are data-driven methods superior to methods using computed field maps? Magn. Reson. Med. 2016;75:473–487 doi: https://doi.org/10.1002/mrm.25618.
7. Steel A, Chiew M, Jezzard P, et al. Metabolite-cycled density-weighted concentric rings k-space trajectory (DW-CRT) enables high-resolution 1 H magnetic resonance spectroscopic imaging at 3-Tesla. Sci. Rep. 2018;8:7792 doi: 10.1038/s41598-018-26096-y.
8. Clarke WT, Stagg CJ, Jbabdi S. FSL-MRS: An end-to-end spectroscopy analysis package. Magn. Reson. Med. n/a doi: https://doi.org/10.1002/mrm.28630.
Figures