3544
Denoising MR 2D COSY spectra using a joint sparse parametric Matching Pursuit (jSPaMP)1Digital Technology and Innovation, Siemens Healthineers, Princeton, NJ, United States, 2MR R&D Collaboration, Siemens Medical Solutions USA Inc., Atlanta, GA, United States, 3Department of Radiology and Imaging Sciences, Emory University, Atlanta, GA, United States
Synopsis
This work introduces a new approach to denoise 2D COSY data that typically are collected with low number of signal averages. Our method of a joint sparse parametric Matching Pursuit uses high-resolution parametric models to model the behavior of 2D COSY data in the F2 dimension and add nonparametric joint sparse constraints to regularize the peak shape in the F1 dimension. The effect and performance of denoising were demonstrated using a phantom.
Introduction
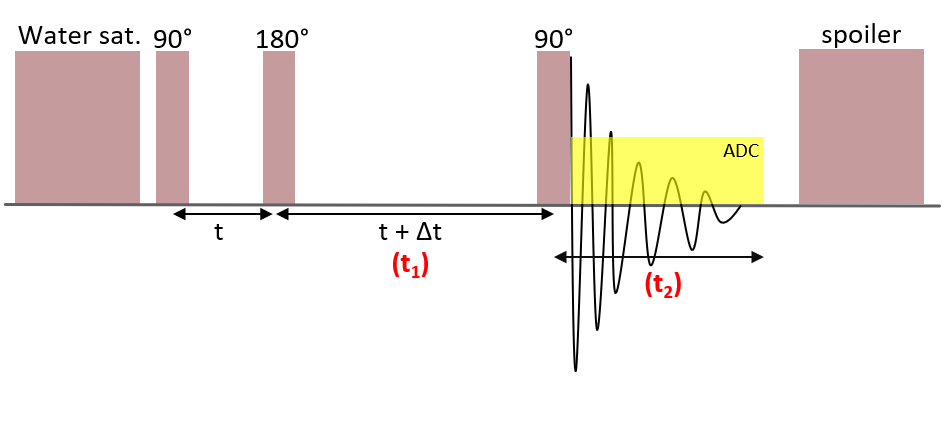
2-dimensional (2D) localized correlation spectroscopy (COSY) is highly effective in resolving overlapping J-coupled protons of specific metabolites [1]. However, its in vivo implementation is limited by the low number of signal averages (NSA), resulting in 2D data with a high level of noise or low signal-to-noise ratio (SNR). A localized COSY acquisition includes three RF pulses (an excitation pulse, which follows a delay (t) often referred to as “preparation time”, a 180-degree refocusing pulse followed by an evolution time delay (t + Δt), and a second excitation pulse, which precedes data acquisition. The evolution time is incremented in each TR giving rise to the additional COSY dimension (F1, post 2D Fourier Transformation). In a 2D COSY plot, the diagonal peaks demonstrate the metabolite peaks as seen in a 1D single-voxel spectroscopy, and the off-diagonal cross-peaks rising from the peaks on the diagonal demonstrate the J-coupling effect between two corresponding protons. However, the off-diagonal cross-peaks are weak and often buried in the noise, comparing to their correlating or pairing diagonal peaks. Presence of noise can obscure the identification of these off-diagonal cross-peaks. Parametric peak fitting is a standard tool of processing 1D MR spectroscopy based on modelling the time series as damped complex exponentials [2]. In that context, it improves the SNR and enables the detection and quantitation of signals. In this work, we attempt to extend the method to localized 2D COSY data. While 2D COSY spectra remain sparse in the 2D frequency domain, the evolution along the F1 dimension seems to deviate significantly from simple exponential models. Here, we present a hybrid method to denoise 2D COSY data. The method is parametric in the F2 dimension but nonparametric in the F1 dimension.Methods
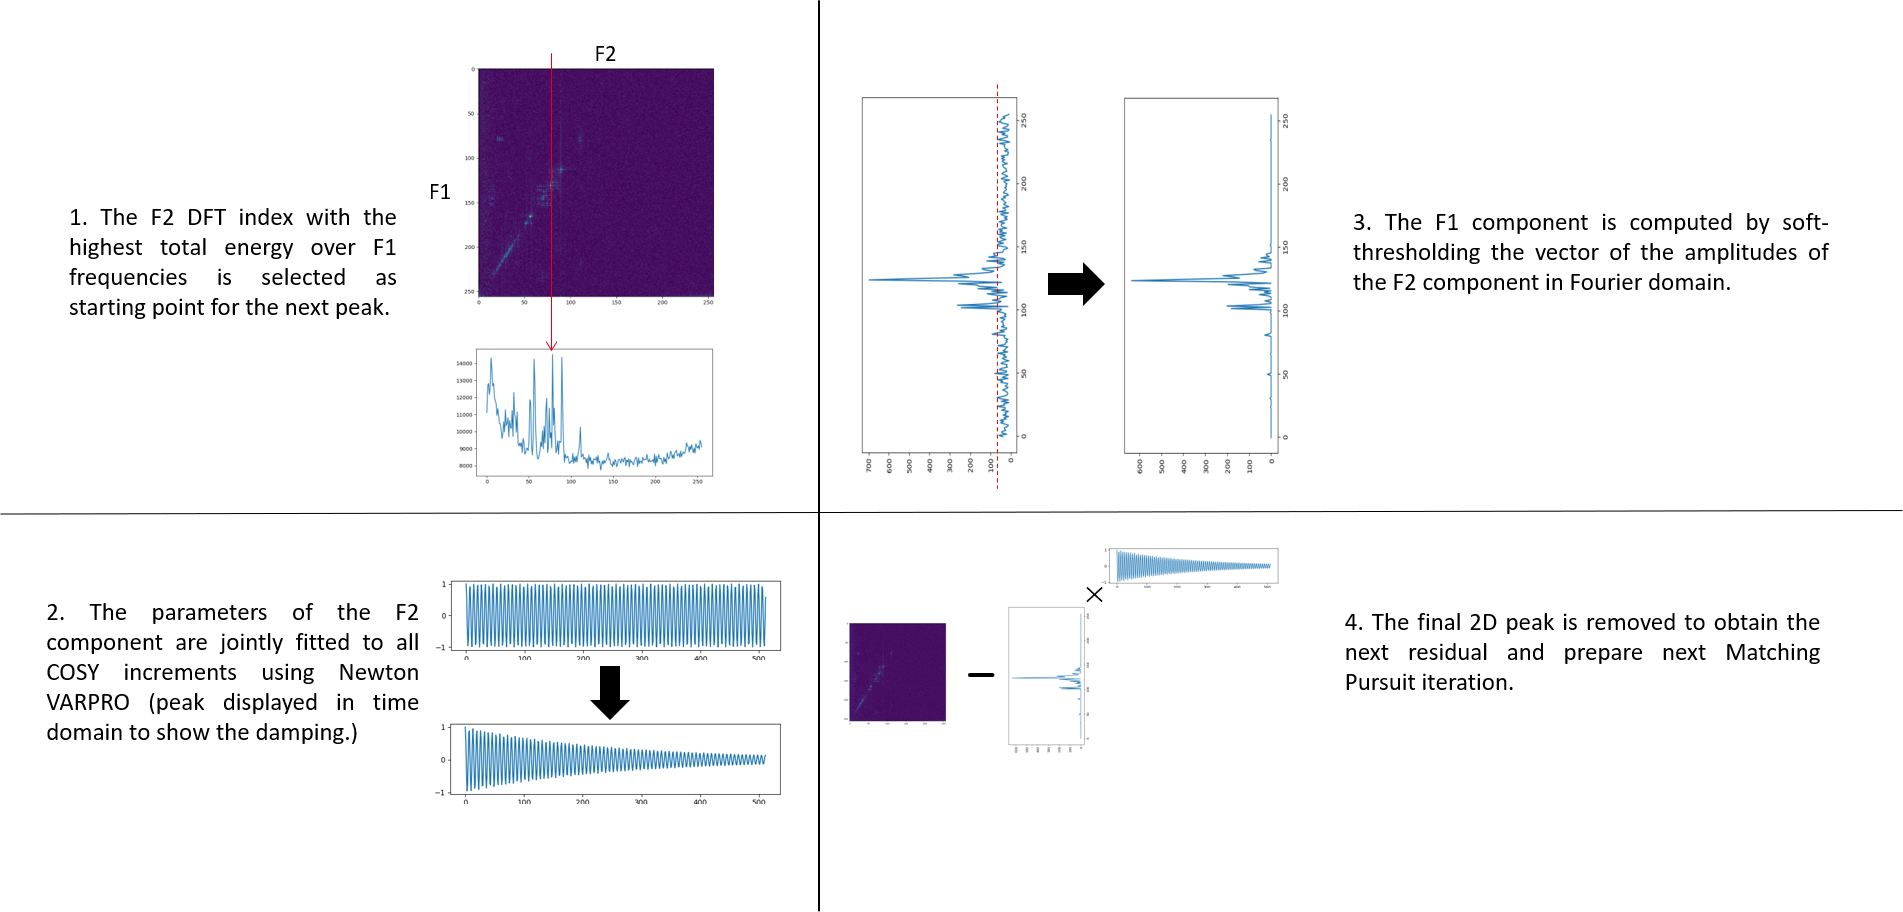
Image Acquisition: Single-voxel 2D COSY spectra of a phantom (Model 2152220, GE Healthcare, Chicago, IL) containing brain metabolites were recorded on a Siemens 3T system (MAGNETOM Prismafit, Siemens Healthcare, Erlangen, Germany) using a prototype 2D COSY sequence described in Figure 1. A water suppression block is followed sequentially by a single-voxel localization, a spin-echo (90-180 RF pulse pair), a selected mixing time that varies along the t1 dimension, and a final 90-degree RF pulse which is followed by data acquisition. Other acquisition parameters were as follows: voxel size 20x20x20 mm3, TE/TR: 30/1500ms, averages: 6, BW: 2000Hz, delay offset: 0.8ms. Two settings were used: high SNR (COSY increment: 256, NSA: 96) and high resolution (COSY increment: 512, NSA: 16.) After averaging, coil combination and oversampling reduction, the data were reconstructed including inline frequency and phase correction using the NAA peak as a reference.Hybrid denoising of 2D COSY data: The algorithm described in Figure 2 models 2D peaks as separable into F1 and F2 components and a uses a parametric model of F2 components as damped complex exponentials. Since such models do not accurately represent the F1 behavior, the algorithm uses a nonparametric COSY representation (i.e. F1 components are represented by their complex amplitude at every COSY increment) with additional constraints of joint sparsity in F2 (i.e. F2 peaks occur in a small set of frequencies shared by all COSY increments) and sparsity in F1(i.e. each F2 peak is only active at a small number of F1 frequencies). The algorithm is based on Matching Pursuit [3], i.e. it iteratively fits the strongest peak and subtracts it from the signal. Joint sparsity is enforced during peak selection by choosing the F2 discrete frequency with the highest total energy across all COSY increments [4]. That frequency is used to initialize a high-resolution VARPRO solver of the frequency and damping using Newton’s method [2]. The gradient and Hessian are computed by automated differentiation in Pytorch to enable future expansions of the parametric model. The amplitudes computed by VARPRO form the nonparametric F1 component. F1 sparsity is enforced by soft thresholding the F1 component in Fourier domain.
Results
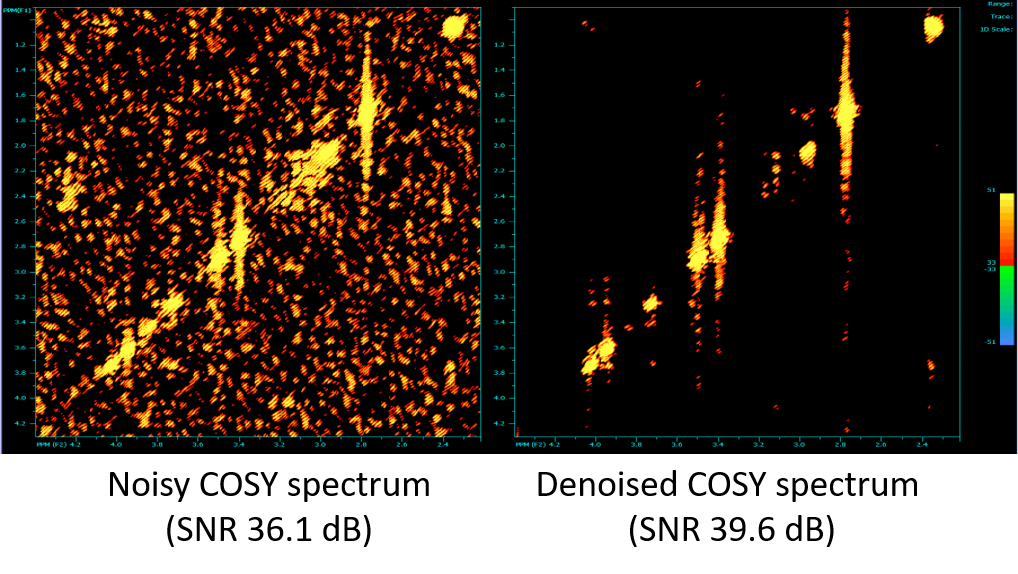
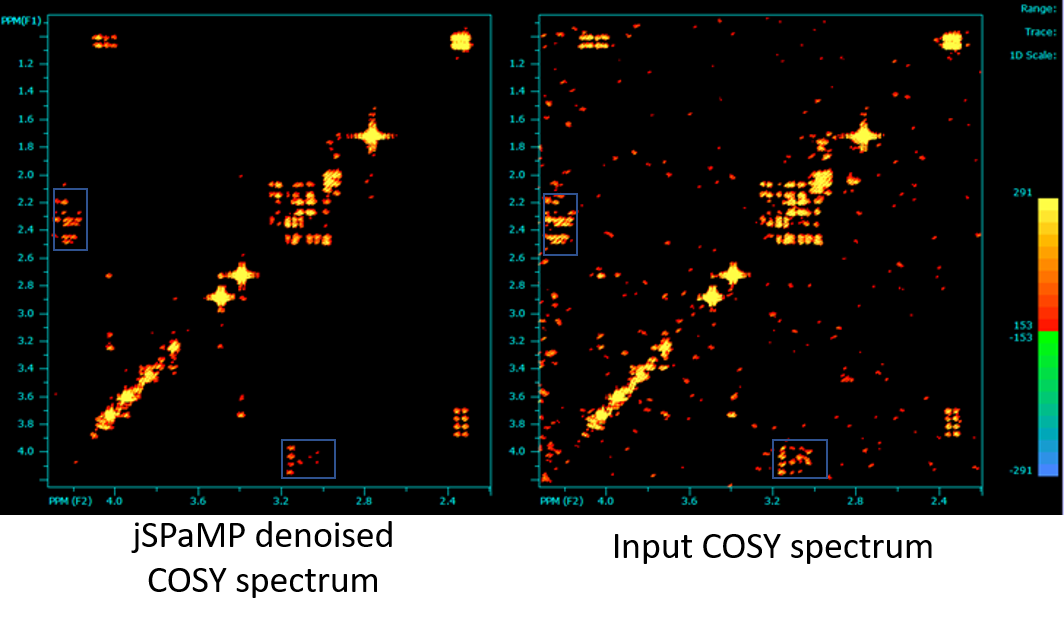
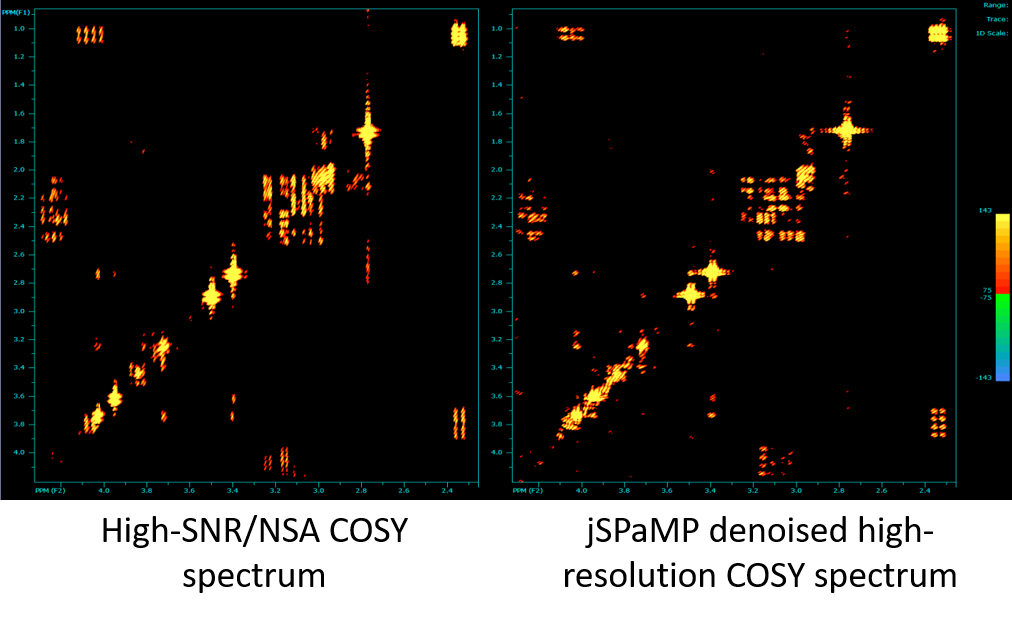
Figure 3 shows a quantitative evaluation of jSPaMP on high-SNR data with additional simulated noise (input SNR 36.1 dB.) jSPaMP improved the SNR by 3.5 dB. Figure 4 shows the selected regions of original and denoised high-resolution spectra. After denoising, the diagonal signal was well reconstructed. Noise in the off-diagonal region was suppressed significantly. Compared to the reference, many low intensity off-diagonal cross peaks from the metabolites (e.g., glutamine) that are difficult to recognize in the original noisy spectrum are clearly identified in the denoised spectrum. Figure 5 shows a visual comparison of the unprocessed high SNR data with the denoised high-resolution data. The two spectra have similar SNR and jSPaMP preserved the higher input resolution. It is noted that denoising by jSPaMP somewhat suppressed some off-diagonal cross-peaks, suggesting the need for further fine-tuning of this approach to improve the signal-specific denoising ability to preserve the cross-peaks from the metabolites.Conclusions
This preliminary study demonstrated the feasibility of leveraging 2D structures for denoising 2D COSY data even in the absence of detailed physical models of the COSY decay. While this work only used a first-order physical model of the temporal behavior, the method can easily be extended to higher-order models and prior knowledge of chemical structure determined signal multiplet patterns and their chemical shifts.Acknowledgements
The concepts and information presented in this paper are based on research results that are not commercially available. Future availability cannot be guaranteed.References
[1] Thomas MA, Hattori N, Umeda M, Sawada T, Naruse S. Evaluation of two-dimensional L-COSY and JPRESS using a 3 T MRI scanner: from phantoms to human brain in vivo. NMR Biomed. 2003;16(5):245-51.
[2] Vanhamme L, Sundin T, Hecke PV and Huffel SV. MR spectroscopy quantitation: a review of time‐domain methods. NMR Biomed. 2001; 14: 233-246.
[3] Mallat SG and Zhang Z. Matching pursuits with time-frequency dictionaries. IEEE Trans. Signal Processing. 1993; 41(12): 3397–3415.
[4] Cotter SF, Rao BD, Engan K and Kreutz-Delgado K. Sparse solutions to linear inverse problems with multiple measurement vectors. IEEE Trans. Signal Processing. 2005; 53(7):2477-2488.
Figures