3538
Development and evaluation of a numerical simulation approach to predict metal artifacts from passive implants in MRI1Erwin L. Hahn Institute for MR Imaging, University of Duisburg-Essen, Essen, Germany, 2High-Field and Hybrid MR Imaging, University Hospital Essen, Essen, Germany, 3MRI-STaR Magnetic Resonance Institute for Safety, Technology and Research GmbH, Gelsenkirchen, Germany, 4MR:comp GmbH, Testing Services for MR Safety & Compatibility, Gelsenkirchen, Germany
Synopsis
This study presents a numerical approach to simulate artifacts of metallic implants in the MR environment, which can be applied to improve the MR image artifacts testing procedure for medical implants according to ASTM F2119. The numerical approach is validated by comparing simulations and measurements of two metallic test objects made of titanium and stainless steel at three different field strengths (1.5 T, 3 T, and 7 T).
Introduction
When scanning patients with medical implants it is essential to know the influence of the implants on the MR image quality to deduce potential impairment for obtaining a diagnose in the surrounding tissue. The procedure of testing MR image artifacts from passive medical implants is described in ASTM F2119 [1]. However, the ASTM standard requires a testing procedure at only one field strength (1.5 T or 3 T) and only for a limited set of sequence parameters. This may lead to a restricted transferability of the test results for different patient cases and potential MRI exams. Hence, this study developed a numerical simulation approach which allows to calculate MR image artifacts at medical implants. The rationale is to obtain reliable results for extensive artifact evaluations across field strengths without an increased measuring effort on the actual MR systems.Materials & Methods
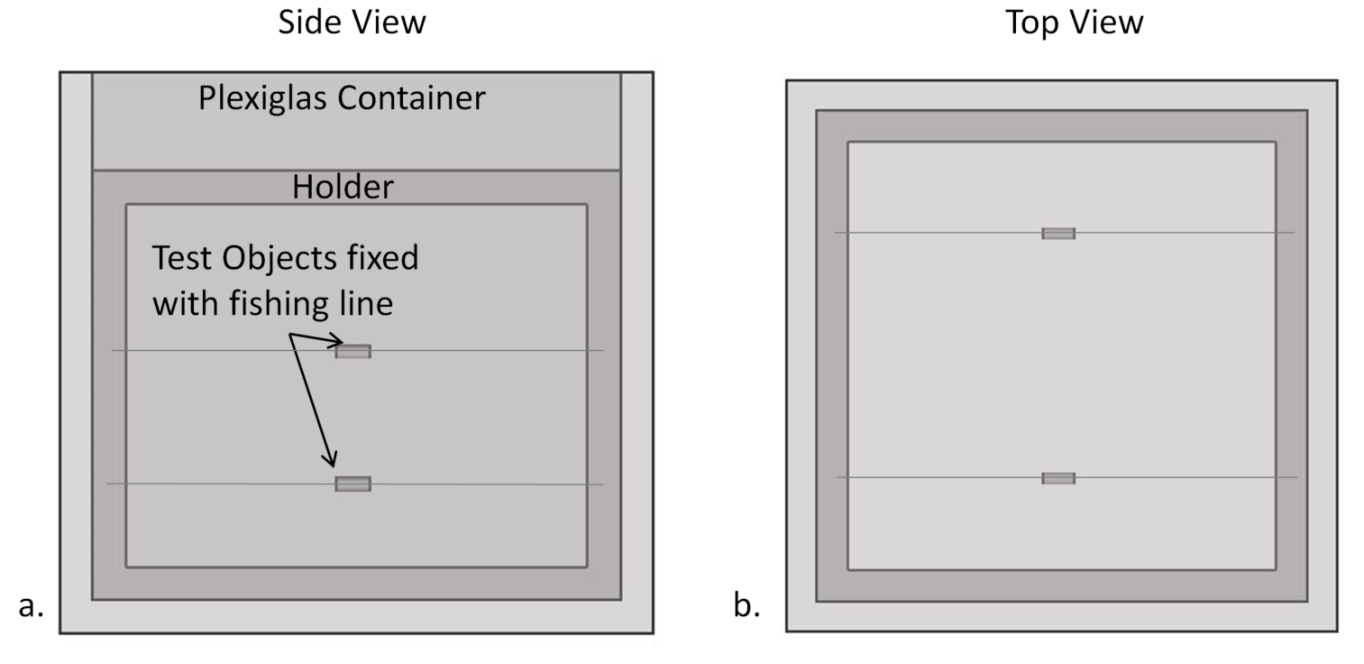
Simulations and Measurements:The general validation procedure of the numerical approach included the same set of MR imaging sequences and test configurations according to ASTM F2119. Two rods (15 x 3 mm2), made of titanium and stainless steel, were chosen as test objects (TO) to simulate and measure the MR image artifacts (Figure 1). The TOs were aligned parallel and perpendicular to the longitudinal axis of the static magnetic field. Additionally, images were acquired in two orthogonal slice orientations at the center of the phantom with gradient and spin echo sequences specified in ASTM F2119 [1]. This allowed comparing the artifacts between simulations and measurements in terms of shape and size. The simulations were performed with a self-developed framework using JEMRIS [2, 3], which is a numerical simulation tool based on the Bloch equation. The simulations and MR measurements were performed at three different magnetic field strengths (1.5 T, 3 T and 7 T).
Data evaluation:
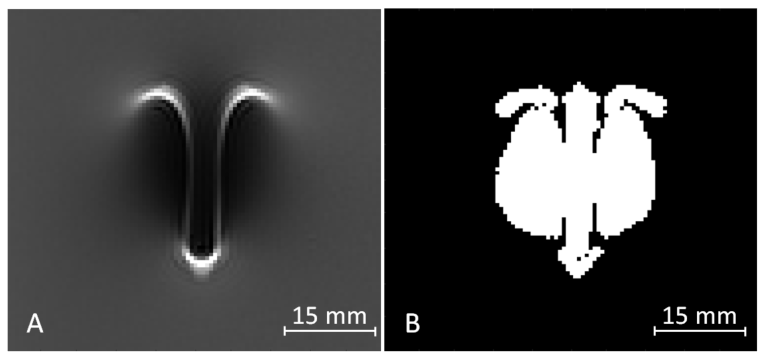
The evaluation of the artifact size was performed according to ASTM F2119. This standard defines artifacts as all pixels with a signal change of more than 30% compared to a reference image without the test object. An example of a simulated artifact and the calculation of the resulting artifact size is shown in Fig. 2. For validating the numerical simulation, the artifact size and shape were compared between measured and simulated artifact images. The artifact size evaluation compared the number of artifact related pixels between simulation and measurement. The shape of the artifacts was evaluated by overlaying the simulated and measured artifact images. The similarity between simulation and measurement was characterized by the overlapping pixels in relation to all artifact related pixels.
Results
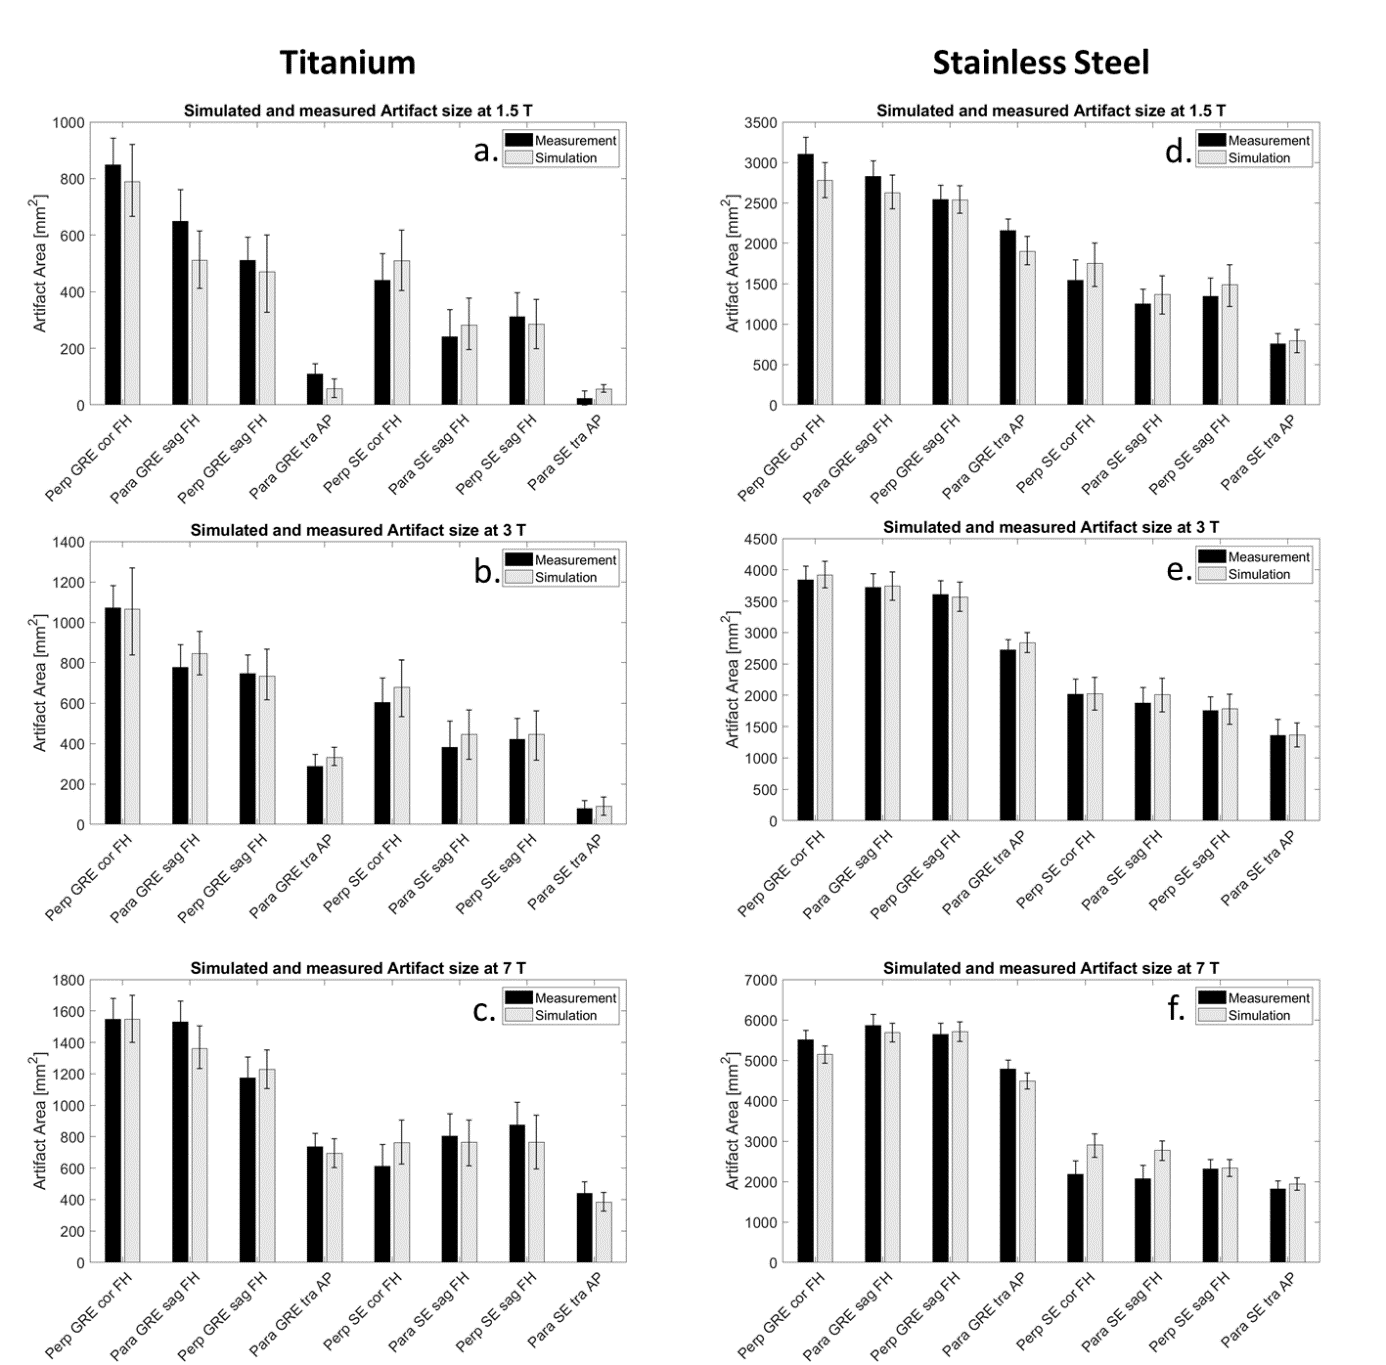
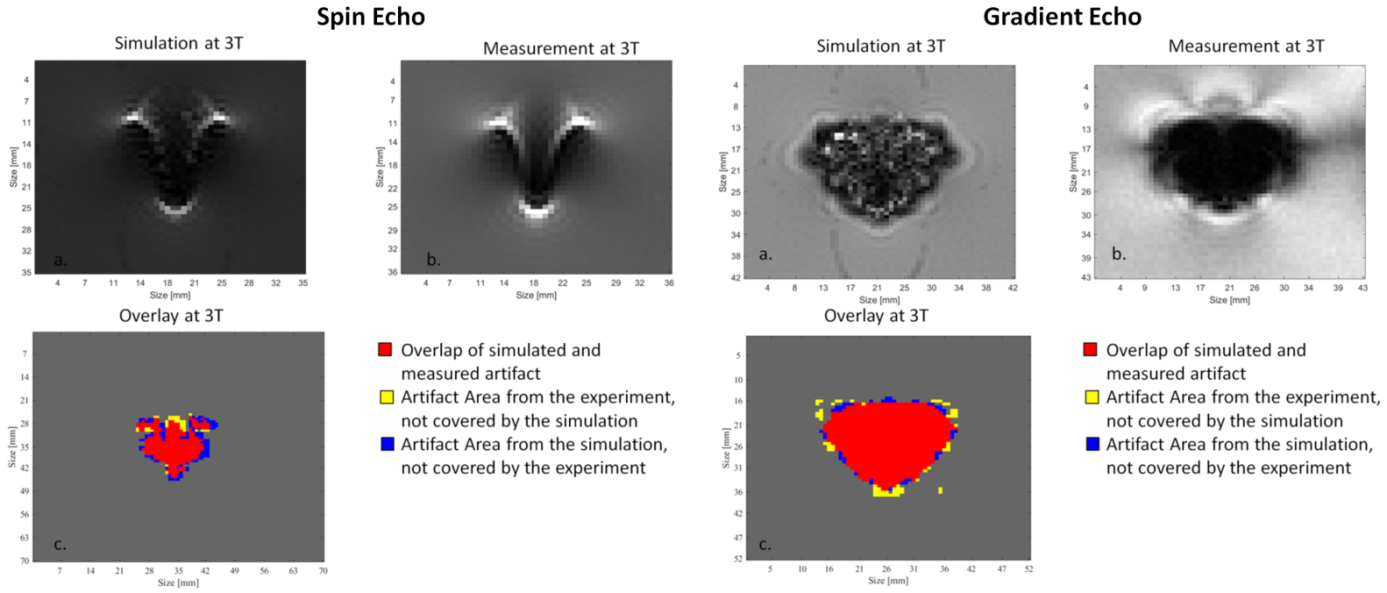
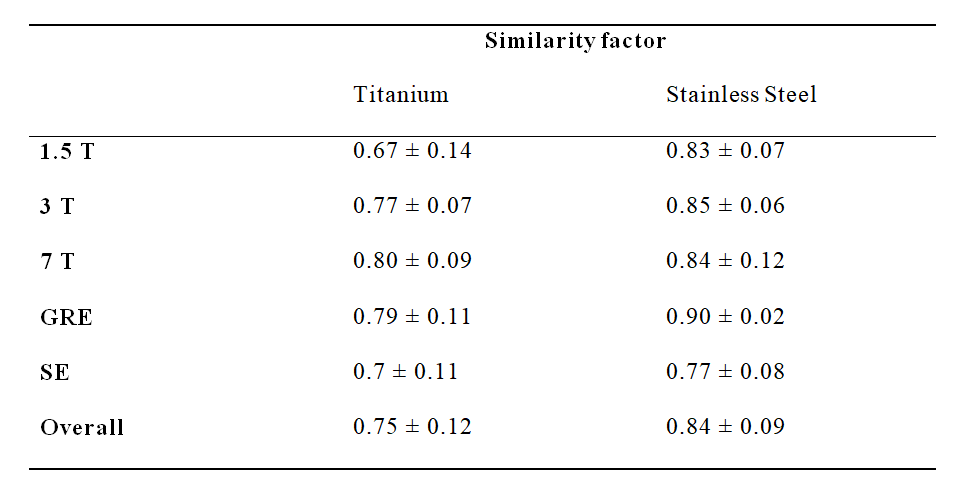
Figure 3 shows that the simulated artifact area corresponds well with the measured artifact area, and the difference between simulated and measured artifact sizes is within the measurement uncertainty. Only the test configuration of the spin echo image at 7 T with parallel and perpendicular TO orientation has a slightly larger deviation (C. and F.). The second validation approach compared the shape of the simulated and measured artifacts. Figure 4 presents the simulated and measured artifacts for the spin echo and the gradient echo sequence at 3 T. Nearly identical shape and size of the artifact for the simulated and measured images was obtained. Within these images, the percentage of overlapping pixels (red area in fig 4) was 85% for the spin echo and 95% for the gradient echo image. To compare the artifact shapes over all the different configurations, the percentage overlap was calculated for all configurations and then averaged, as shown in Figure 5. Whereas the superimposed artifacts of the gradient echo have a high congruence of the simulated and measured images with a similarity factor of 0.85, the spin echo overlay shows lower congruence of the two artifacts with a slightly lower similarity factor of 0.79.Discussion
In the first part of the investigation, simulations and MR measurements were compared to demonstrate that the simulation tool provides realistic results. For this purpose, simulated images were overlaid with measured MR images. This evaluation demonstrates that the artifact size and shape of the simulated artifacts is very similar to the measured artifacts. The pixel-wise comparison of the simulated and measured images shows that the artifacts match in shape as well as in size with an overall similarity of 80 % for all testing configurations and field strengths. One challenge of the numerical approach is the determination of the exact susceptibility of materials used for simulations. Especially the susceptibility of stainless steel can fluctuate substantially between different TOs because of the varying compositions of the steel alloy (iron, chromium, nickel). Without an exact determination of the susceptibility, a realistic simulation is not possible. However, this is mainly an obstacle for clinical staff as for the vendor of implants the exact material properties should be known.Conclusion
This work presents a powerful tool to improve the MR image artifact testing procedure of passive medical implants. With the help of this tool much more extensive artifact investigations could be performed, which would otherwise only be possible with a large measurement effort on MRI systems.Acknowledgements
No acknowledgement found.References
[1] ASTM F2119 - F04 Committee, Test Method for Evaluation of MR Image Artifacts from Passive Implants-, ASTM International, West Conshohocken, PA.
[2] T. Stöcker, K. Vahedipour, D. Pflugfelder, and N. J. Shah, ‘High-performance computing MRI simulations’, Magnetic Resonance in Medicine, vol. 64, no. 1, pp. 186–193, Jul. 2010.
[3] Marques J P, Bowtell R, Application of a Fourier-based method for rapid calculation of field inhomogeneity due to spatial variation of magnetic susceptibility, Concepts Magn. Reson. 25B (2005) 65–78.
Figures