3529
Effects of Phase-Encoding Directions on Diffusion MRI Reproducibility1QMI, NIBIB/NIH, Bethesda, MD, United States
Synopsis
In this study, we report on the reproducibility of DTI-derived metrics w.r.t. the phase-encoding directions (PED) used for the acquisition of diffusion weighted images. Over the entire brain, the reproducibility of DTI metrics was higher for data acquired using LR/RL phase-encoding directions. However, AP/PA data showed better reproducibility in some regions. The main source of these reproducibility variations was identified as ghosts overlapping with different brain regions depending on PED. We conclude that acquiring data with all four phase-encoding directions would be the most beneficial to achieve maximum reproducibility in all brain regions after proper editing of regionally corrupted data.
Introduction
Obtaining accurate and reproducible diffusion MRI (dMRI) results is challenging given that diffusion weighted images (DWIs) are susceptible to artifacts, such as ghosting, Gibbs ringing, signal drops, and misalignments due to motion and eddy-currents distortions [1]. Additionally, DWIs also suffer from geometric distortions and signal expansions/contractions along the phase-encoding direction. These "EPI distortions" have been shown to have a significant impact on dMRI reproducibility [2]. Advanced processing pipelines effectively remove most of the distortion related artifacts, however, residual uncorrected distortions in regions of high susceptibility and artifacts due to ghosts are still present in the data. Given that the locations of such artifacts depend on the phase-encoding direction (PED) of the acquisition, data acquired with different PEDs can be hypothesized to present a different regional accuracy and reproducibility pattern of quantitative dMRI metrics. In this work, we analyze the effects of phase-encoding directions on the reproducibility of diffusion tensor (DTI) [3] metrics and aim to determine whether a specific PED is superior to others both globally and locally in pre-selected gray matter (GM) and white matter (WM) regions-of-interests.Materials
Datasets: Diffusion MRI data was collected from seven subjects, five times, using a Philips Achieva 3T system. Acquisition parameters were: TE/TR: 92/12875ms, SENSE=2, res=2mm isotropic. For each phase-encoding direction anterior-posterior (AP), PA, left-right (LR), and RL, 21 DWI volumes were acquired with the maximum b-value of 1100 s/mm2. A fat-suppressed T2W-TSE and a T1W-MPRAGE image were also acquired.Processing: DWI pre-processing was performed separately for each PED dataset using the TORTOISE pipeline [4]: Gradient-nonlinearities were corrected first, followed by Gibbs-ringing correction [5], motion & eddy-currents [6] and susceptibility distortion correction [7]. All DWIs were rigidly aligned to the T2W structural of the first scan session and were output at 1mm isotropic resolution. The diffusion tensor (DT) was calculated for each dataset, and fractional anisotropy (FA) and Trace (TR) maps were derived from each DT.
Variability analysis: For each subject, for each PED, reproducibility between the five visits was assessed by calculating the voxelwise standard deviations for both FA and TR. To summarize these statistics in the same space for all subjects, a diffusion tensor based registration [8] was performed on the DTI data from all subjects and a population template space was generated. All the individual standard deviation maps were subsequently warped on to the population template space and averaged over the subjects to get a population level summary statistic. These population-level standard deviation maps were visually and quantitatively examined to determine the existence of any PED patterns for both FA and TR.
GM regions-of-interest (ROIs) defined on the IIT atlas [9] and WM ROIs defined on the Desikan atlas [10] were warped onto our template space. For each ROI, the average standard deviations were computed for each PED to generate a population-level, ROI specific reproducibility statistic. Subsequently, these statistics were fed onto a K-means clustering algorithm that generated a "more reproducible" and a "less reproducible" cluster which objectively determined whether any PED was superior to the others.
Results
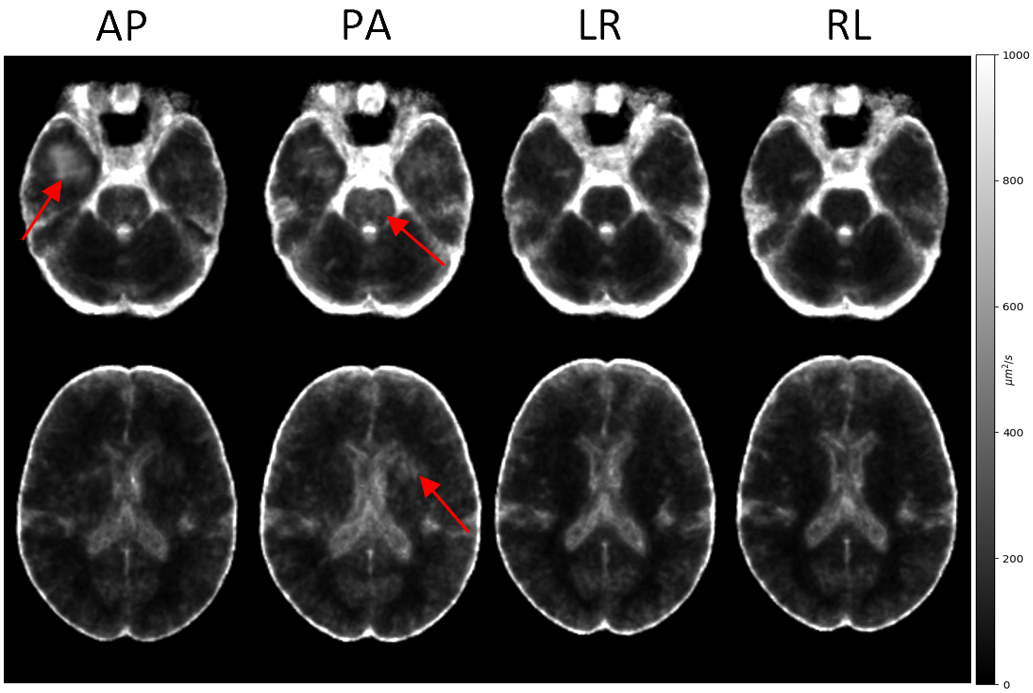
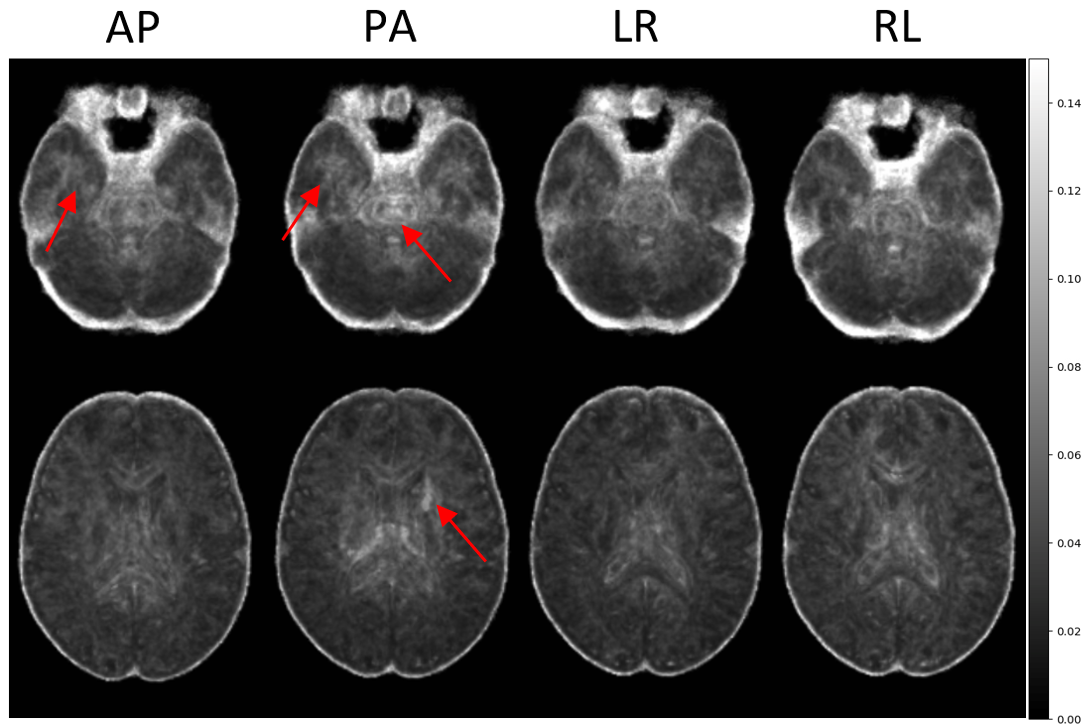
Figure 1 displays the population-level variability maps for each PED at two slice levels for TR. As seen in the figure, reproducibility is dependent on the PED, and regionally varying. The high variability in the temporal lobes with PA PED is due to the ghosts of the eyes reflecting themselves into this region.Figure 2 displays the population-level variability maps for each PED at two slice levels for FA. The regional effects on PED-related variability can be observed also for FA although with a spatial distribution not fully overlapping with that of TR.
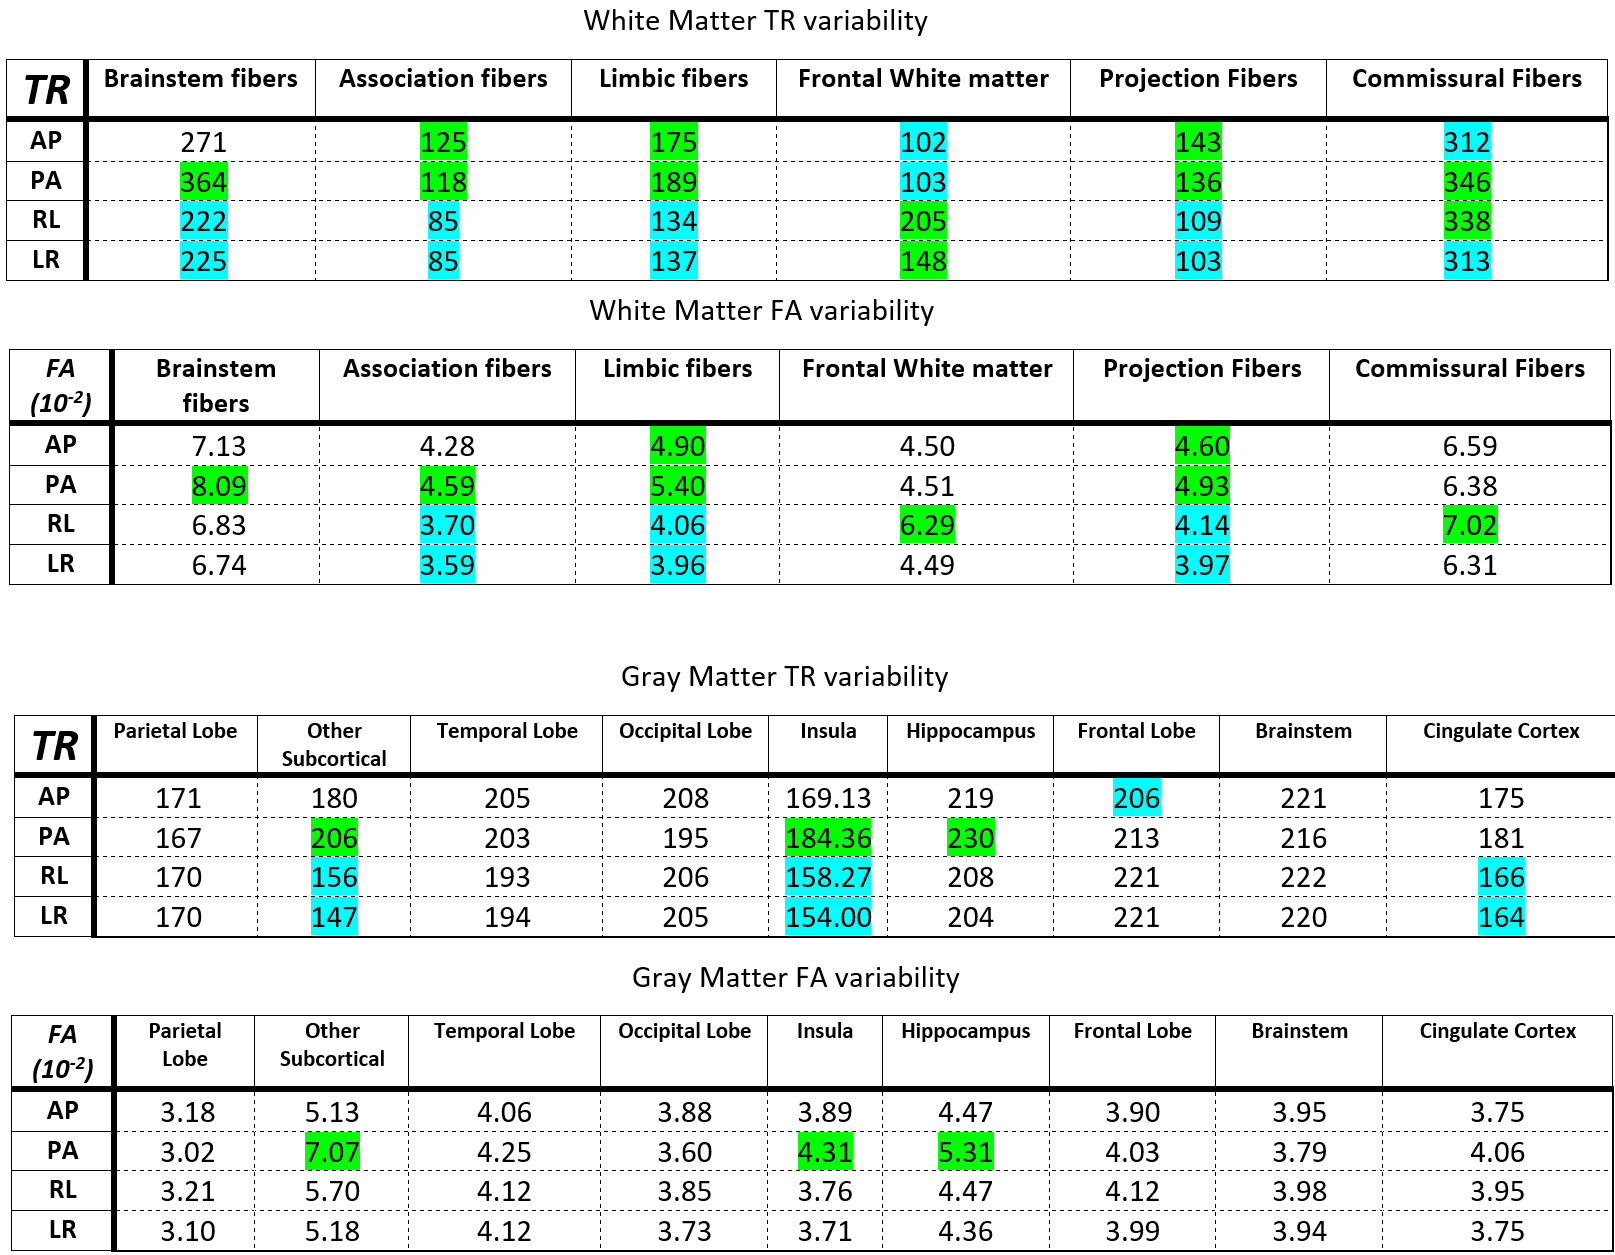
Figure 3 shows the tables that display the variability of the phase-encoding directions for each WM and GM ROI in both TR and FA. As observed in the table, certain PEDs had significantly lower variabilities (LR and RL in Association Fibers WM for FA) while others had significantly higher variabilities (PA in Brainstem Fibers WM for TR).
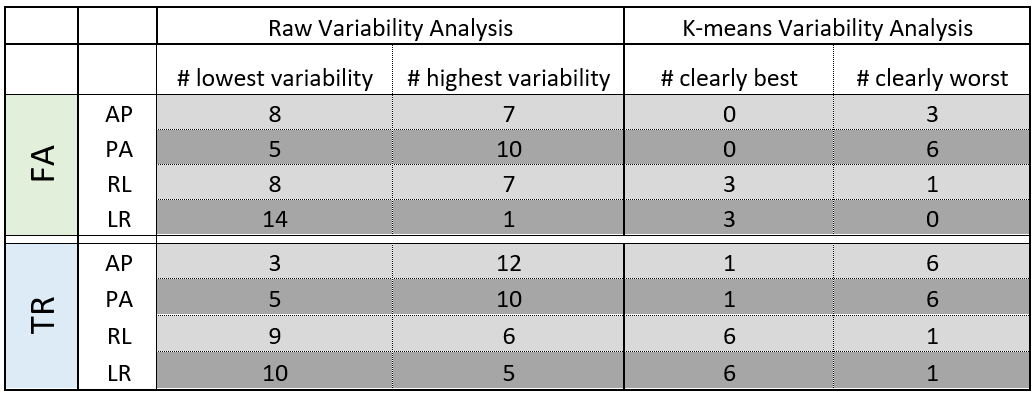
Figure 4 shows the summary statistics noting which PED had the raw lowest variability and whether the k-means cluster centroids indicated a significant reproducibility difference. For both FA and TR, there was an observable trend that LR/RL PEDs tended to have a lower variability than AP/PA, as shown by the number of times that the LR/RL PEDs had lower variability when compared to AP/PA. In the raw variability analysis, the LR data had the highest average reproducibility, while PA had the lowest. Still, the PA data showed that there were a total of five ROIs in which it had the highest reproducibility. For the k-means variability analysis, metrics computed from LR/RL data were 6 times more likely to have lower variability than those computed from AP/PA data.
Conclusion
Our examinations indicated that dMRI metric reproducibility depended on the phase-encoding direction of the acquisition, but to a different degree for different ROIs. For the whole-brain, LR or RL PEDs generated more reproducible data. For specific ROIs, the best PED changed with respect to the position of the ROI in the brain. Therefore, in order to achieve a high level of reproducibility in all brain regions, an acquisition scheme utilizing all four PEDs would be beneficial.Acknowledgements
This research was supported by the Intramural Research Program of the National Institute of Biomedical Imaging and Bioengineering and National Institute of Neurological Disorders and Stroke in the National Institutes of Health. The contents of this work do not necessarily reflect the position or the policy of the government, and no official endorsement should be inferred. The authors would also like to thank Susan Fulton and Steven Newman for their efforts in subject recruitment.References
1. Pierpaoli C. Artifacts in Diffusion MRI. In: Jones DK, editor. Diffusion MRI: Theory, Methods, and Applications Oxford University Press; 2010.
2. Wu M, Chang LC, Walker L, Lemaitre H, Barnett AS, Marenco S, Pierpaoli C., Comparison of EPI Distortion Correction Methods in Diffusion Tensor MRI Using a Novel Framework. Proceedings of MICCAI 2008;11:321–329.
3. Basser PJ, Mattiello J, Le Bihan D. Estimation of the effective self-diffusion tensor from the NMR spin echo. Journal of Magnetic Resonance 1994;103:247–254.
4. Pierpaoli C, Walker L, Irfanoglu MO, Barnett AS, Chang LC, Koay CG, et al. TORTOISE: An integrated software package for processing of diffusion MRI data. In: Proceedings of International Society of Magnetic Resonance in Medicine; 2010. p. 1597.
5. Kellner E, Dhital B, Kiselev VG, Reisert M. Gibbs-ringing artifact removal based on local subvoxel-shifts. Magnetic Resonance in Medicine 2016;76(5):1574–1581.
6. Rohde GK, Barnett AS, Basser PJ, Marenco S, Pierpaoli C. Comprehensive approach for correction of motion and distortion in diffusion weighted MRI. Magnetic Resonance in Medicine 2004;51(1):103–14.
7. Irfanoglu MO, Modi P, Nayak A, Hutchinson EB, Sarlls J, Pierpaoli C. DR-BUDDI: (Diffeomorphic Registration for Blip-Up blip-Down Diffusion Imaging) method for correcting echo planar imaging distortions. Neuroimage 2015;106:284–289
8. Irfanoglu MO, Nayak A, Jenkins J, Hutchinson EB, Sadeghi N, Thomas CP, et al. DR-TAMAS: Diffeomorphic Registration for Tensor Accurate Alignment of Anatomical Structures. NeuroImage 2016;132:439 – 454
9. Zhang, S. & Arfanakis, K. Evaluation of standardized and study-specific diffusion tensor imaging templates of the adult human brain: Template characteristics, spatial normalization accuracy, and detection of small inter-group FA differences. Neuroimage 172, 40–50
10. Desikan, R. S. et al. An automated labeling system for subdividing the human cerebral cortex on MRI scans into gyral based regions of interest. Neuroimage 31, 968–980
Figures