3528
Automatic detection of “fat suppression-like” artifacts in brain diffusion MRI1CIMeC, University of Trento, Trento, Italy, 2Department of Radiology, G.B. Rossi Hospital, University of Verona, Verona, Italy
Synopsis
Brain diffusion MRI data may present unpredictable artifacts like those related to insufficient fat suppression. Given the quantity of data collected in state-of-the-art diffusion protocols, such artifacts are challenging to detect by visual inspection. In this study, we implemented and tested an automated method that helps to detect such artifacts, identifying the slice(s) where they are present. The method is based on the automated generation of the shape of the artifact from the skull at each slice and subsequent search of the pattern in the diffusion data. The method gave high specificity (0.977) and sensitivity (0.889).
Introduction
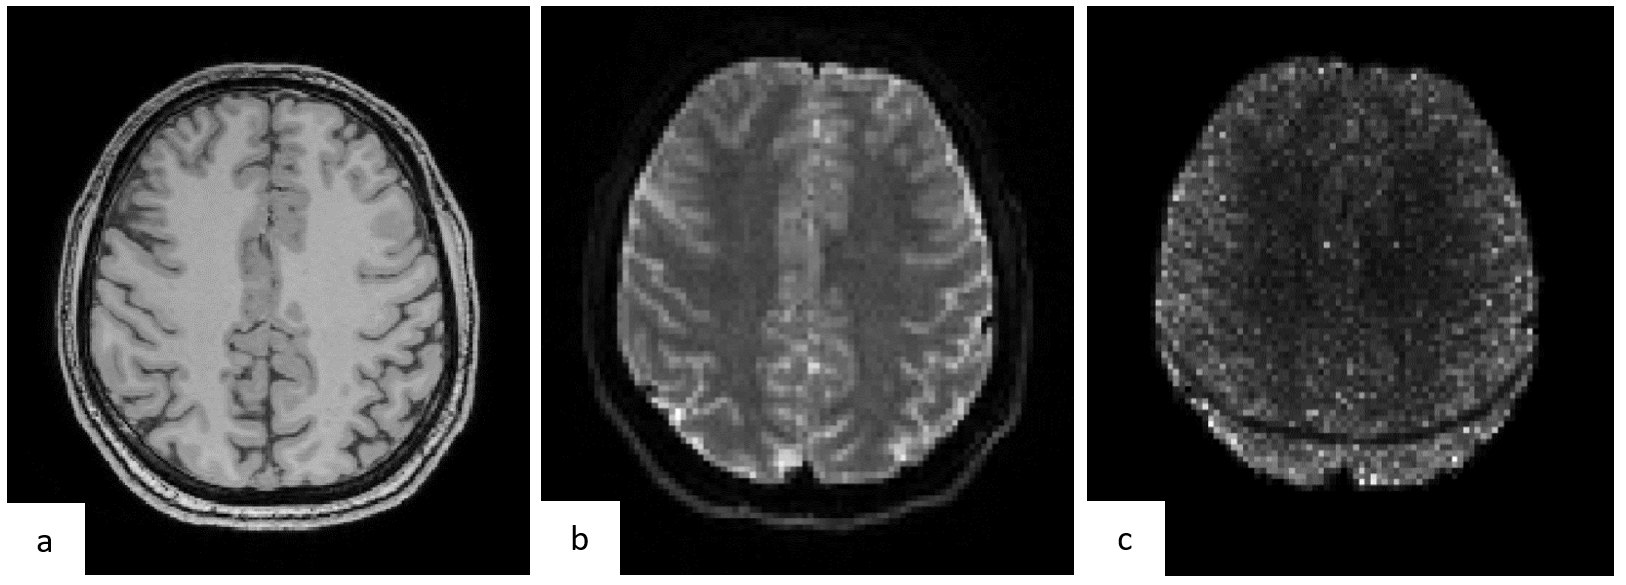
Automated Quality Control (QC) routines are extremely useful to speed up the screening of large imaging data, as those obtained from brain diffusion MRI protocols. These multidimensional datasets, possibly comprising multishell acquisition and relatively high-resolution whole brain coverage can easily exceed several tenths of images, which translates into a non-negligible effort for visual quality check. In this context, we designed an automated tool to detect a feature that closely resembles a “fat suppression” artifact1, in combination with Simultaneous Multi Slice (SMS) technique. This C-shaped artifact (Fig.1) does not emerge in single b=0 images but only in second-level outputs of standard QC-pipelines, such as tSNR or residual maps of fitting algorithms. Furthermore, this feature doesn’t involve the entire volume but may appear in a subset of slices. Given the unpredictability of the artifact, it is necessary to develop an automatic detection tool that can easily complement existing QC-pipelines.Materials and Methods
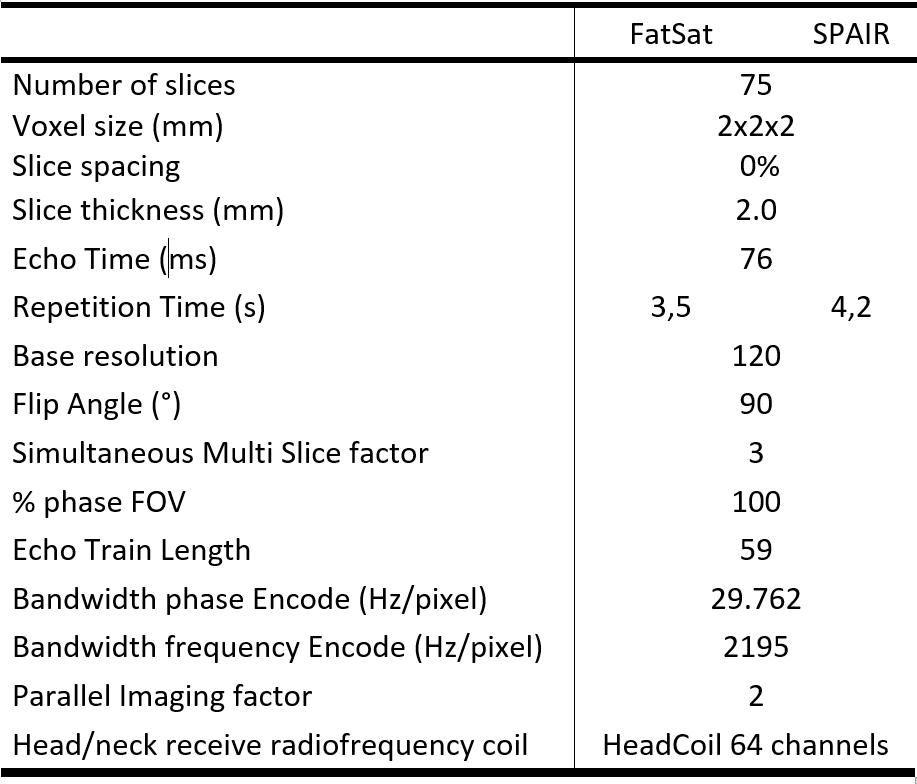
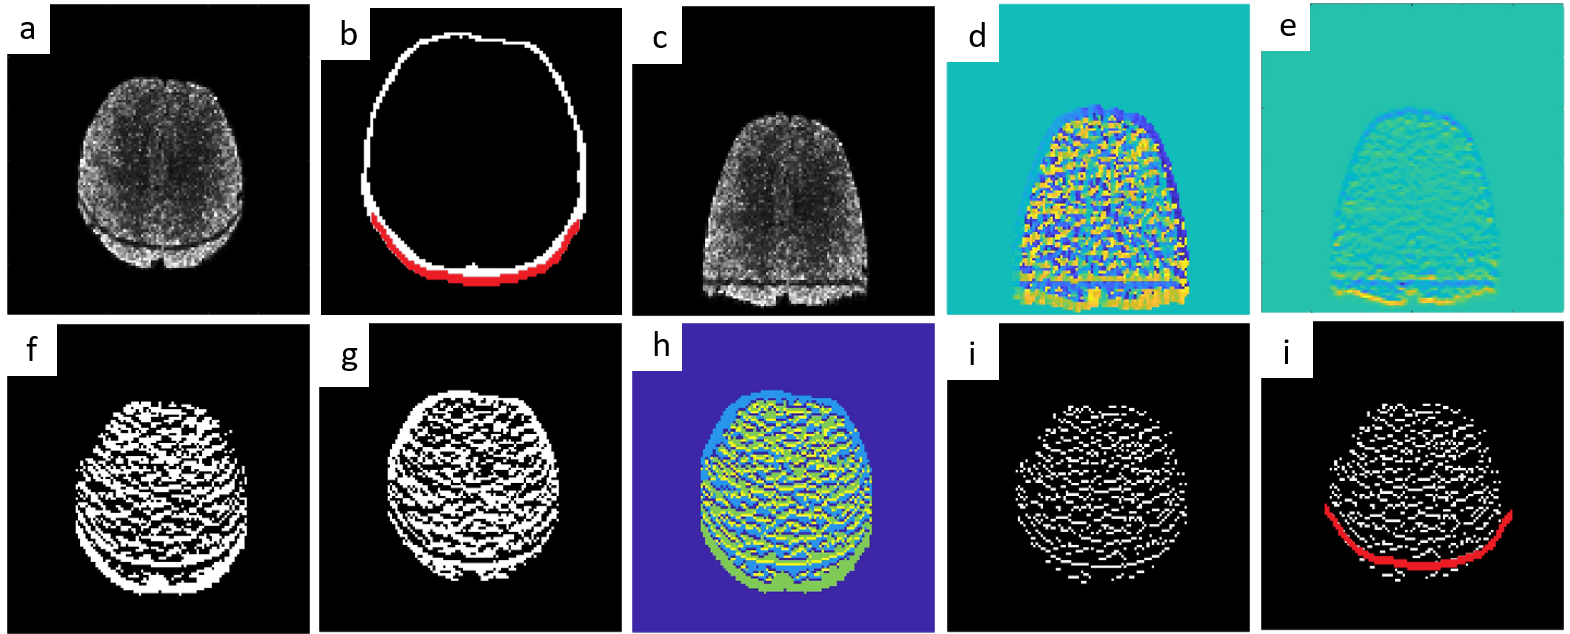
Images were acquired with a clinical 3T scanner (MAGNETOM Prisma, Siemens Healthcare, Erlangen, Germany) using a 64-channel head/neck receive coil, with core parameters summarized in Table 1. Diffusion images were pre-processed through a custom FSL EDDY/EDDY-QC2,3 pipeline. After visual inspection of the temporal signal-to-noise ratio (tSNR) maps (derived from 10 concatenated b=0 s/mm2, b0, volumes) and its standard deviation, the artifact appeared as a rim of tSNR loss at a rather constant offset from the outer edge of the skull (Fig. 1). This offset roughly matches the peculiar 440Hz of fat-water frequency shift at 3T. Moreover, its shape mimics the subcutaneous fat-water interface close to the skull. The artifact detection tool was tested on diffusion MRI data from 5 subjects, with a total of 19 different tSNR maps derived from acquisitions with different fat suppression settings. In order to verify the previous assumptions, we designed an image processing pipeline summarized in Fig. 2. The skull binary mask of each subject was calculated on b0 images using FSL’s BET tool4,5 and applied to tSNR maps (Fig. 2a). With this information, a MATLAB script was developed to process the data in a slice-wise looping structure. In the first step we extracted the posterior edge of the skull mask (Fig. 2b, white line) (lately used as template) and the relative offset of every voxel, calculated from the outer edge in the template (Fig. 2b, red line). This information was used to apply a linear backward shift of the corresponding line in the image space. The straightening filter returns an image where the artifact results as an horizontal line (Fig. 2c). This improves the calculation of the image gradient and its associated direction (Fig. 2d-e), which are then merged with a postero-anterior shift of 1 pixel to highlight the borders (Fig. 2f-h). This new map of gradient change information is necessary to highlight the tSNR intensity drop, along with other unstructured clusters of rapidly-changing tSNR (Fig. 2i). Finally, the tool calculates the Dice index (DI), which is indicative of the spatial similarity of two images [0: no overlap; 1: perfect pixel-by-pixel match], by iteratively shifting the template over the merged gradient image (Fig. 2j).Results and Discussion
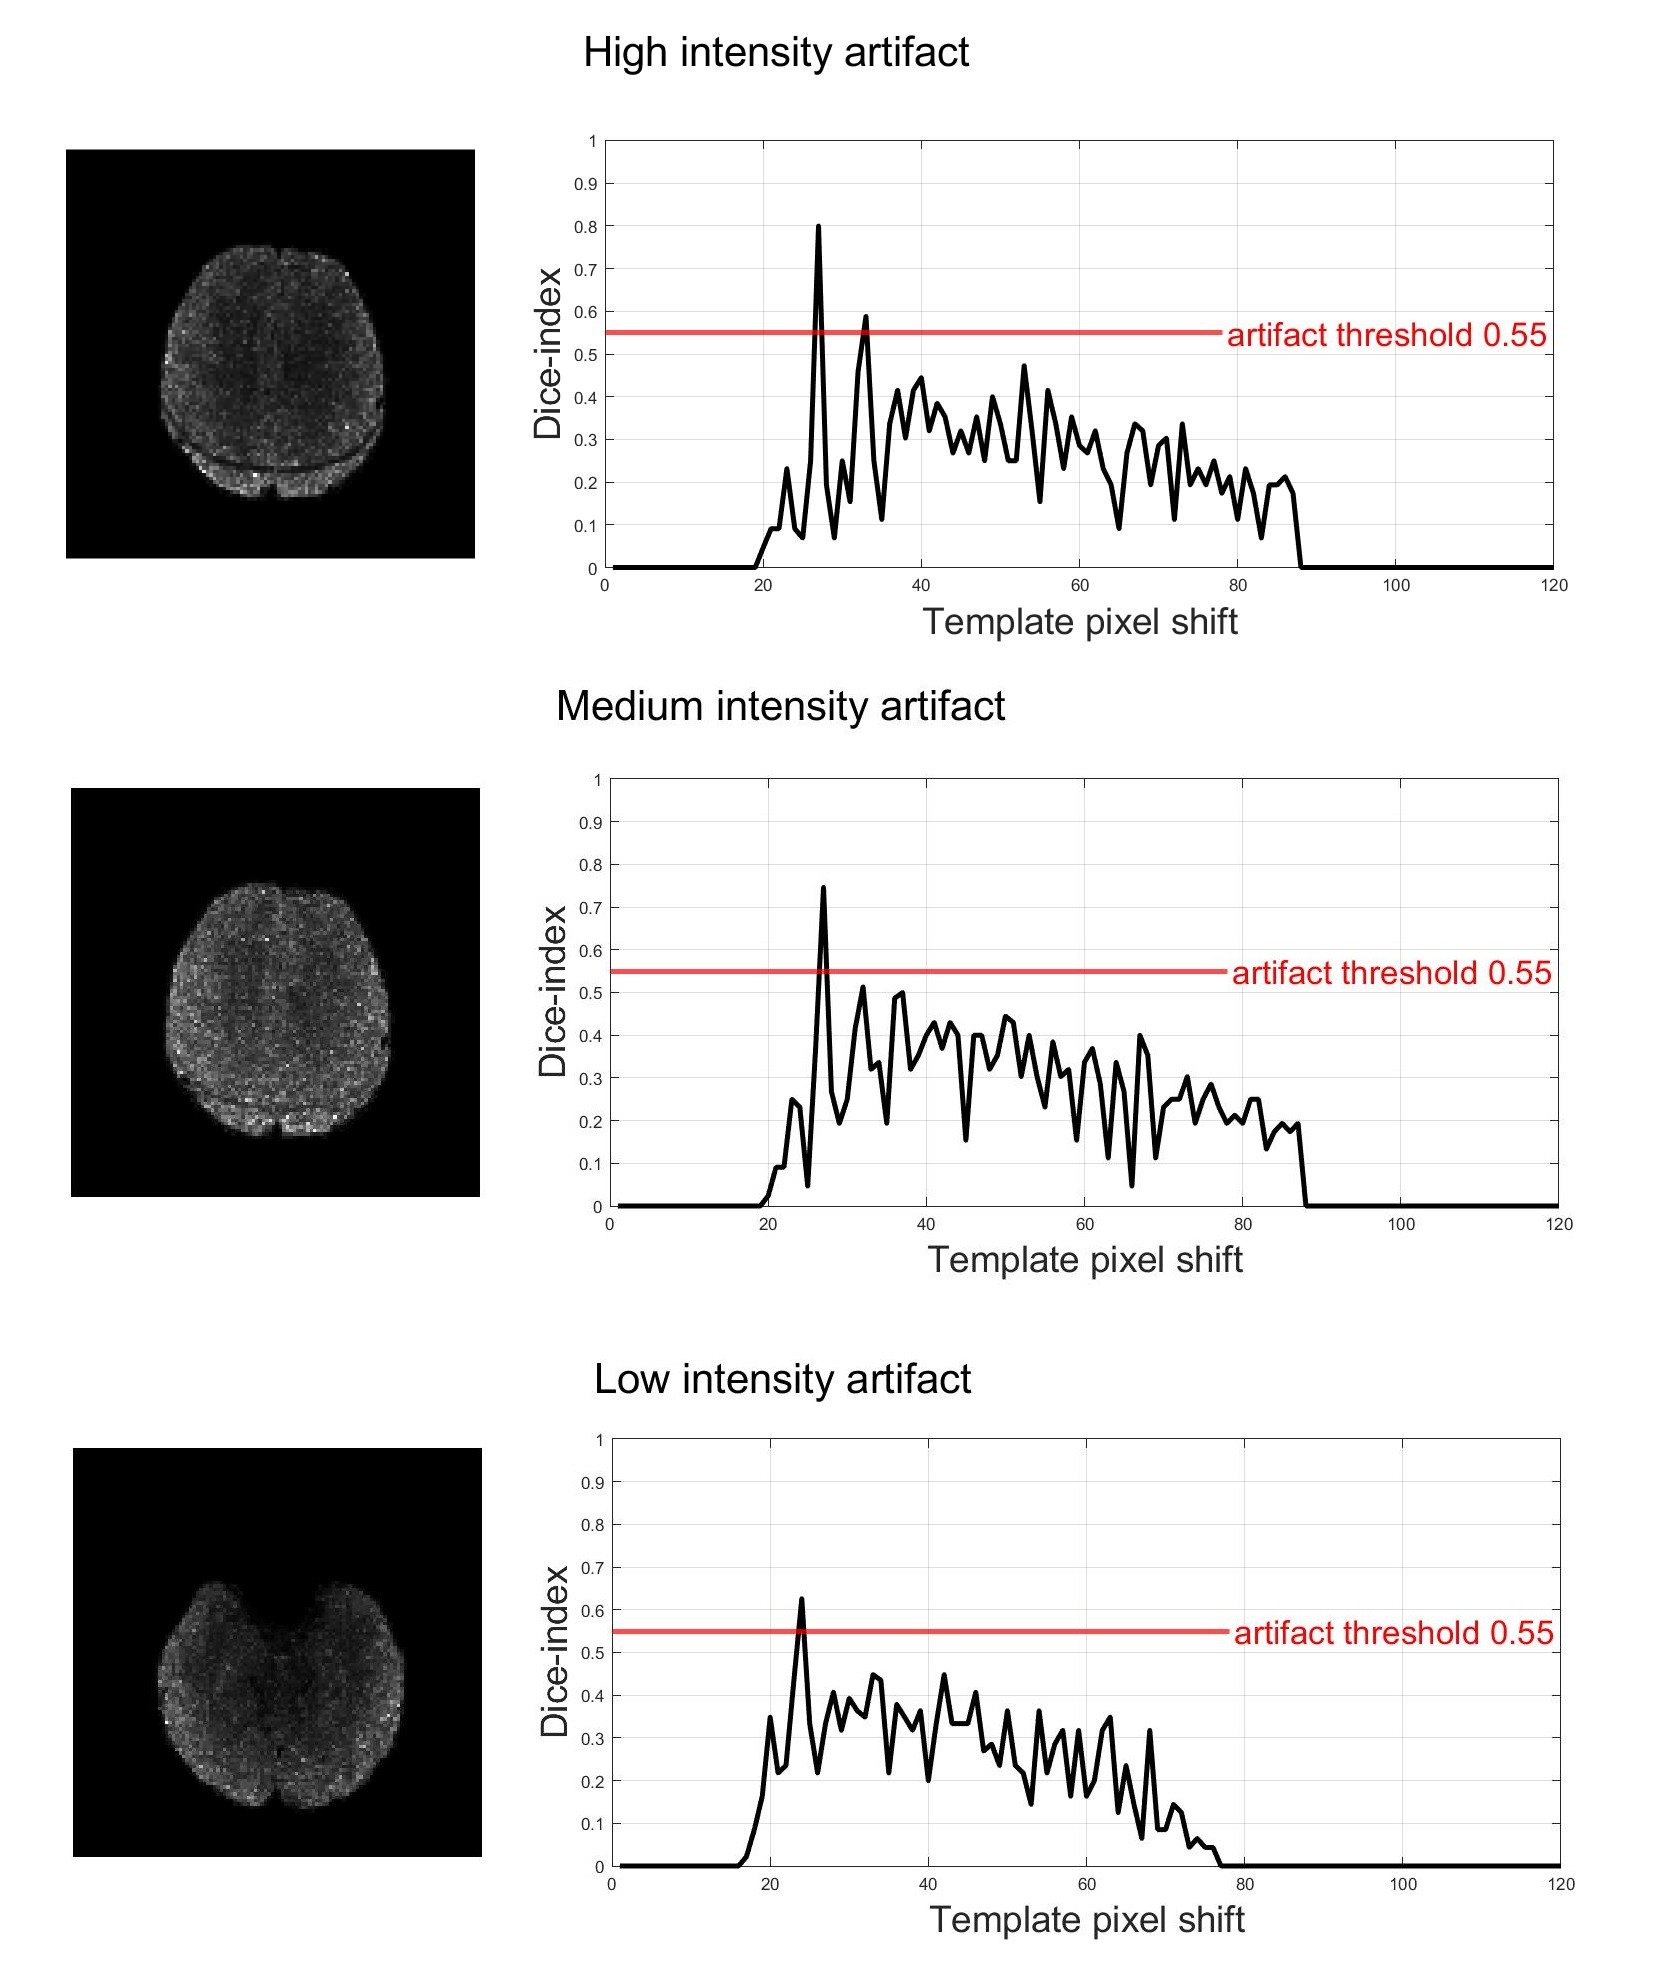
The tool was tested to recognize 3 levels of artifact intensity (high, medium, low) regardless of the sequence used. Representative results are reported in Fig. 3. When the artifact is predominant, with a clearly visible decrease in tSNR, the DI exceeds 0.8. In presence of an artifact of medium and low intensity, the DI ranged from 0.65±0.05 and 0.5±0.05, respectively. It is worth to notice that the image straightening filter improves DI of more than 15% in situations of mild artifact and about 5% in situations of medium-high intensity artifact, effectively enhancing the sensitivity of the automatic detection.Comparing these outcomes with visual evaluations, we found the specificity and sensitivity values reported in Table 2 and here summarized, respectively, for different artifact levels: high (1, 0.8), medium (0.945, 1) and low intensity (0.986, 1). Regarding the time-efficiency, when executed on a consumer laptop, the output is produced in less than 4 seconds for a whole-brain volume. These preliminary results are probably biased by the limited set of data considered to benchmark the performances. A more robust estimation of the tool’s performance requires extensive evaluation on a larger sample with significantly higher variability of protocols and pulse sequence parameters.Conclusions
This study proposes a tool that automatically detects artifacts as those related to poor fat-suppression in diffusion MRI data. The tool exploits a combination of spatial filtering and template matching methods. Preliminary results are promising, with overall high specificity (0.977) and sensitivity (0.889). Future improvements are under development to test a larger data sample, to consider a wider range of quality control metrics, and to facilitate its implementation as an optional module in existing quality control tools. Our work was focused on artifact detection not only to contribute to quality assurance but also to help the study of artifact sources and their relation to image sequences and parameters.Acknowledgements
No acknowledgement found.References
1. Tournier J.‐D., Mori S. and Leemans A. Diffusion tensor imaging and beyond. Magn. Reson. Med. 2011; 65:1532-1556.
2. Andersson JLR, Sotiropoulos SN. An integrated approach to correction for off-resonance effects and subject movement in diffusion MR imaging. Neuroimage . 2016;125:1063–78.
3. Jenkinson M, Beckmann CF, Behrens TEJ, et al. Neuroimage . 2012;62(2):782–90.
4. Smith SM. Fast robust automated brain extraction. Hum Brain Mapp. 2002;17(3):143–55.
5. Jenkinson M, Pechaud M, Smith S. BET2-MR-Based Estimation of Brain, Skull and Scalp Surfaces. Hum Brain Mapp . 2002;17(2):143–55.
Figures