3520
Brain Gray Matter Nuclei Segmentation on Quantitative Susceptibility Mapping using Convolutional Neural Network1Department of Radiology, Tianjin First Central Hospital, Tianjin Medical Imaging Institute, School of Medicine, Nankai University, Tianjin, China, 2Tianjin Key Laboratory of Optoelectronic Sensor and Sensing Network Technology, College of Electronic Information and Optical Engineering, Nankai University, Tianjin, China, 3Department of Radiology, Tianjin First Central Hospital, School of Medicine, Nankai University, Tianjin, China, 4Department of Radiology, Wayne State University, Detroit, MI, United States, 5DUT-RU International School of Information Science and Engineering, Dalian University of Technology, Dalian, China
Synopsis
This study focused on developing an automatic gray matter nuclei segmentation method. A 3D convolutional neural network based method was proposed, which adopted patches with different resolutions as input for segmentation. Experimental results showed much higher segmentation accuracy over the atlas-based method and other deep-learning-based methods in terms of both the similarity and the surface distance metrics. The segmentation results of the proposed method is also evaluated in terms of measurement accuracy, where the proposed method achieves the highest consistency with the manual delineations.
Introduction
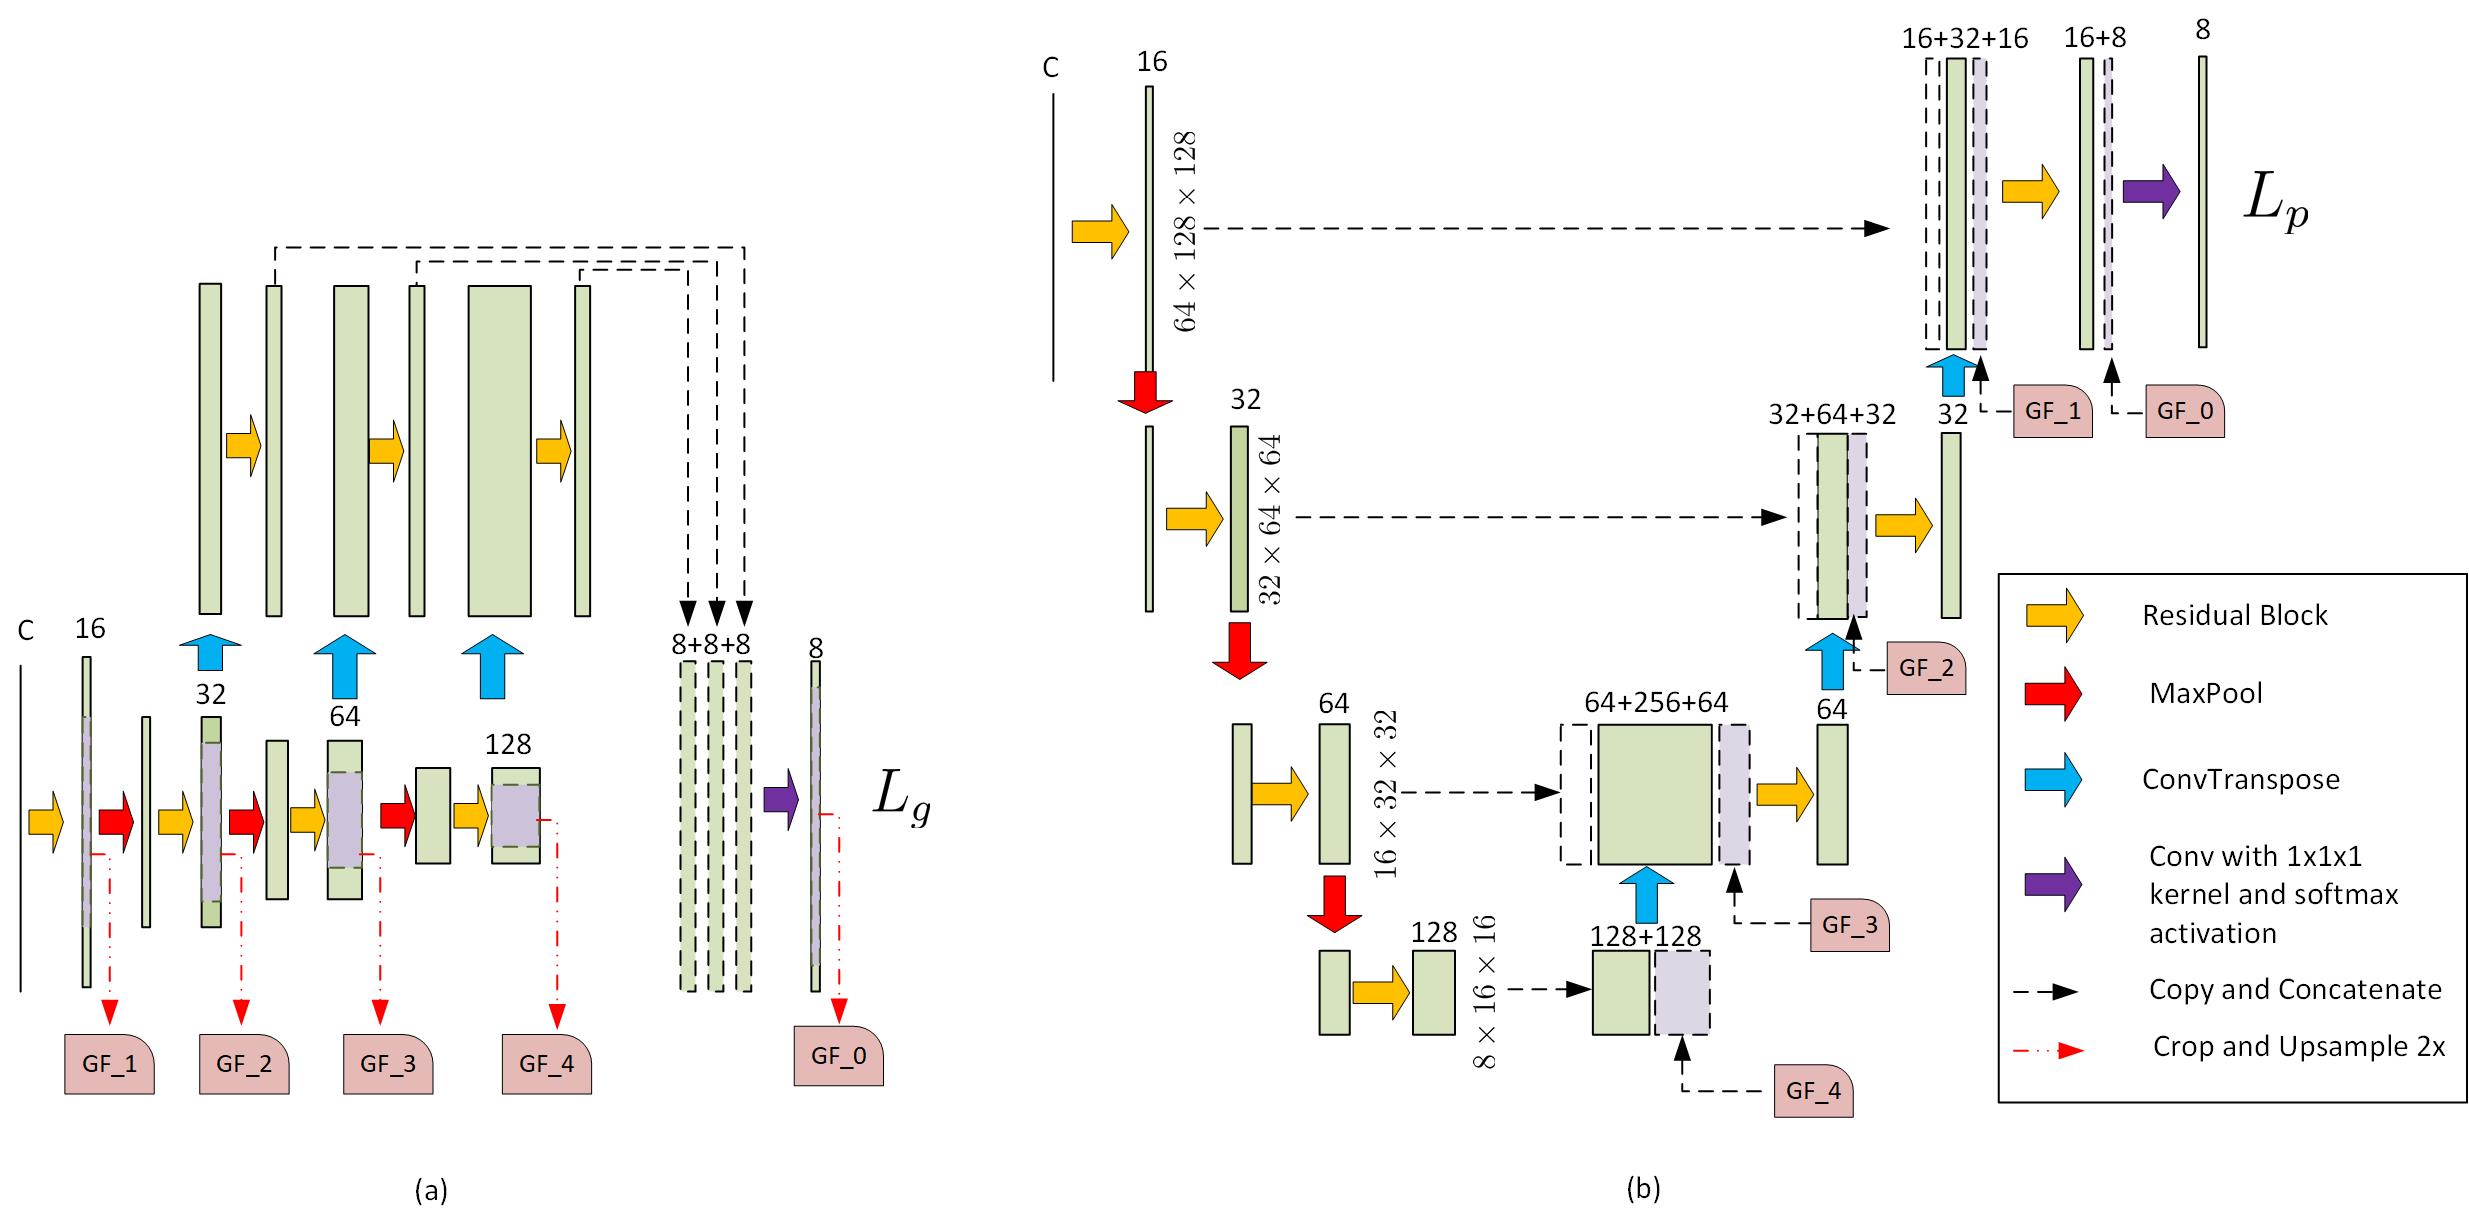
It has been reported that focal abnormal iron accumulation in brain gray matter nuclei has been observed in various neurodegenerative diseases, which can be measured with the magnetic susceptibility from the quantitative susceptibility mapping (QSM). To quantitatively evaluate the magnetic susceptibility, the brain nuclei of interest were manually delineated and measured, which is a tedious task for clinicians. This paper proposes an automatic way to segment brain gray matter nuclei, including caudate nucleus (CN), globus pallidus (GP), putamen (PUT), thalamus (THA), substantia nigra (SN), red nucleus (RN), and dentate nucleus (DN) based on convolutional neural network.Due to limited memory size, the images were usually cropped into patches before feeding to a 3D-CNN, which, however, lost many spatial contextual information and led to segmentation accuracy loss. In this paper, a double branch residual structured U-Net (DB-ResUNet), as shown in Figure 1, was proposed to utilize patches with two different resolutions to tradeoff the segmentation accuracy and the memory cost. The inputs of the two branches had the same matrix size of 128×128×64, with, however, different resolutions. The local branch adopted the patches cropped from the images of original resolution, while the global branch used patches cropped from downsampled images. Weighted cross entropy function was used, where the weights for background and the foreground were set to be 0.1 and 0.4, respectively. The network training was implemented using Pytorch version 1.0.
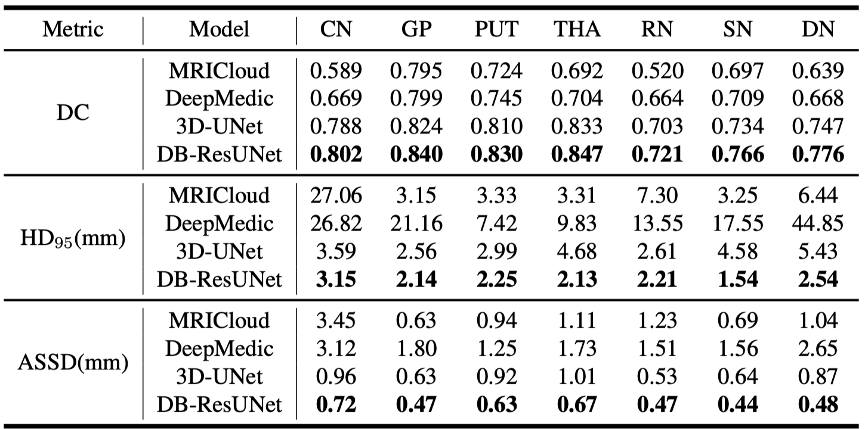
Dice coefficient (DC), 95% Hausdorff Distance (HD_{95}), and average symmetric surface distance (ASSD) were adopted as the evaluation metrics. In particular, the DC is defined as
DC=\frac{P\cap G}{|P|+|G|},
where P and G denote the predicted segmentation and the ground truth, respectively. P\cap G denotes the intersection between them, and | · | denotes the area. Denote the set of surface points of the predicted segmentation and the ground truth as A and B, respectively, the maximum Hausdorff distance (HD_{\max}) is defined as
HD_{\max}=\max\left(\max_{a\in A}\min_{b\in B}d(a,b), \max_{b\in B}\min_{a\in A}d(b,a)\right),
where d(a,b) denotes the Euclidean distance between points a and b . The HD_{\max} measures the maximum distance between two surfaces, which is, however, too sensitive to outliers. To exclude the influence of a very small subset of outliers, we adopted the HD_{95} for evaluation, which is based on the 95th percentile of distance between boundary points. The average symmetric surface distance (ASSD) denotes the average distance between the surface of the segmented object and the ground truth in 3D. To compute ASSD, the average surface distance (ASD) between the two surface point sets should be first computed as
ASD(A,B)=\frac{\sum_{a\in A}\min_{b\in B}d(a,b)}{|A|},
Then the ASSD were computed as
ASSD=\frac{1}{2}\left(ASD(A,B)+ASD(B,A)\right),
Results
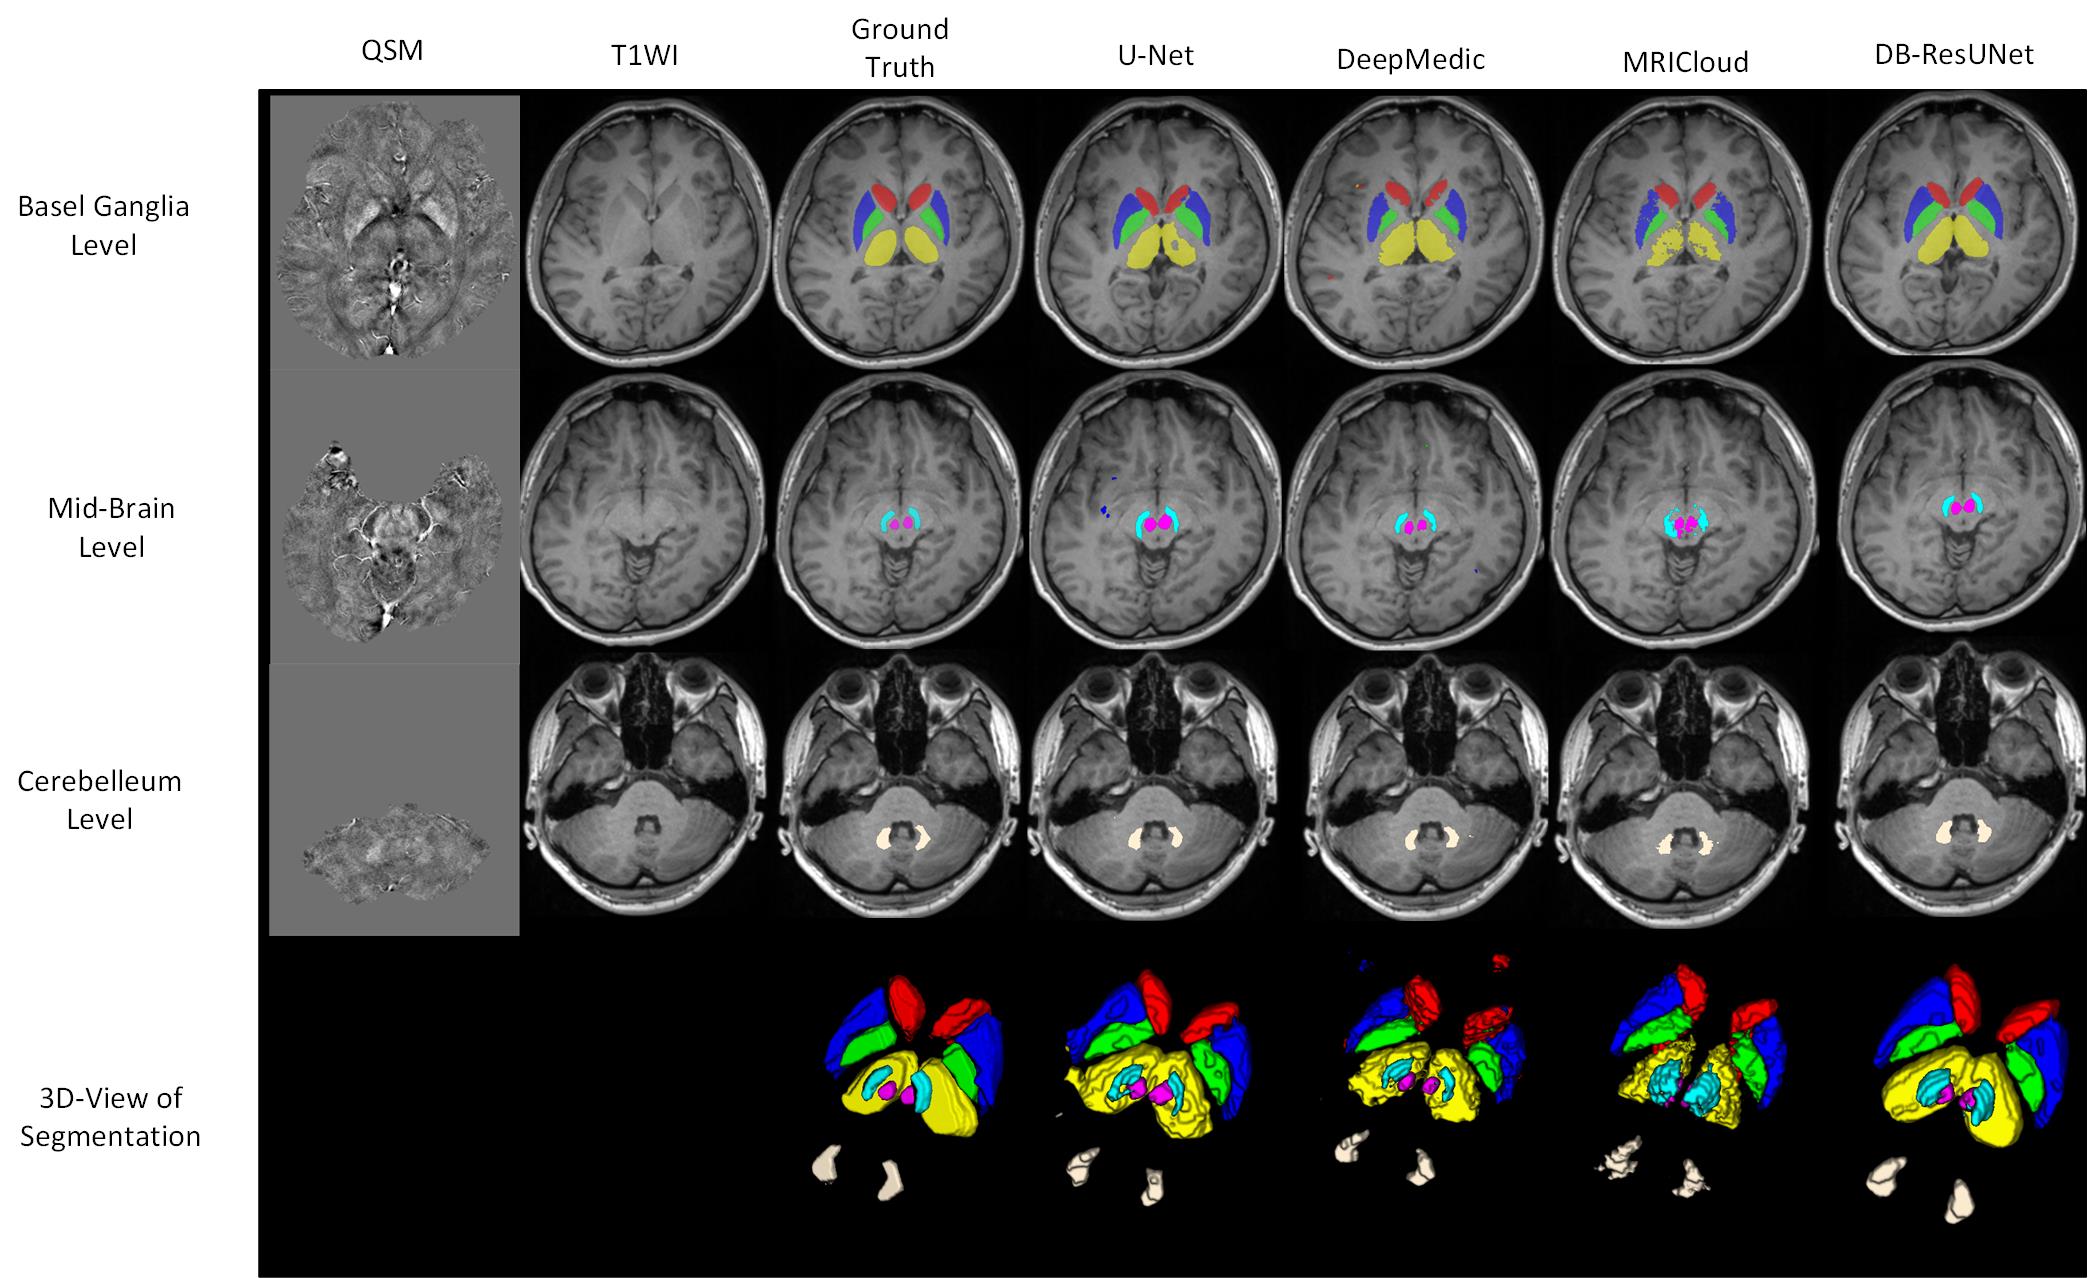
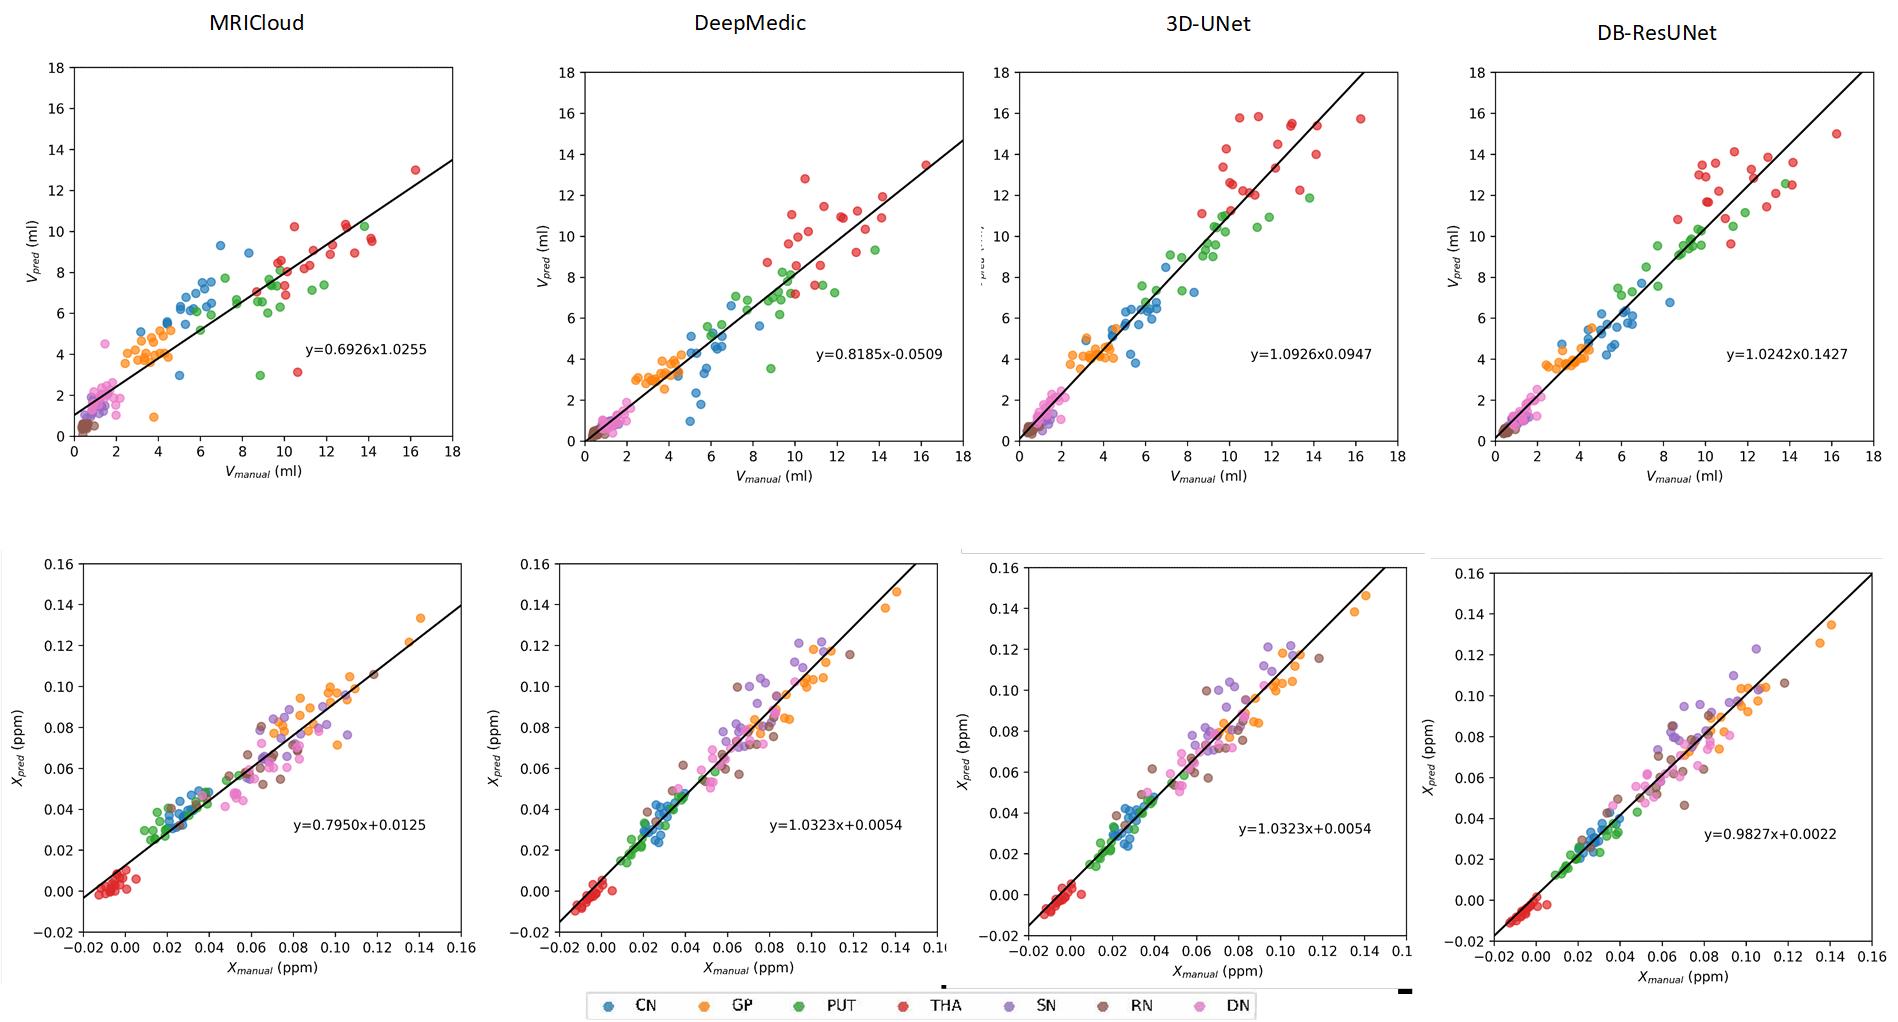
An example of the segmentation obtained with the proposed method is shown in Figure 2, along with an atlas-based method[2], and several deep-learning methods. For the sake of comparison, we trained a 3D-UNet[3], DeepMedic[4]on the same training set. Evaluation results in Figure 3 reveals that the proposed method is able to achieve the highest segmentation accuracy in terms mean DC, HD_{95}, and ASSD. In addition, we applied the proposed method to calculate the volumes and the mean susceptibilities of CN, GP, PUT, THA, SN, RN and DN, which presents high consistency with that measured from manual annotations, as shown in Figure 4.Discussion
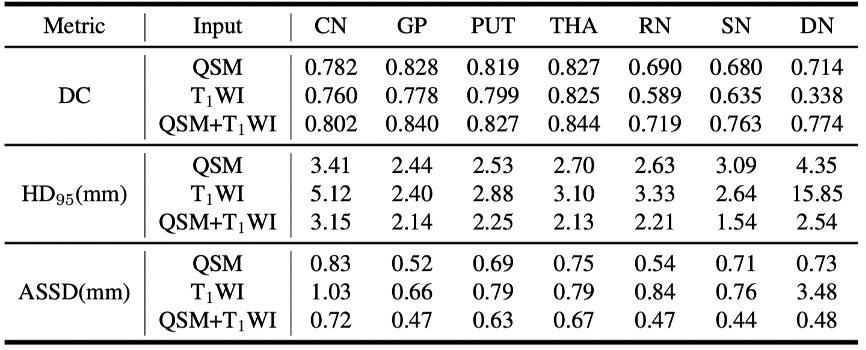
The performance of whether to use images with single or multiple modalities were evaluated. We trained a DB-ResUNet by using QSM+T1WI, QSM, T1WI as inputs. Figure 5 shows the evaluation results. As we can see, the QSM+T1WI case achieves the highest accuracy. With QSM only, the segmentation accuracy slightly reduced, while with T1WI only, the DN segmentation accuracy significantly reduced, due to the fact that DN is less prominent on T1WI.Conclusion
A 3D-CNN based automatic gray matter nuclei segmentation method was proposed. Experiment results indicates that the proposed method is able to achieve much higher segmentation and measurement accuracy over the atlas-based method and other deep-learning-based methods.Acknowledgements
This work was supported by the Natural Science Foundation of China (NSFC) under Grant nos. 81901728, 61871239, 81871342 and 81873888; theScience and Technology talent cultivation Project of Tianjin Health Commission under Grant no. RC20185 and the National Key Technologies Research and Development Program of China under Grant no. 2019YFC0120901 .References
1. Y. Chen, S. Liu, Y. Kang, and E. M. Haacke, “A rapid, robust multi-echo phase unwrapping method for quantitative susceptibility mapping (QSM) using strategically acquired gradient echo (STAGE) data acquisition,” in Medical Imaging 2018: Physics of Medical Imaging (J. Y. Lo, T. G. Schmidt, and G.-H. Chen, eds.), vol. 10573, pp. 735 – 742, International Society for Optics and Photonics, SPIE, 2018.
2. X. Li, L. Chen, K. Kutten, C. Ceritoglu, Y. Li, N. Kang, J. T. Hsu, Y. Qiao, H. Wei, C. Liu, M. I. Miller, S. Mori, D. M. Yousem, P. C. M. van Zijl, and A. V. Faria, “Multi-atlas tool for automated segmentation of brain gray matter nuclei and quantification of their magnetic susceptibility,” NeuroImage, vol. 191, pp. 337–349, May 2019.
3. O. Cicek, A. Abdulkadir, S. S. Lienkamp, T. Brox, and O. Ronneberger, “3D U-Net: Learning Dense Volumetric Segmentation from Sparse Annotation,” in Proc. MICCAI 2016, June 2016.
4. K. Kamnitsas, C. Ledig, V. F. J. Newcombe, J. P. Simpson, A. D. Kane, D. K. Menon, D. Rueckert, and B. Glocker, “Efficient multi-scale 3D CNN with fully connected CRF for accurate brain lesion segmentation,” Medical Image Analysis, vol. 36, pp. 61–78, Feb. 2017.
Figures