3519
Machine Learning-based Features of DKI to Evaluate and Automate Alzheimer’s Disease and amnestic mild cognitive impairment Diagnoses1First Central Clinical College, Tianjin Medical University, Tianjin, China, 2Tianjin Medical University General Hospital, Tianjin, China, 3MR Collaboration, Siemens Healthcare Ltd., Beijing, China, 4Department of Radiology, China-Japan Friendship Hospital, Beijing, China, 5Department of Radiology, Tianjin First Central Hospital, Tianjin, China
Synopsis
The early diagnoses of Alzheimer’s disease (AD) and amnestic mild cognitive impairment (aMCI) are crucial. This study aimed to acquire new imaging markers to assess the severity of AD and provide early diagnoses using machine learning algorithm. Diffusion kurtosis imaging (DKI) parameters were acquired on 58 AD patients, 64 aMCI patients, and 60 healthy volunteers. It’s found that radial diffusivity value of right uncinate fasciculus was the most important feature for assessing severity. The random forest classifier showed the highest diagnostic efficacy for AD. The RF classifier can provide an early diagnosis of disease based on the quantitative DKI features.
INTRODUCTION
Alzheimer’s disease (AD) is a chronic neurodegenerative disease that affects older adults. Amnestic mild cognitive impairment (aMCI) is a primary transitional state between normal aging and dementia; the conversion rate of aMCI into AD is six times higher than that of other MCI types1. Therefore, identifying reliable biomarkers to achieve an early diagnosis of AD and aMCI are crucial. Quantitative parameters from diffusion kurtosis imaging (DKI) can reflect early white matter microstructural changes in patients with AD and aMCI, and provide new imaging indices with additional information2,3. Machine learning algorithms can screen features and establish classification models to help with diagnoses. This study aimed to filter new imaging markers to evaluate the severity of AD and aMCI and provide automated diagnoses of these disease stages using machine learning-based quantitative DKI features.METHODS
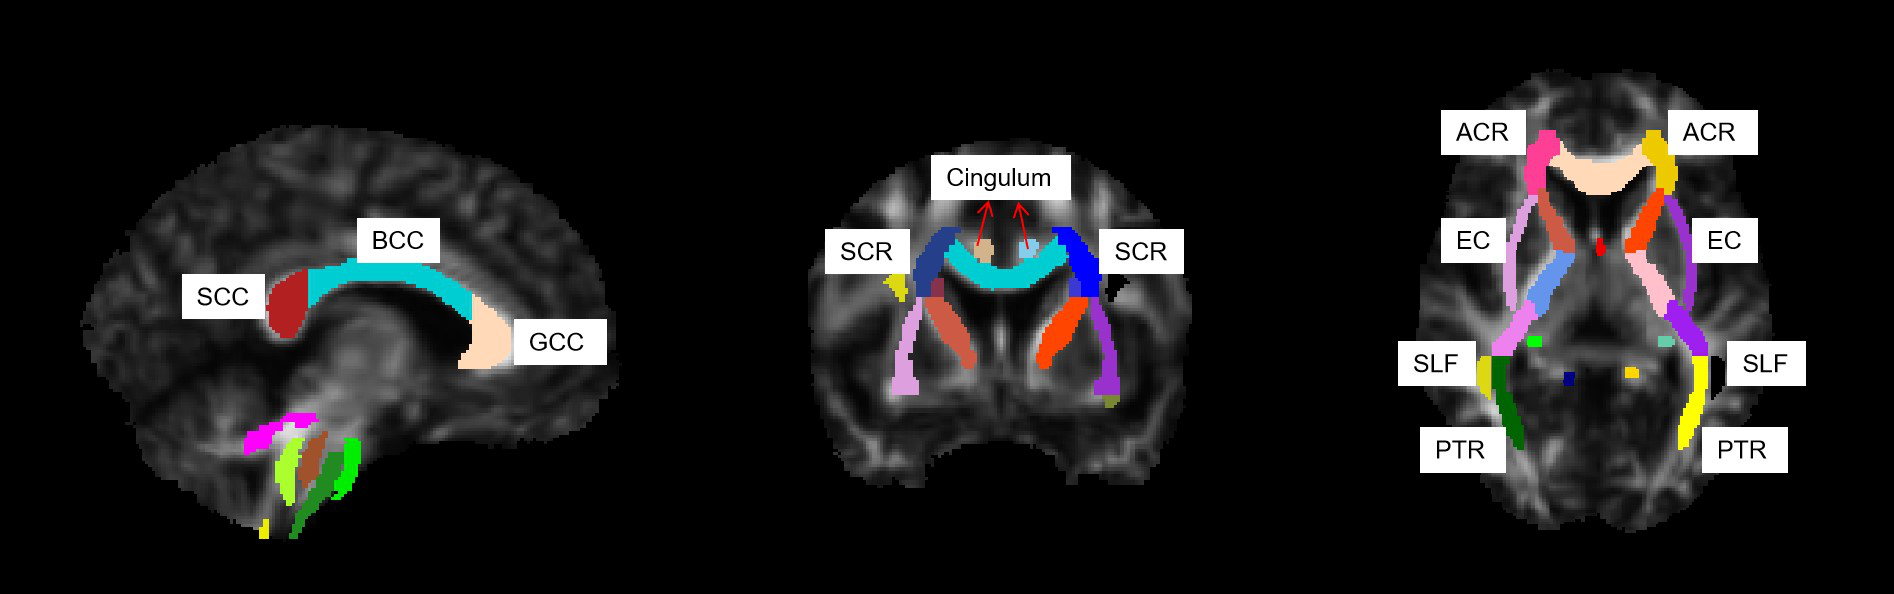
Fifty-eight patients with AD, 64 patients with aMCI, and 60 healthy patients (the control group) underwent mini-mental state examination (MMSE), Montreal cognitive assessment (MoCA), and clinical dementia rate (CDR) to assess cognitive status. Patients also underwent magnetic resonance imaging (MRI) with a magnetization prepared rapid acquisition gradient-echo sequence (TR/TE=1550/2.98 ms, flip angle = 9°, FOV = 256×256 mm2, voxel = 1.0×1.0×1.0 mm3, slices=176) and an echo-planar imaging diffusion sequence (TR/TE = 3800/72 ms, FOV = 220×220 mm2, voxel = 2.0×2.0×2.2 mm3, matrix = 110×110, slices = 60, simultaneous multi-slice acquisition (SMS) acceleration factor = 2, b = 0/2000/3000 s/mm2, directions = 64) appropriate for DKI analyses. Diffusion Kurtosis Estimator software (https://www.nitrc.org/projects/dke) was used to process the diffusion data and obtain the following DKI parameters: kurtosis fractional anisotropy (KFA), mean kurtosis (MK), axial kurtosis (AK), radial kurtosis (RK), fractional anisotropy (FA), mean diffusivity (MD), axial diffusivity (AxD), and radial diffusivity (RD). DKI parameters were nonlinearly registered to the FMRIB58_FA template in the Montreal Neurological Institute standard space using the deformation field produced by segmenting the T1-weighted structural image. DPABI software (http://rfmri.org/dpabi) was used to extract the values in each region of interest for every DKI parameter using the Johns Hopkins University white matter labels as masks (Fig 1). Each obtained MRI feature was screened using the least absolute shrinkage and selection operator regression (LASSO) to identify the feature indices used for AD and aMCI severity evaluation. Three-class models were established to differentiate the three subject groups based on filtered feature indices using the following machine learning methods: logistic regression (LR), support vector machines (SVM), k-nearest neighbor (KNN), decision tree (DT), and random forest (RF). The area under the receiver operating characteristic curve (AUC) metric was used to validate the model performance, which can also be called diagnostic efficacy.RESULTS
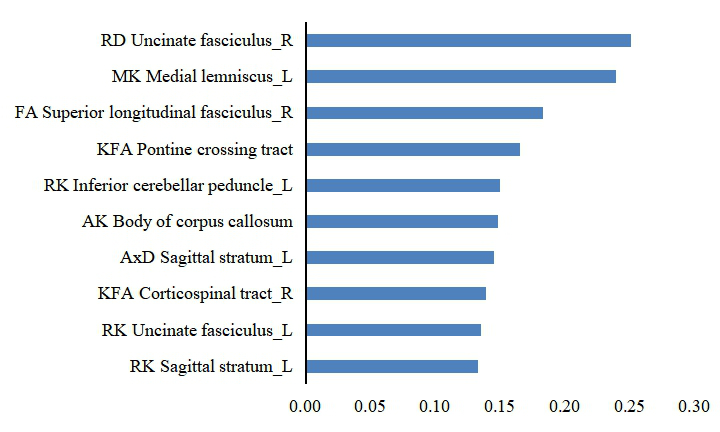
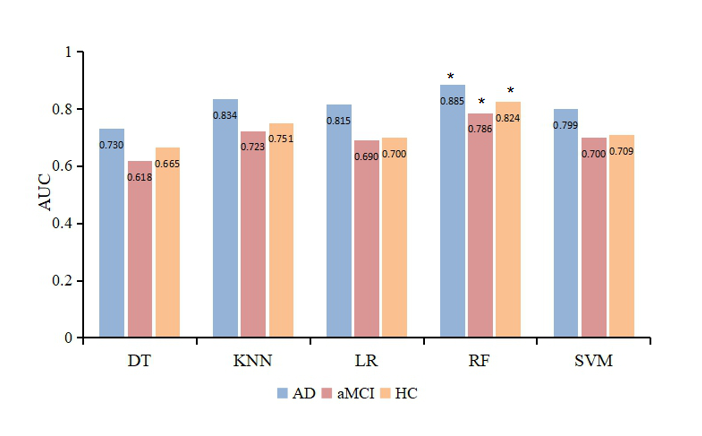
The top five features for AD and aMCI disease severity evaluations were as follows in order of most to least important:RD of the right uncinate fasciculus, MK of the left medial lemniscus, FA of the right superior longitudinal fasciculus, KFA of the pontine crossing tract, and RK of the left inferior cerebellar peduncle (Fig 2). The diagnostic efficacy of DT, KNN, LR, RF, and SVM for AD was 73.0%, 83.4%, 81.5%, 88.5%, and 79.9%, respectively (Fig 3). The diagnostic efficacy for aMCI was 61.8%, 72.3%, 69.0%, 78.6%, and 70.0%, respectively. The diagnostic efficacy for healthy patients was 66.5%, 75.1%, 70.0%, 82.4%, and 70.9%, respectively. RF was the most accurate classifier of all five machine learning classifiers examined.DISCUSSION
This study used machine learning methods to classify the importance of different imaging indices and establish early AD and aMCI auxiliary diagnostic models based on quantitative imaging DKI indices. The higher the importance of the feature, the more useful it was to assess AD and aMCI severity. We found the RD value of the right uncinate fasciculus was the most important index. RD evaluates radial diffusion perpendicular to axons and is sensitive to pathologic changes in myelin sheaths. Previous studies have shown that destruction of the myelin sheath is one of the causes of AD4. Furthermore, in contrast to the traditional two-class method for machine learning research, this study established a three-class model for patients with AD, aMCI, and no health issues; the five obtained classifiers showed higher diagnostic efficacies for AD than for aMCI, because AD has more serious white matter microstructure changes than MCI.CONCLUSIONS
This study found that RD value of the right uncinate fasciculus can evaluate the severity of AD and aMCI and reflect the progression of AD, which was the most important feature for assessing disease severity. In addition, the RF classifier showed higher diagnostic efficiency for AD than the other four classifiers, indicating that the RF classifier can be used as a powerful tool in the early diagnosis of AD.Acknowledgements
No acknowledgement found.References
1. Aerts L, Heffernan M, Kochan N A, et al. Effects of MCI subtype and reversion on progression to dementia in a community sample[J]. Neurology, 2017,88(23):2225-2232.doi:10.1212/WNL.00000000000040152.
2.Yuan L, Sun M, Chen Y, Ni H , et al. Non-Gaussian diffusion alterations on diffusion kurtosis imaging in patients with early Alzheimer's disease[J]. Neurosci Lett,2016,616:11-18.doi:10.1016/j.neulet.2016.01.0213.
3.Ji, F., et al., White matter microstructural abnormalities and default network degeneration are associated with early memory deficit in Alzheimer's disease continuum. Sci Rep, 2019. 9(1): p. 4749.4.
4.Nasrabady Sara E, Rizvi Batool, Goldman James E, et al. White matter changes in Alzheimer's disease: a focus on myelin and oligodendrocytes.. 2018, 6(1):22.
Figures