3514
Machine Learning-based Analysis of Heterogeneous, Multi-center MR Datasets: Impact of Scan Variability1Radiology and Clinical Neuroscience, Hotchkiss Brain Institute, University of Calgary, Calgary, AB, Canada, 2Calgary Image Processing and Analysis Centre, Foothills Medical Centre, Calgary, AB, Canada, 3Mechanical Engineering, University of Calgary, Calgary, AB, Canada
Synopsis
Multi-centre heterogeneous imaging datasets are frequently required to develop image-based computer-aided diagnosis and treatment monitoring tools. However, these datasets may present large underlying variability, potentially impacting the performance of the developed tools. Here, as a proof-of-concept, we propose a machine learning method to study scan variability related to the scanner vendor and magnetic field strength in brain MR images from two cohorts of healthy subjects. Our model has high accuracy rates (>92%), confirming the presence of scan variability in heterogeneous, multi-centre datasets. This model may be further incorporated into automated diagnostic tools, potentially allowing more reliable and robust results.
Introduction
Magnetic resonance (MR) imaging is a commonly used diagnostic imaging modality.1 The advent of multi-center studies has resulted in additional challenges related to data volume and variability, particularly when acquiring images across research facilities.2 Reliable computer-aided diagnosis (CAD) tools that successfully generalize to multi-center data3,4,5 are more likely to be adopted in broader clinical and research environments. The problem with using heterogeneous datasets is that these images have inherent but unwanted scan variability characteristics that may influence decision making, resulting in undesirable outcomes. Our goal is to develop a machine learning classifier to study scan variability. As a demonstration concept, we chose to classify vendor and field strength from a cohort of heterogeneous brain MR images.5,6 Our study analyzes the inherent image variation and potential differences between these classes; it does not identify the vendor and field strength from metadata tags. Extended versions of the developed model can be included in future CAD tools to enhance the robustness of results across multiple datasets. Our model may also facilitate several other applications, including longitudinal studies in which the scanner or protocol may change over time; quality control methods to verify acquisition protocol compliance; image data curation by completing missing or correcting metadata; and enabling image retrieval tasks.Data and Methods
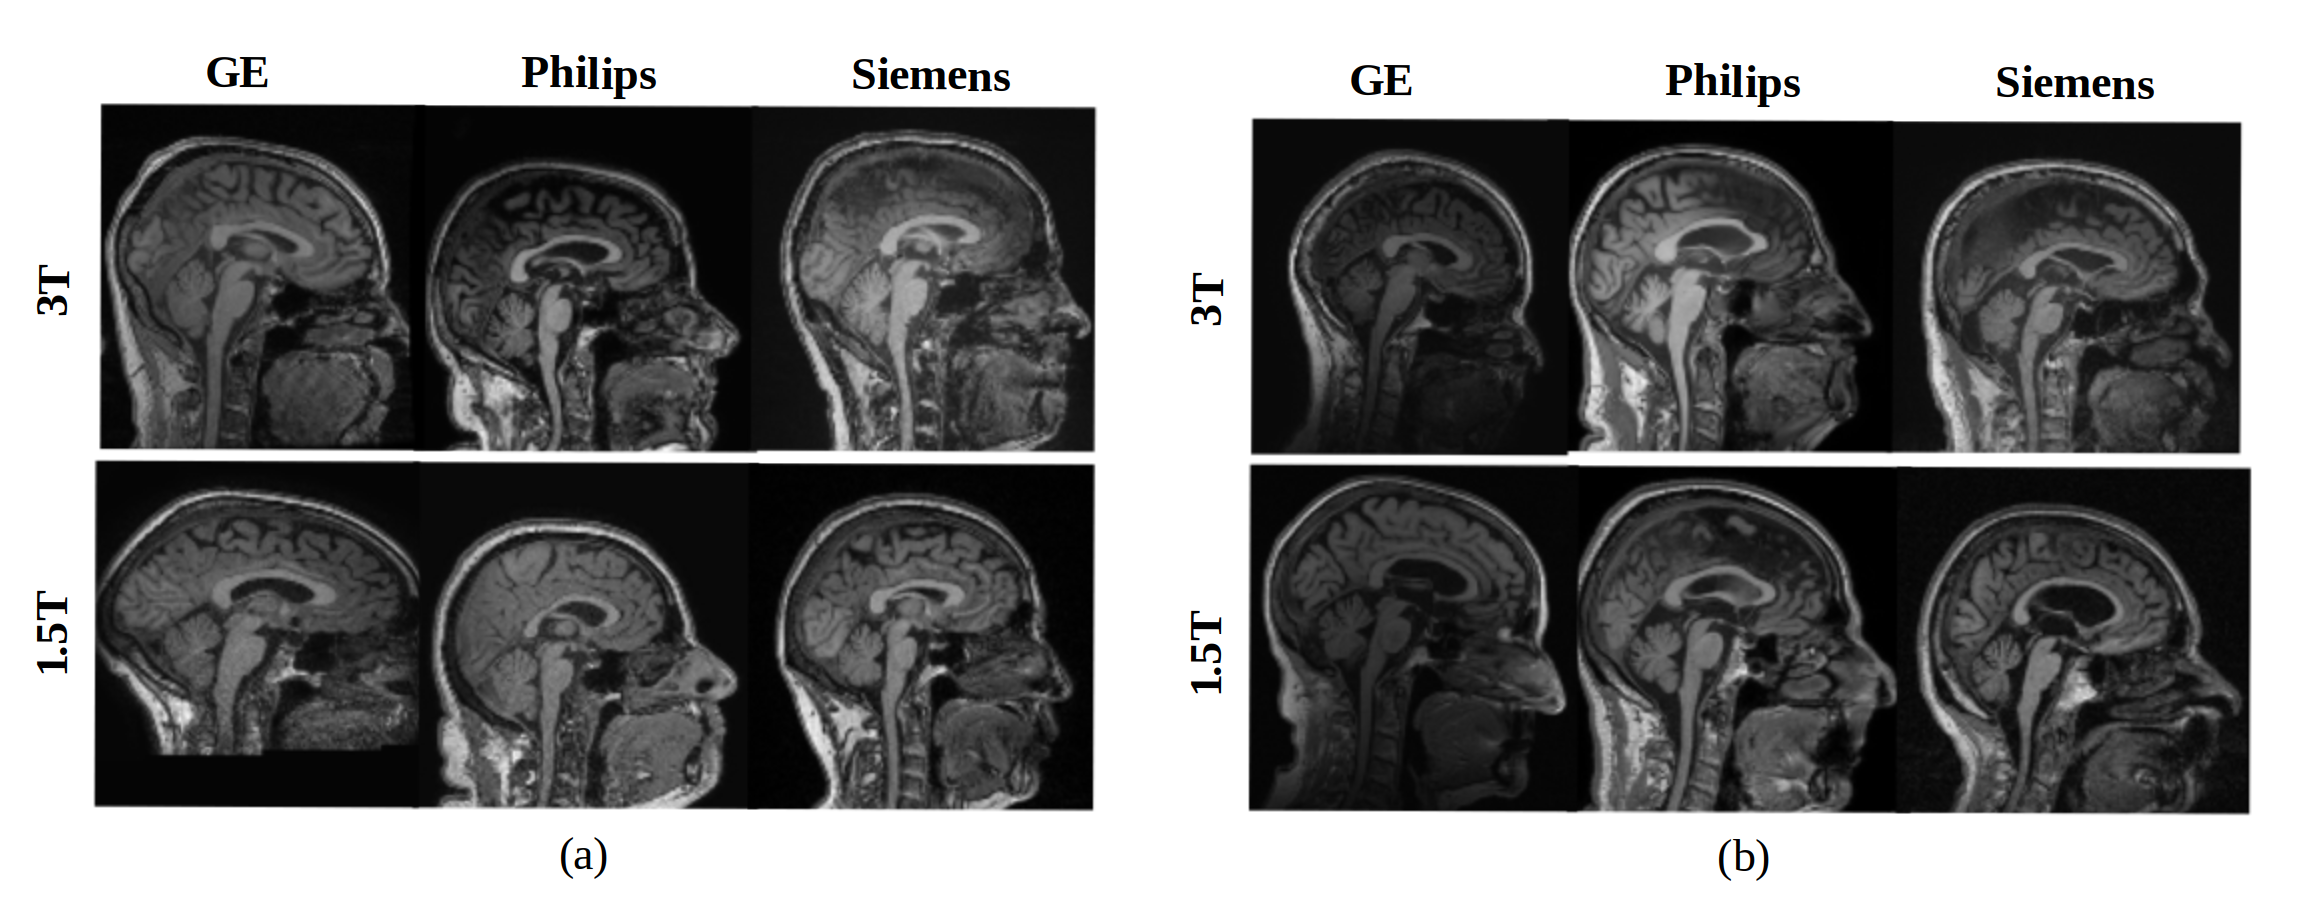
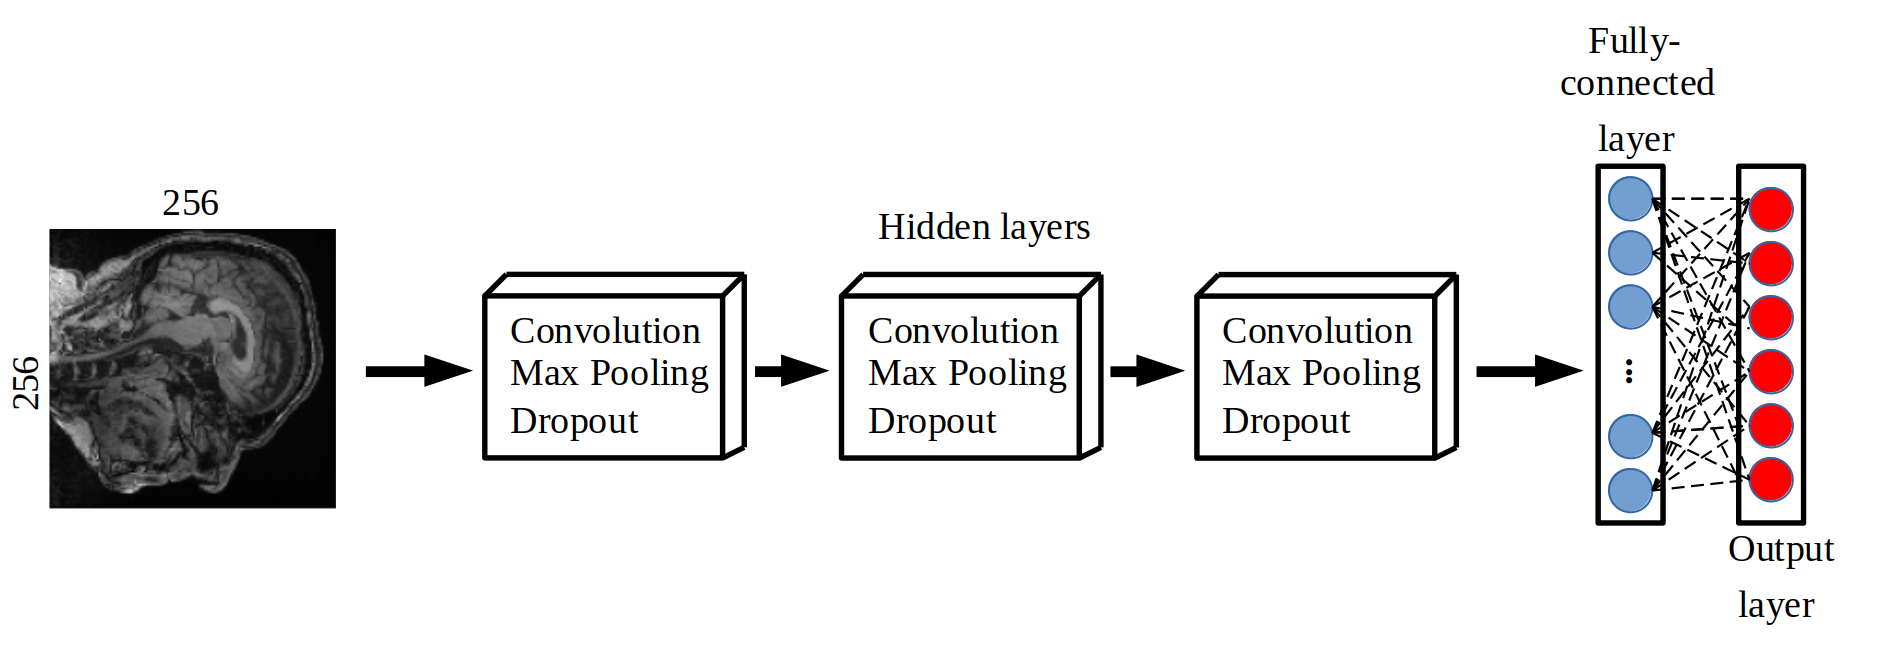
We developed a classification model to distinguish data based on vendor (General Electric, Philips, and Siemens) and magnetic field strength (1.5 T and 3 T). Our model was a six-class convolution neural network. It was developed using a combination of two publicly available MR brain datasets: Calgary-Campinas-359 (CC-359 – sites.google.com/view/calgary-campinas-dataset/home)7 and Alzheimer’s Disease Neuroimaging Initiative (ADNI - adni.loni.usc.edu).8 Each class (a permutation of vendor and field strength) had approximately has 100 volumetric T1-weighted images in a total of 599 healthy controls (Fig 1). These images were randomly split into training/validation (80% of total samples) and testing (20% of total samples), preserving the class balance. Pre-processing consisted of: 1) extracting the three consecutive two-dimensional sagittal slices at the center of the image volume, 2) resizing the images to 256x256, and 3) applying min-max intensity normalization (intensity values scaled to 0 to 1). Our model included three hidden layers, used categorical cross-entropy as loss function and employed the Adam optimizer.9,10 The model used softmax as the activation function to output the probability of each vendor-field strength permutation (Fig 2).Results
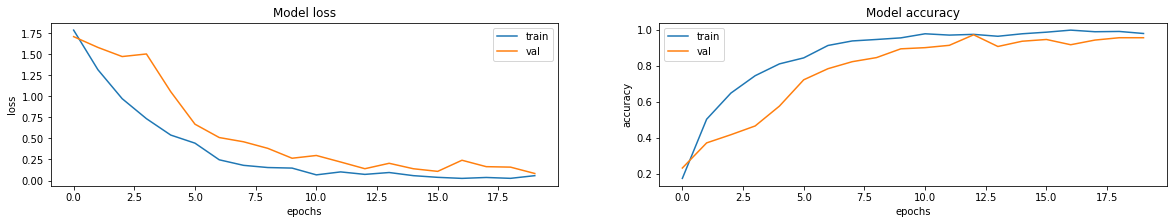
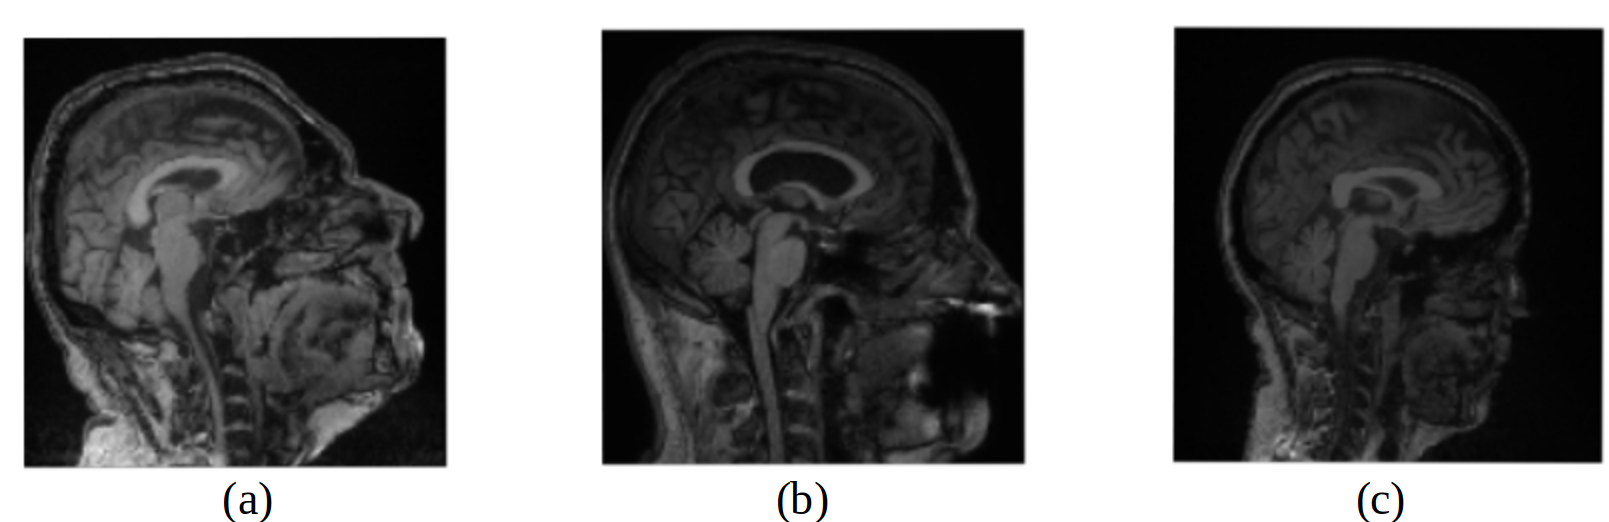
The performance was first evaluated in the training and validation phase (Fig 3). We achieved an accuracy rate of 92% over the previously unseen testing set. There were misclassified samples related to the vendor only (4%), the magnetic field only (2%) or both vendor and magnetic field strength (2%). A qualitative evaluation by inspecting misclassified samples was also undertaken (Fig 4).Discussion
The developed model presented a high accuracy rate by only accessing the intrinsic imaging characteristics related to the vendor and field strength used in the acquisition. We detected a low rate of misclassified samples. This result suggests that our model presents consistent results for all studied sources of variability. The inclusion of other sources of variability (other acquisition parameters such as repetition time, echo time, among others) on our model could be performed by using a transfer learning approach. We anticipate that understanding inherent variability can improve the design and performance CAD tools. This exploration will allow tools that consider and correct for scan variability to achieve reliable and robust results11 (i.e. provide an answer to the proposed research question that is not influenced by other variability sources). One possibility is to combine the proposed method with a CAD tool using adversarial approaches, optimize the final model to have good results in the proposed classification task, and minimize the imaging variability due to acquisition parameters. Our model can also serve as a quality control method to ensure that the images meet the required standards.12 However, such extensions would require further training data, validation, and analysis.Conclusion
We studied the data variability in this work due to differences in scan variability such as image acquisition parameters. Specifically, here we have examined vendor and field strength. The proposed demonstration model may be used to distinguish MR images based on the scanners' characteristics for acquisition with high accuracy. There are no other studies that propose a similar classification task using heterogeneous, multi-center datasets to the best of our knowledge. Scan variability must be considered in CAD tools development, allowing more reliable and robust results related to the proposed research question, minimizing the effects of image variability. This leads to more reliable ML models that may improve their usage in clinical practice.Acknowledgements
The authors would like to thank the Hotchkiss Brain Institute (HBI) and the Canadian Open Neuroscience Platform (CONP) for financial support. We also thank the University of Calgary for making available computational resources to perform the presented experiments.
References
1. Heinen R, Bouvy WH, Mendrik AM, et al. Robustness of automated methods for brain volume measurements across different MRI field strengths. PloS One. 2016; 11(10):e0165719.
2. Helmer K G, Chou M C, Preciado R I, et al. Multi-site study of diffusion metric variability: effects of site, vendor, field strength, and echo time on regions-of-interest and histogram-bin analyses. Proceedings of SPIE 2016:9788. doi:10.1117/12.2217445.
3. Schlett C L, Hendel T, Hirsch J, et al. Quantitative, organ-specific interscanner and intrascanner variability for 3 T whole-body magnetic resonance imaging in a multicenter, multivendor study. Investigative Radiology. 2016; 51(4): 255–265.
4. Collewet G, Strzelecki M, & Mariette F. Influence of MRI acquisition protocols and image intensity normalization methods on texture classification. Magnetic Resonance Imaging. 2004;22(1):81–91.
5. Schlett C, Hendel T, Hirsch J, et al. Quantitative, Organ-Specific Interscanner and Intrascanner Variability for 3 T Whole-Body Magnetic Resonance Imaging in a Multicenter, Multivendor Study. Investigative Radiology. 2016. 51(4): 255–265.
6. Jovicich J, Czanner S, Han X, et al. MRI-derived measurements of human subcortical, ventricular and intracranial brain volumes: Reliability effects of scan sessions, acquisition sequences, data analyses, scanner upgrade, scanner vendors and field strengths. Neuroimage. 2009. 46(1): 177–192.
7. Souza R, Lucena O, Garrafa J, et al. An open, multi-vendor, multi-field-strength brain MR dataset and analysis of publicly available skull stripping methods agreement. NeuroImage. 2018. 170: 482–494.
8. Mueller S G, Weiner M W, Thal L J, et al. The Alzheimer's Disease Neuroimaging Initiative. Neuroimaging Clinics of North America. 2005. 15(4):869-xii.
9. McBee M P, Awan O A, Colucci A T, et al. Deep Learning in radiology. Academic Radiology. 2018; 25(11): 1472–1480.
10. Shin HC, Roth HR, Gao M, et al. Deep convolutional neural networks for computer-aided detection: Cnn architectures, dataset characteristics and transfer learning. IEEE Transactions on Medical Imaging. 2016. 35(5): 1285–1298.
11. Thrall J H, Li X, Li Q, et al. Artificial intelligence and machine learning in radiology: Opportunities, challenges, pitfalls, and criteria for success. Journal of the American College of Radiology: JACR. 2018. 15(3): 504–508.
12. Willemink MJ, Koszek WA, Hardell C, et al. Preparing medical imaging data for machine learning. Radiology. 2020. 295(1): 4–15.
Figures