3512
Multi-class Deep Learning Glioma Segmentation in Hospital Data with Missing Sequences
Jiaming Wu1, Hugh G. Pemberton1,2, Ivar Kommers3, Domenique M.J. Müller3, Sjoerd B. Vos1,2, Ferran Prados1,2, Yipeng Hu1, Pierre A. Robe4, Hilko Ardon5, Lorenzo Bello6, Marco Rossi6, Tommaso Sciortino6, Marco Conti Nibali 6, Mitchel S. Berger7, Shawn L. Hervey-Jumper7, Wim Bouwknegt8, Wimar A. Van den Brink9, Julia Furtner10, Seunggu J. Han11, Albert J. S. Idema12, Barbara Kiesel13, Georg Widhalm13, Alfred Kloet14, Michiel Wagemakers15, Aeilko H. Zwinderman16, Sandro M. Krieg17,18, Emmanuel Mandonnet19, Philip de Witt Hamer3, Roelant S. Eijgelaar3, and Frederik Barkhof1,20
1Centre for Medical Image Computing (CMIC), University College London, London, United Kingdom, 2Neuroradiological Academic Unit, UCL Queen Square Institute of Neurology, University College London, London, United Kingdom, 3Neurosurgical Center Amsterdam, Amsterdam UMC, Vrije Universiteit, Amsterdam, Netherlands, 4Department of Neurology & Neurosurgery, University Medical Center Utrecht, Utrecht, Netherlands, 5Department of Neurosurgery, St. Elisabeth Hospital, Tilburg, Netherlands, 6Neurosurgical Oncology Unit, Departments of Oncology and Hemato-Oncology, Università degli Studi di Milano, Humanitas Research Hospital, IRCCS, Milan, Italy, 7Department of Neurological Surgery, University of California, San Francisco, San Francisco, CA, United States, 8Department of Neurosurgery, Medical Center Slotervaart, Amsterdam, Netherlands, 9Department of Neurosurgery, Isala Hospital, Zwolle, Netherlands, 10Department of Biomedical Imaging and Image-Guided Therapy, Medical University Vienna, Vienna, Austria, 11Department of Neurological Surgery, Oregon Health and Science University, Portland, OR, United States, 12Department of Neurosurgery, Northwest Clinics, Alkmaar, Netherlands, 13Department of Neurosurgery, Medical University Vienna, Vienna, Austria, 14Department of Neurosurgery, Medical Center Haaglanden, The Hague, Netherlands, 15Department of Neurosurgery, University of Groningen, University Medical Center Groningen, Groningen, Netherlands, 16Department of Clinical Epidemiology and Biostatistics, Academic Medical Center, Amsterdam, Netherlands, 17TUM-Neuroimaging Center, Klinikum rechts der Isar, Technische Universität München, Munich, Germany, 18Department of Neurosurgery, Klinikum rechts der Isar, Technische Universität München, Munich, Germany, 19Department of Neurosurgery, Lariboisière Hospital, APHP, Paris, France, 20Radiology & Nuclear Medicine, VU University Medical Center, Amsterdam, Netherlands
1Centre for Medical Image Computing (CMIC), University College London, London, United Kingdom, 2Neuroradiological Academic Unit, UCL Queen Square Institute of Neurology, University College London, London, United Kingdom, 3Neurosurgical Center Amsterdam, Amsterdam UMC, Vrije Universiteit, Amsterdam, Netherlands, 4Department of Neurology & Neurosurgery, University Medical Center Utrecht, Utrecht, Netherlands, 5Department of Neurosurgery, St. Elisabeth Hospital, Tilburg, Netherlands, 6Neurosurgical Oncology Unit, Departments of Oncology and Hemato-Oncology, Università degli Studi di Milano, Humanitas Research Hospital, IRCCS, Milan, Italy, 7Department of Neurological Surgery, University of California, San Francisco, San Francisco, CA, United States, 8Department of Neurosurgery, Medical Center Slotervaart, Amsterdam, Netherlands, 9Department of Neurosurgery, Isala Hospital, Zwolle, Netherlands, 10Department of Biomedical Imaging and Image-Guided Therapy, Medical University Vienna, Vienna, Austria, 11Department of Neurological Surgery, Oregon Health and Science University, Portland, OR, United States, 12Department of Neurosurgery, Northwest Clinics, Alkmaar, Netherlands, 13Department of Neurosurgery, Medical University Vienna, Vienna, Austria, 14Department of Neurosurgery, Medical Center Haaglanden, The Hague, Netherlands, 15Department of Neurosurgery, University of Groningen, University Medical Center Groningen, Groningen, Netherlands, 16Department of Clinical Epidemiology and Biostatistics, Academic Medical Center, Amsterdam, Netherlands, 17TUM-Neuroimaging Center, Klinikum rechts der Isar, Technische Universität München, Munich, Germany, 18Department of Neurosurgery, Klinikum rechts der Isar, Technische Universität München, Munich, Germany, 19Department of Neurosurgery, Lariboisière Hospital, APHP, Paris, France, 20Radiology & Nuclear Medicine, VU University Medical Center, Amsterdam, Netherlands
Synopsis
Accurate segmentation and morphological assessment of glioma can guide treatment and support follow-up. The Brain Tumour Segmentation (BraTS) challenge has been instrumental in promoting research and comparing various automated segmentation algorithms. However, models in the challenge are trained and measured on a strictly curated and high-quality dataset, which is not representative of clinically acquired MRI data. Therefore, we have tested the generalisability of three network architectures from two of the top performing BraTS challenge models. We show the utility of these models in the presence of missing sequences and different scanners in multi-centre hospital data of varying quality.
Introduction
Clinically accurate segmentation and longitudinal volumetric analysis of brain tumours is essential for treatment planning and response monitoring. Since 2012, the annual Brain Tumour Segmentation (BraTS) Challenge has compared the performance of numerous automated glioma segmentation algorithms 1. However, these algorithms are trained and assessed on a highly curated dataset for optimal quality, which does not accurately reflect the realities of clinically acquired MRI data. Indeed, a recent study using a model trained exclusively on BraTS data achieved a median Dice score of 0.81 on BraTS test data but only 0.49 on clinical data 2. The aim of our study was to compare the generalisability of three network architectures from two of the highest performing (Dice scores) models at recent BraTS challenges 3,4 by training with both BraTS data and a multi-centre hospital dataset from the PICTURE project (https://www.pictureproject.nl) 5–9. Indeed, the BraTS challenge authors state “it will be desirable to further increase the number of training and test cases in future brain tumour segmentation benchmarks” 10. Furthermore, we evaluated algorithmic performance in the presence of incomplete datasets using sparsified training that is designed to specifically account for missing sequences 2.Methods
Datasets and manual segmentationWe used manual segmentations of 259 high grade gliomas (HGG) and 76 low grade gliomas (LGG) from the BraTS 2019 dataset. For the hospital data, we have manually segmented 280 HGG and 60 LGG cases from 12 hospitals worldwide. Segmentation classes were consistent with those used in the BraTS challenges – whole tumour (WT), tumour core (TC) and enhancing tumour (ET) (Figure 1). Both datasets contain pre-operative fluid attenuated inversion recovery (FLAIR), T1-weighted (T1w), contrast-enhanced T1 (T1c) and T2-weighted (T2w) images. However, in the hospital dataset some patients had missing sequences (Table 1) but only patients with at least T1c and either T2w or FLAIR were included to be able to segment all tissue classes.
Algorithm training and testing
The two models, DeepMedic and nnU-net ('no-new-Net')3,4,11, were chosen based on high rankings in recent BraTS challenges, availability of a user-friendly implementation online and sufficient uniqueness of the architectures. To further elucidate the performance of the ‘ensemble’ algorithm nnU-net and independently assess architectures, we included both 2D and 3D versions. In order to address missing sequences (Table 1), sparsified training was applied for all algorithms 2. This method involves inserting empty (zero-filled) scans at the same resolution and orientation as the other scans in place of missing sequences (first column of Figure 1). Out of 675 cases there were 66 missing T1w, 53 missing T2w and 15 missing FLAIR.
The data were randomly split into 80% training, 5% validation and 15% test sets (Table 2) except for the PICTURE HGG testing data where we included 71 extra patients (hospitals 4-11, Table 1) to rigorously assess the models’ performance with missing sequences and scanner variation.
Segmentation performance metrics were generated using methods described by Taha and Hanbury 12 and associated software – https://github.com/Visceral-Project/EvaluateSegmentation. The results are split in to metrics of “similarity” – Dice score and volumetric similarity coefficient, “distance” – Hausdorff distance and “classic measures” – sensitivity, specificity and accuracy.
Results
Results for the automated segmentation of both HGG and LGG combined are presented in Table 3. Bonferroni-corrected paired t-tests on Hausdorff distance showed 3D nn-Unet had significantly better scores than both 2D nn-Unet and DeepMedic in WT and TC (p<0.005) but only better than DeepMedic in ET (p<0.005). The same test for Dice score showed no difference between 2D nn-Unet and DeepMedic for any tissue class but 3D nn-Unet performed significantly better than 2D nn-Unet for WT and ET (p<0.005) and DeepMedic for WT and TC (p<0.005). The 3D version of nn-Unet was the top performer across all metrics and showed the least variation according to interquartile range, albeit by small margins. See Figure 2 for Dice scores and Hausdorff distance boxplots.Discussion
In this study, we trained three network architectures on HGG and LGG from both BraTS and multi-centre hospital data. Sparsified training was applied to account for missing sequences, akin to the realities of clinical assessment 2. The 3D version of the nn-Unet model performed the best across all metrics, with small but statistically significant differences in Dice scores and considerably better Hausdorff distances. The tumour core (TC) yielded the most accurate segmentations for all models, according to Dice score. Since the TC is the main body of the tumour and most likely area of resection, our findings suggest that using 3D nn-Unet with sparsified training may be the optimum combination for pre-surgical planning. This outcome also indicates a heavier reliance on a full set of MRI sequences for segmentation of the whole tumour (WT), which is plausible given the hyperintensity of oedema on FLAIR and T2w imaging. We plan to further assess the clinical utility of the model for automated VASARI feature extraction 1, such as midline shift and lobes affected.Conclusion
Our findings suggest that the 3D nn-Unet, when supplemented with sparsified training, is robust enough to perform accurate segmentations of hospital data from multiple different scanners with missing sequences. Furthermore, we show that sparsified training generalises well to other training models beyond DeepMedic.Acknowledgements
The authors would like to thanks all patients involved in the study.References
- Rios Velazquez E, Meier R, Dunn WD, et al. Fully automatic GBM segmentation in the TCGA-GBM dataset: Prognosis and correlation with VASARI features. Sci Rep. 2015;5. doi:10.1038/srep168222.
- Eijgelaar RS, Visser M, Müller DMJ, et al. Robust Deep Learning–based Segmentation of Glioblastoma on Routine Clinical MRI Scans Using Sparsified Training. Radiol Artif Intell. 2020;2(5):e190103. doi:10.1148/ryai.20201901033.
- Isensee F, Petersen J, Klein A, et al. nnU-Net: Self-adapting Framework for U-Net-Based Medical Image Segmentation. In: Informatik Aktuell. ; 2019. doi:10.1007/978-3-658-25326-4_74.
- Kamnitsas K, Ferrante E, Parisot S, et al. DeepMedic for brain tumor segmentation. In: Lecture Notes in Computer Science (Including Subseries Lecture Notes in Artificial Intelligence and Lecture Notes in Bioinformatics). Vol 10154 LNCS. Springer Verlag; 2016:138-149. doi:10.1007/978-3-319-55524-9_145.
- Eijgelaar RS, Bruynzeel AME, Lagerwaard FJ, et al. Earliest radiological progression in glioblastoma by multidisciplinary consensus review. J Neurooncol. 2018;139(3):591-598. doi:10.1007/s11060-018-2896-36.
- Eijgelaar R, De Witt Hamer PC, Peeters CFW, Barkhof F, van Herk M, Witte MG. Voxelwise statistical methods to localize practice variation in brain tumor surgery. Zhang H, ed. PLoS One. 2019;14(9):e0222939. doi:10.1371/journal.pone.02229397.
- Müller DMJ, Robe PA, Ardon H, et al. Quantifying eloquent locations for glioblastoma surgery using resection probability maps. J Neurosurg. 2020;1(aop):1-11. doi:10.3171/2020.1.jns1930498.
- Visser M, Müller DMJ, van Duijn RJM, et al. Inter-rater agreement in glioma segmentations on longitudinal MRI. NeuroImage Clin. 2019;22:101727. doi:10.1016/j.nicl.2019.1017279.
- Müller DMJ, Robe PAJT, Eijgelaar RS, et al. Comparing Glioblastoma Surgery Decisions Between Teams Using Brain Maps of Tumor Locations, Biopsies, and Resections. JCO Clin Cancer Informatics. 2019;(3):1-12. doi:10.1200/cci.18.0008910.
- Menze BH, Jakab A, Bauer S, et al. The Multimodal Brain Tumor Image Segmentation Benchmark (BRATS). IEEE Trans Med Imaging. 2015;34(10):1993-2024. doi:10.1109/TMI.2014.237769411.
- Kamnitsas K, Ledig C, Newcombe VFJ, et al. Efficient multi-scale 3D CNN with fully connected CRF for accurate brain lesion segmentation. Med Image Anal. 2017. doi:10.1016/j.media.2016.10.00412.
- Taha AA, Hanbury A. Metrics for evaluating 3D medical image segmentation: Analysis, selection, and tool. BMC Med Imaging. 2015. doi:10.1186/s12880-015-0068-x13.
Figures
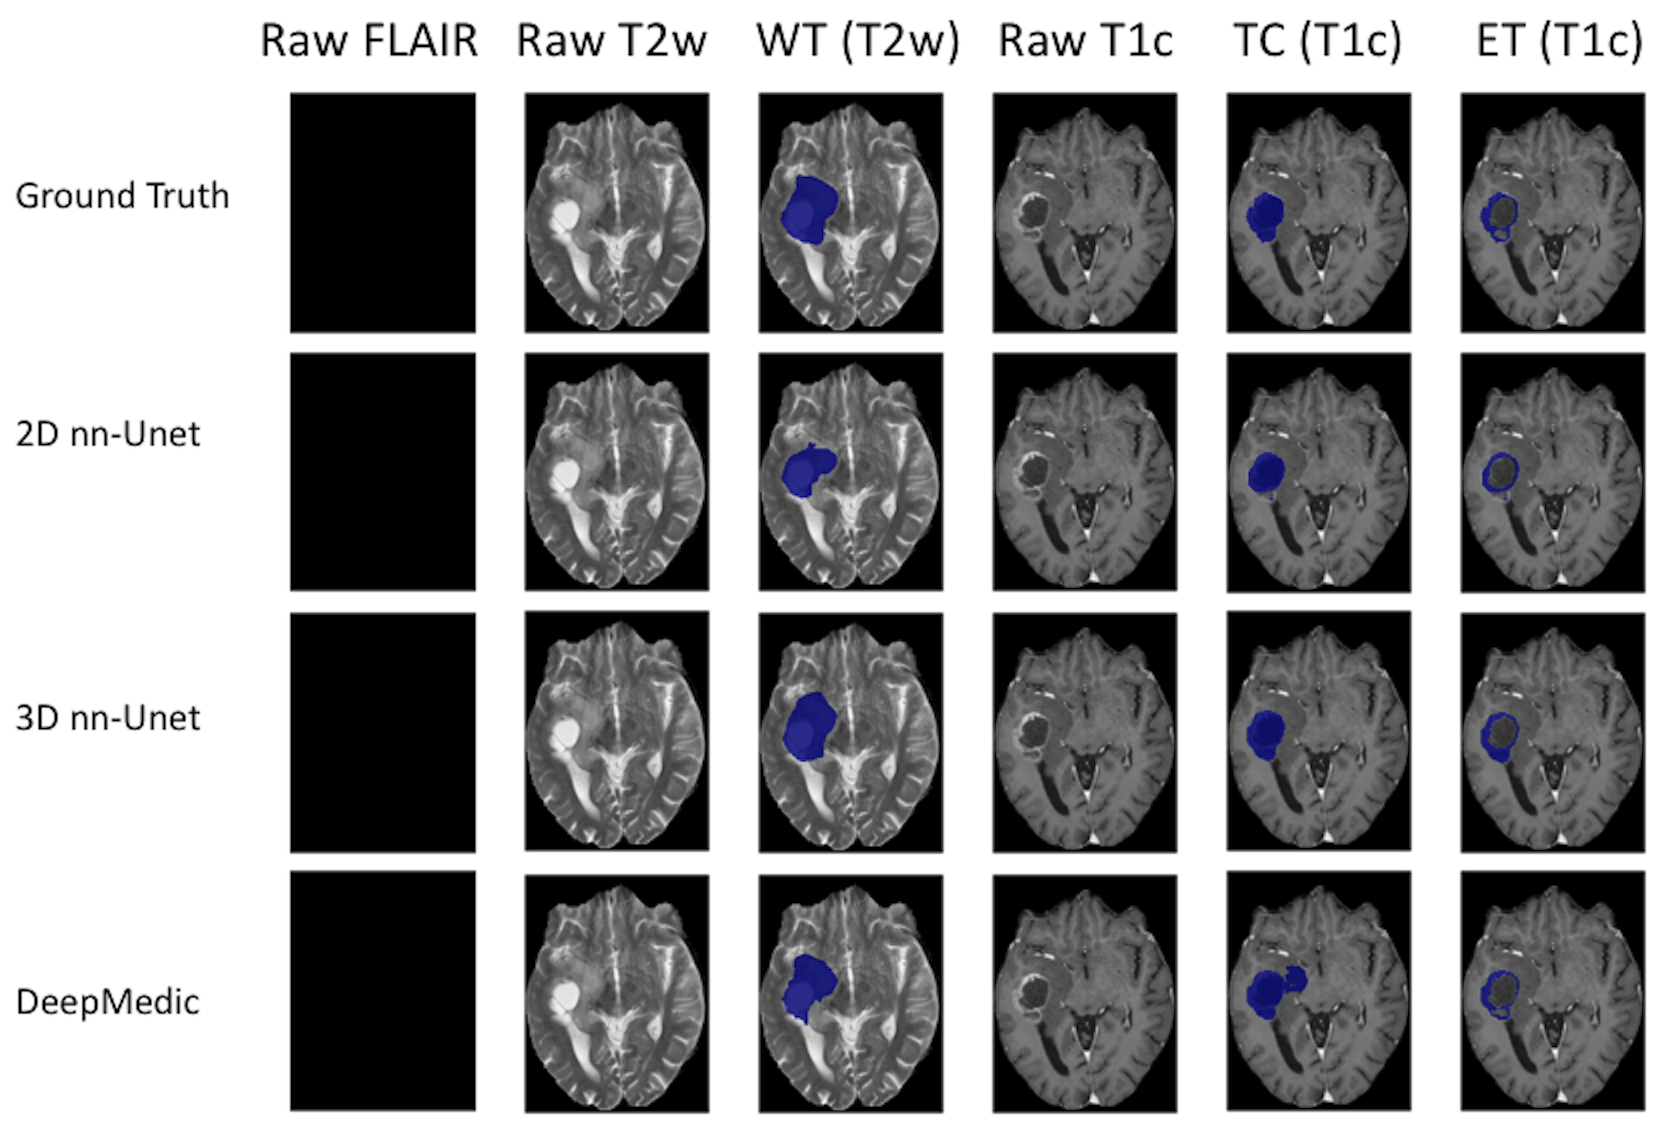
Figure 1 - High grade glioma for a patient with missing FLAIR scan. Whole Tumour (WT) segmentation in third column. The WT defines the full extent of the tumour, including the tumour core and edema, indicated by hyperintensity on FLAIR and T2w. Tumour Core (TC) in fifth column. The TC is the main body of the tumour and most likely area of resection. The TC includes the enhancing tumour (ET) and necrosis. The ET is shown in the sixth column, surrounding the necrosis.
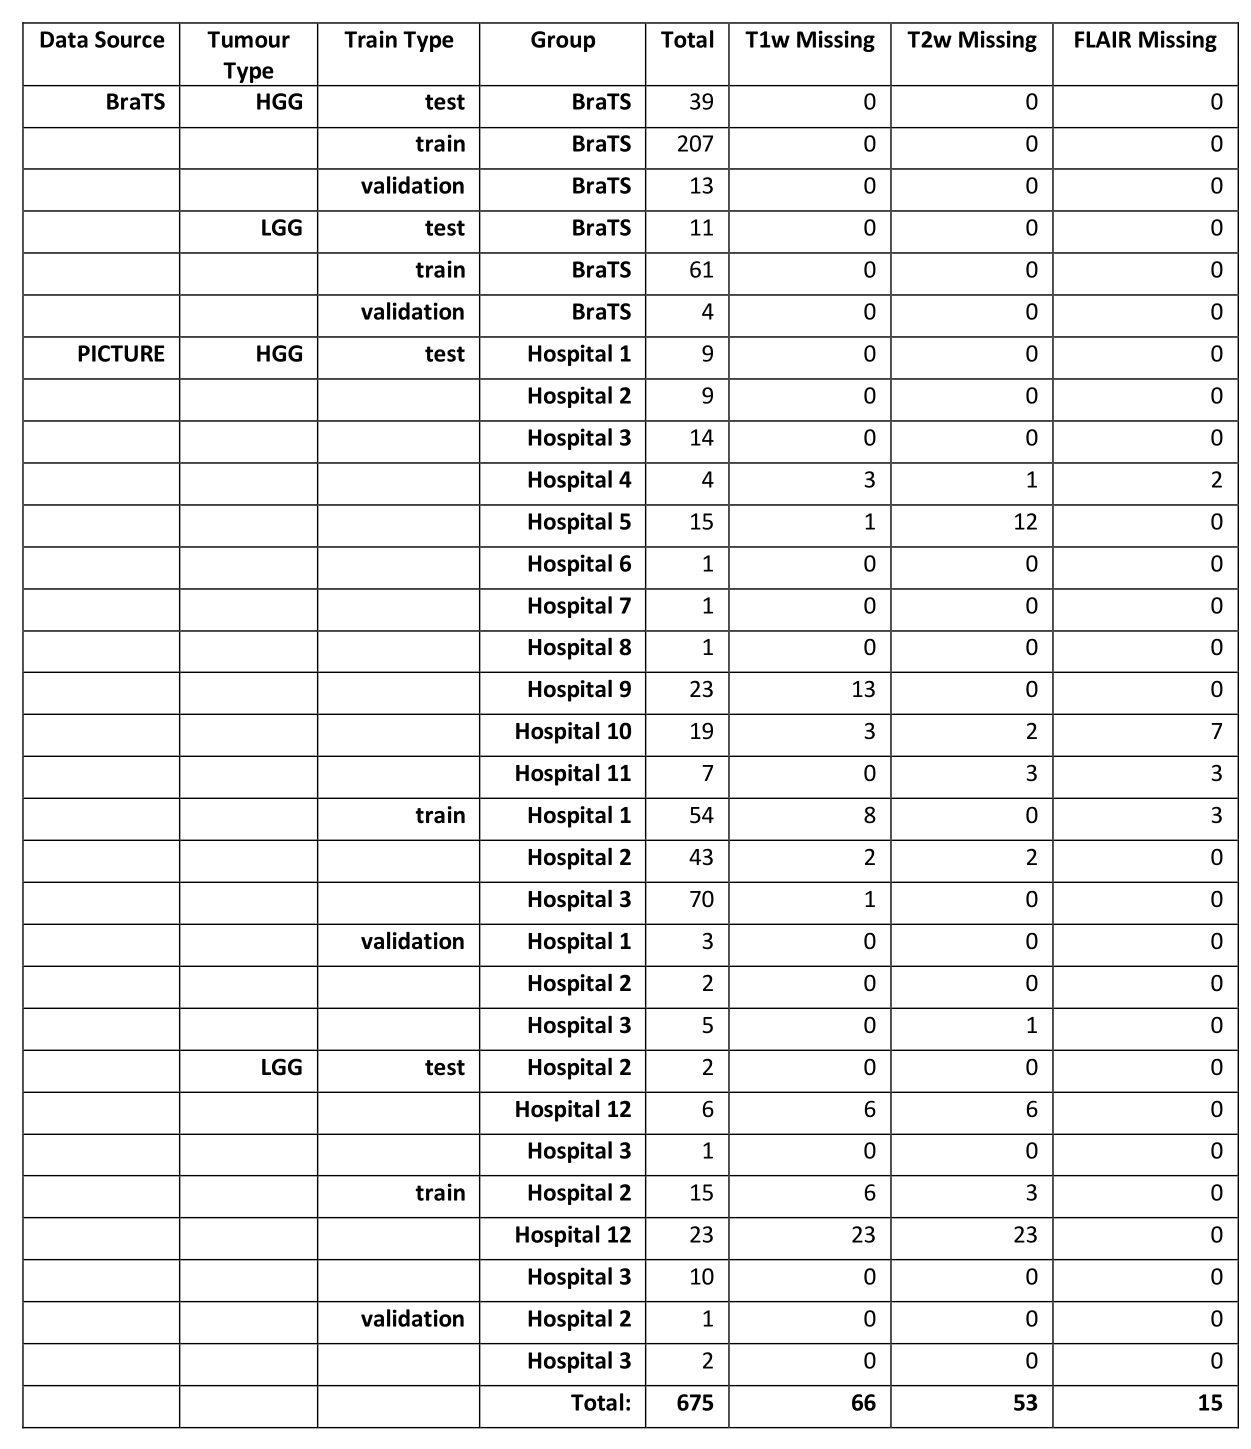
Table 1 - Breakdown of data used in this study from the BraTS and PICTURE datasets (https://www.pictureproject.nl), and missing data totals from each hospital.
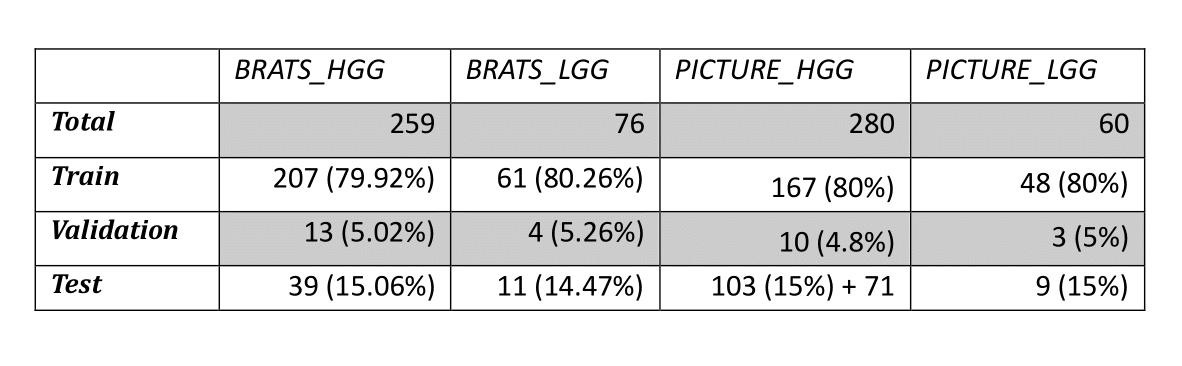
Table 2 - Breakdown of all train, validation and test data for the study.
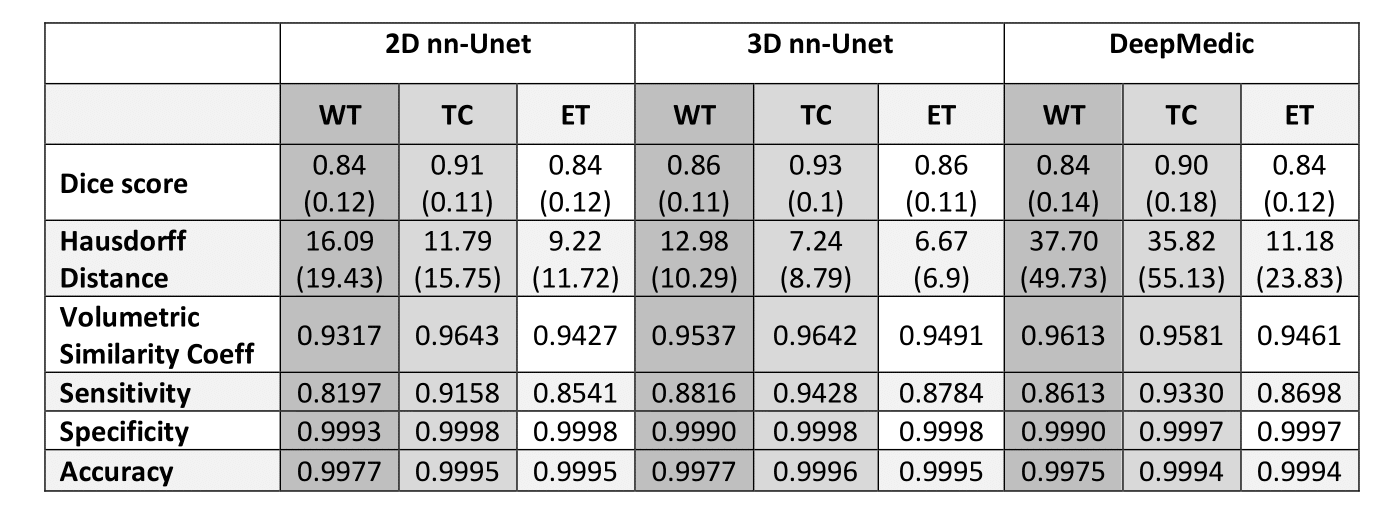
Table 3 - Median results for the assessment of three deep learning automated segmentation models. WT = whole tumour, TC = tumour core, ET = enhancing tumour. Interquartile range (quartile 3 – quartile 1) is shown in brackets, where relevant.
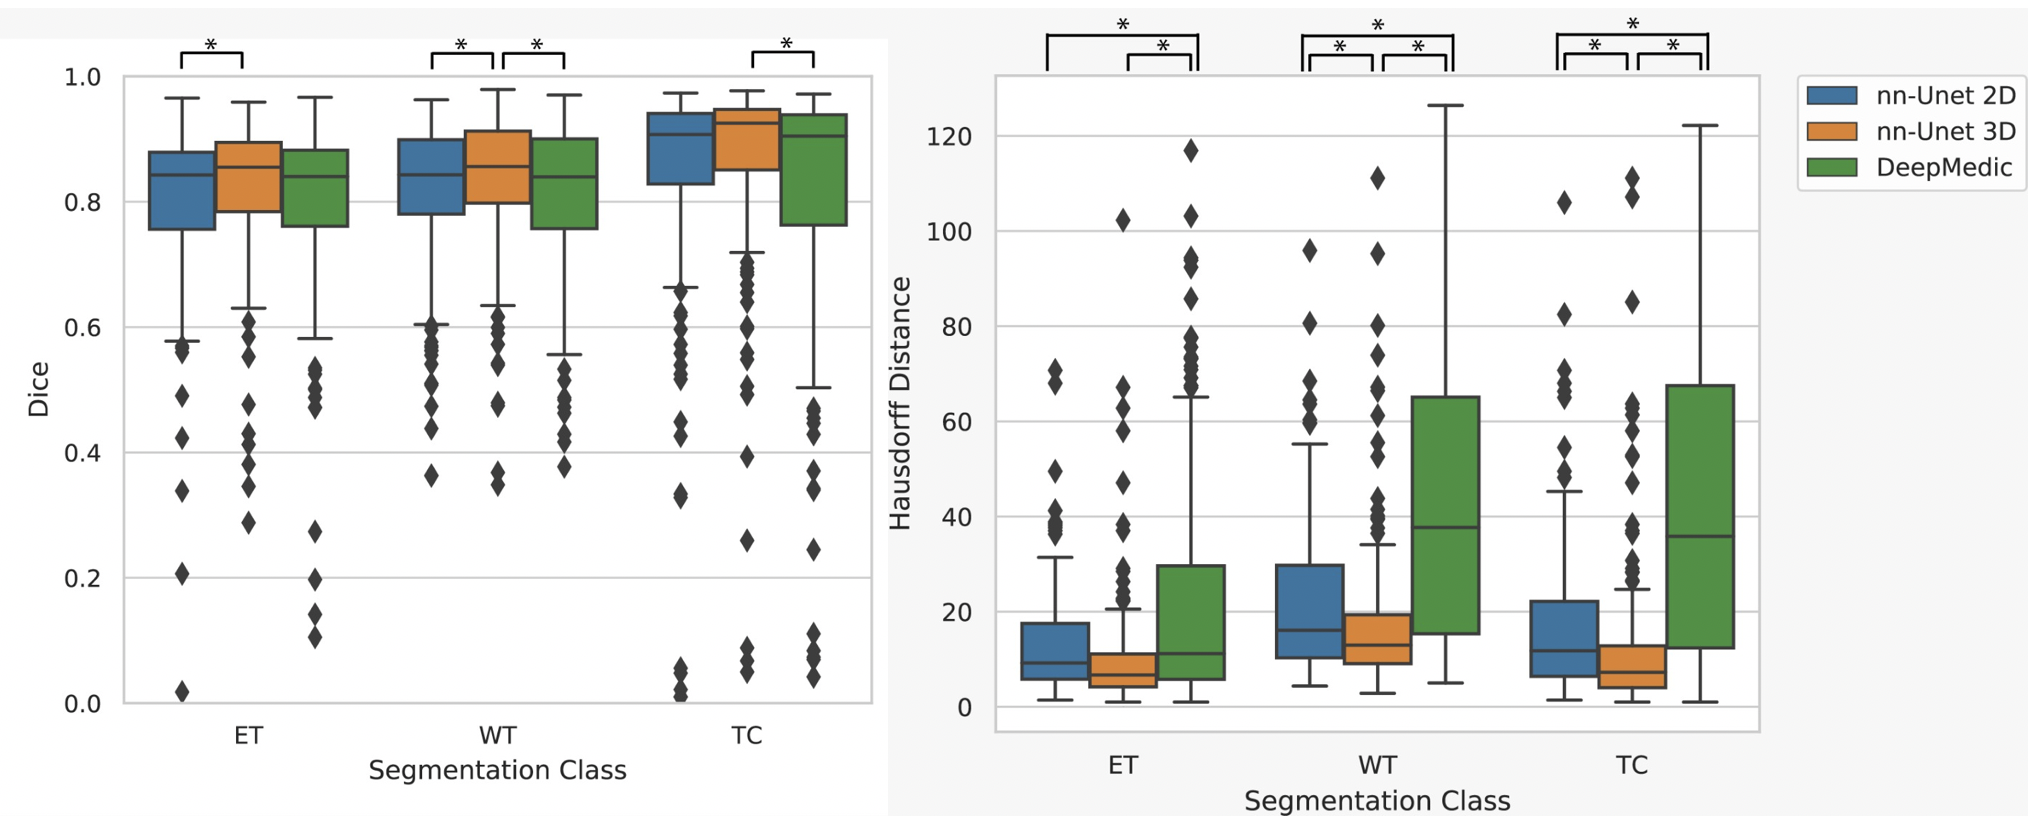
Figure 2 - Box plots for Dice (Left) and Hausdorff distance (Right) showing nn-Unet 3D as the top performer in both metrics. * at the top of each graph denotes statistical significance in Bonferroni corrected paired t-test (p<0.005) between the two linked models. The top of the box is the third quartile, the line in the box is the median and the bottom of the box is the first quartile. Black dots are outliers according to the 1.5 interquartile range rule and thus excluded from the minimum and maximum bars in the box plots, but not excluded from the median results in Figure 4.