3508
Performance evaluation of machine learning algorithms for multiple sclerosis phenotype classification using 7-Tesla MRI and clinical features1Neurology, University of Maryland School of Medicine, Baltimore, MD, United States, 2Neurology, Johns Hopkins University School of Medicine, Baltimore, MD, United States
Synopsis
Three machine-learning algorithms were evaluated in the multiple sclerosis phenotype classification of a relatively small cohort. High accuracy of multiple-sclerosis phenotype classification was achievable by applying tree-based ensemble methods to integrated 7T MRI and clinical data features. Feature integration did not guarantee performance improvements in all machine learning algorithms evaluated. Features considered important may vary depending on the classification algorithm used.
Introduction
Machine-learning (ML) algorithms have been explosively used in various research fields. However, the ML algorithms often require large datasets, and their performances on relatively smaller datasets have not been reported satisfactorily. Multi-site collaborations may overcome the small sample size problem. However, the sample size from 7-tesla (7T) MRI is often smaller than that of other lower field strengths. Quantitative features (T1, R2* and magnetic susceptibility, χ) from 7T MRI data show relationships to multiple sclerosis (MS) outcomes. However, the collected information is often complex, and it is unclear what measurements are critical for clinical outcome prediction. Although ML algorithms may allow better predictive models by integrating features from clinical and 7T MRI data, their performances over smaller datasets are unclear and need to be evaluated. Thus, we aimed to evaluate feature importance and prediction accuracies of eXtreme Gradient Boost1 (XGB), Random Forests2 (RF), and Multi-Class Logistic Regression (MCLR) algorithms on the volumetric, relaxometry (T1, R2*), and χ features from 7T MRI and clinical data for classification of MS phenotype.Methods
Forty-eight participants with MS underwent MRI of the whole brain on a 7T MRI scanner (Philips, Achieva, Cleveland, OH) with a 32-channel transmit/receiver coil (Nova Medical Inc.). Ninety-five scans from all participants were collected from 7T MRI using magnetization prepared 2 rapid gradient echo (MP2RAGE) and multi-echo 3D gradient-echo recalled (GRE) images. Detailed sequence parameters are as follows: MP2RAGE TR=8500ms, TR=6.9ms, TE=2.1ms, inversion times=1000/3000ms, flip angles=5/5 degrees, Turbo factor=252, Field-of-view=220x220 mm2, near-isotropic resolution of 0.7x0.688x0.688 mm3, SENSE acceleration factor=2x2, total acquisition time=9 min 46 sec. Quantitative maps of χ and R2* were processed from GRE, and a T1 map was estimated from MP2RAGE using MATLAB (MathWorks, Inc., Natick, MA). All images were coregistered to MP2RAGE-T1-weighted image using ANTs3. MP2RAGE-T1-weighted images were for segmentation of white matter lesion (WML), cortical gray matter (GM), and normal-appearing white matter (NAWM) using CBS Tools4 and Lesion-TOADS5 in JIST6 environment. Clinical data included demographic factors and disability scale scores. Scans were divided into those in whom a diagnosis of relapsing-remitting (RRMS), secondary progressive (SPMS), or primary progressive (PPMS) MS had been identified by the examining clinician. All classifiers were sequentially trained on eleven clinical features (age; gender; EDSS=Expanded Disability Status Scale; SDMT=Symbol Digit Modalities Test; PASAT1=Paced Auditory Serial Addition Test; MFIS=Modified Fatigue Impact Scale; BDIFS=Beck Depression Inventory-Fast Screen; avg9hptdom=mean 9-hole peg test for dominant hand; avg9hptnondom=mean 9-hole peg test for non-dominant hand; avg25ftwalk=mean timed 25-foot walk), fifty-four MRI features (mean; SD=standard deviation; median; IQR=inter-quartile range; skewness; kurtosis of voxel values of three quantitative maps within WML, NAWM, GM), and sixty-five combined MRI and clinical features. Hyper-parameters of three classifiers were tuned with 3-fold cross-validation in the random search method in each training step. Training-test set ratio was 7:3. Performances of the trained classifiers were recorded as percentage accuracy in each training step's test dataset. We also compared the normalized feature importance from XGB and RF classifiers. All ML tasks were performed on Scikit-learn7 (0.23.2) framework in Python (3.7).Results
Clinical features achieved prediction accuracies of 89.3% with MCLR and RF and 85.7% with XGB. In all algorithms, MRI features achieved a prediction accuracy of 75.9%. Integrated MRI and clinical features improved the prediction accuracies to 96.4% with RF and XGB, not with MCLR (85.7%). (Figure 1) RF and XGB showed similar accuracies while they revealed different ranks in feature importance, which is only available for tree-based algorithms, in each training step. (Figure 2, Table 1, 2) Among the fifteen most important MRI features, WML features were more critical in RF, while XGB seemed to utilize features from all tissue types more evenly. (Table 1) Among the twenty most important integrated features, more clinical features appeared to be critical in RF, while all features were important in XGB. (Table 2)Discussion
We demonstrated that MS phenotype could be characterized by applying machine-learning algorithms to the sum of features extracted from 7T MRI and clinical data. Feature integration led to improved performances of ensemble methods (RF and XGB) but lowered MCLR performance. As such, the integrated MRI and clinical features seemed not to guarantee performance improvements in all machine learning algorithms. The selection of a classifier seemed critical to achieving higher classification accuracy, and ensemble methods appeared to perform well even on this small sample size. Although RF and XGB showed equivalent performances, the feature importance showed differences in orders. It might be primarily due to differences in sampling schemes in the training step and hyper-parameters between two classifiers. The different feature importance orders from two ensemble methods with similar accuracies may lead to different clinical interpretations. Hence, further investigation is required.Conclusion
This data shows the identification of MS phenotype with high prediction accuracy by applying machine-learning methods to integrated features of 7T MRI and clinical data, which is superior to any MRI feature or clinical feature alone. Our results provide the proof-of-concept that feature integration and proper choice of machine-learning algorithms may perform well in classifying MS phenotype in a relatively small cohort.Acknowledgements
The authors would like to acknowledge research nurses Kerry Naunton and Julie Fiol and MRI technicians Terri Brawner, Kathleen Kahl, and Ivana Kusevic – all of whom were critical to implementation of the study.References
1. Chen et al. and Carlos Guestrin. XGBoost : A Scalable Tree Boosting System. KDD'16. 2016; 785–794
2. Leo Breiman. RandomForests. Machine Learning. 2001;45: 5–32
3. Avants et al. A reproducible evaluation of ANTs similarity metrics performance in brain image registration. Neuroimage. 2011; 54(3):2033-44
4. Bazin et al. A computational framework for ultra-high resolution cortical segmentation at 7 Tesla. NeuroImage. 2014;93 Pt 2:201-9
5. Shiee et al. A topology-preserving approach to the segmentation of brain images with multiple sclerosis lesions. NeuroImage. 2010;49(2):1524-35
6. Lucas et al. The Java Image Science Toolkit (JIST) for rapid prototyping and publishing of neuroimaging software. Neuroinformatics. 2010;8(1):5-17
7. Pedregosa et al. Scikit-learn: Machine Learning in Python. JMLR. 2011; 12:2825-2830
Figures
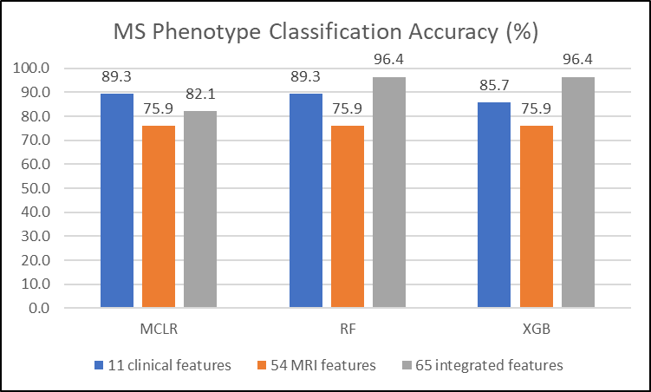
Figure 1. Accuracy Comparison in MS Phenotype Classification
Feature integration improved performances of ensemble methods (RF and XGB) but lowered MCLR performance.
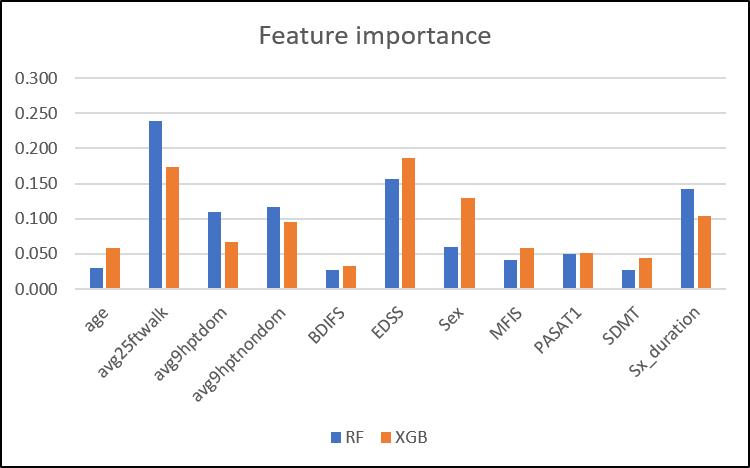
Figure 2. Clinical Feature Importance
Random Forests and XGBoost algorithms show different orders of normalized feature importance.
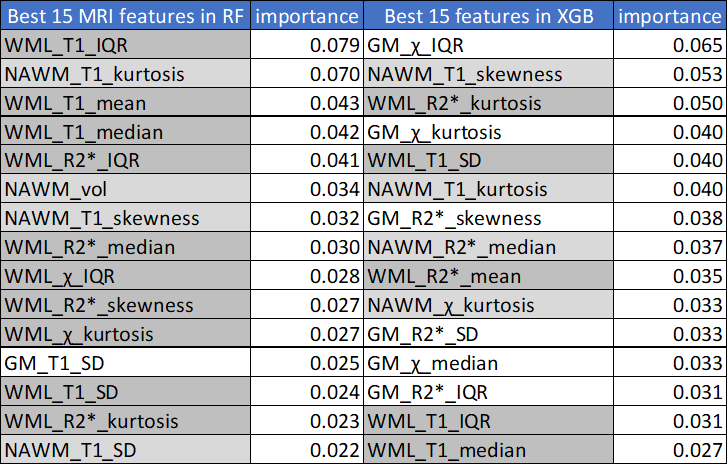
Table 1. MRI Feature Importance
WML features were more critical in RF, while XGB appeared to utilize features from all tissue types more evenly. Feature importances were normalized. (WML features in dark gray, NAWM features in ligth gray, GM features in white)
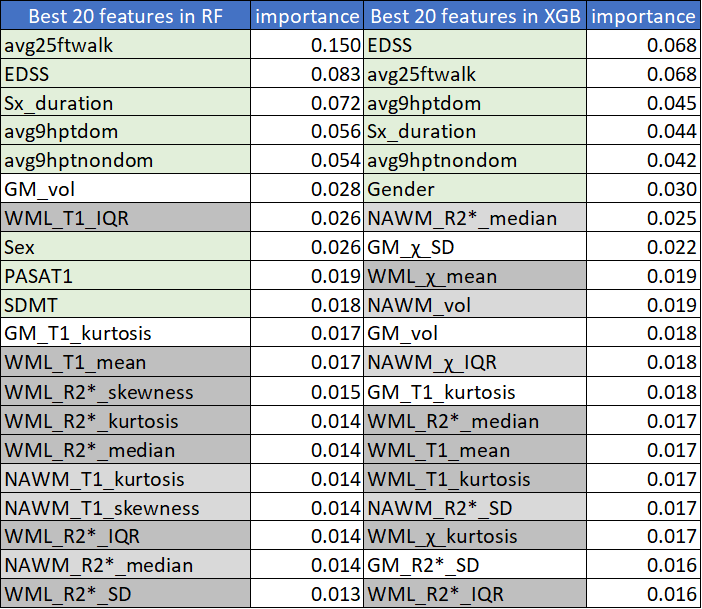
Table 2. Integrated Feature Importance
Among the twenty most important integrated features, more clinical features appeared to be critical in RF compared to XGB, while all features were evenly important in XGB. Feature importances were normalized. (clinical features in light green, WML features in dark gray, NAWM features in light gray, GM features in white)