3506
Deep learning prediction of retrieved stroke thrombus RBC content using quantitative, multiparametric MRI1Medical Biophyics, Western University, London, ON, Canada, 2Robarts Research Institute, London, ON, Canada, 3Clinical Neurological Sciences, London Health Sciences Centre, London, ON, Canada, 4Department of Medical Imaging, Western University, London, ON, Canada
Synopsis
Thrombus red blood cell (RBC) content has been associated with ischemic stroke etiology and responsiveness to recanalization therapies, yet currently can only be analyzed through retrospective histological analysis. We evaluated the ability of a convolutional neural network for predicting thrombus RBC content using multiparametric (R2*, QSM, late echo GRE) MR image slices of retrieved stroke thrombi ex vivo. The network predicted thrombus RBC content with an accuracy and mean absolute error of up to 71 and 8%, respectively, when data augmentation was applied. This technique holds potential for in vivo RBC content prediction and improving acute stroke care.
Introduction
The proportion of red blood cell (RBC) content in stroke thrombi is associated with valuable clinical parameters including stroke etiology and responsiveness to thrombectomy therapy.1,2 Thrombus RBC content is currently only determined retrospectively through histological examination. Previous work has shown that R2* and quantitative susceptibility mapping (QSM) values are sensitive to blood clot RBC content in vitro;3,4 this study examines the feasibility of applying deep learning to these quantitative MR images for predicting RBC content in human stroke thrombi ex vivo.Methods
Thrombus collection- Acute ischemic stroke patients treated with EVT at the local stroke centre between February 2016 to November 2017 were recruited for this study. 48 acute stroke thrombi were scanned ex vivo within 6 hours of retrieval and fixed in formalin for subsequent histological examination.Imaging- Thrombi were imaged at 3T with a 32-channel head-coil using a custom dual echo-train 3D GRE sequence5 (TE1/∆TE/TE5 = 3.20/1.46/9.04 ms, TE6/∆TE'/TE10 = 16.75/7.15/45.35 ms, TR: 47.6 ms, resolution: 0.94 x 0.94 x 1 mm3, matrix: 192 x 192 x 36, BW: 142.86 kHz, flip angle: 10°, scan time = 5 min 33 sec). A naturally co-registered balanced steady-state gradient echo sequence (FIESTA-C) with identical resolution was also acquired to facilitate thrombus segmentation (TE = 3 ms, TR: 6.1 ms, flip angle: 40°, phase cycles = 4, scan time = 2 min 47 sec).
Image post-processing- Raw image data were reconstructed using the Orchestra Software Development Kit (GE Healthcare; Milwaukee, WI) in Matlab. Channel-combined complex GRE data were processed using the B0-NICE6 and MEDI QSM7 algorithms to calculate R2* and QS maps, respectively. Late echo (TE = 31 ms) magnitude images were generated through sum of squares coil combination. Thrombus segmentation was performed semi-automatically on the FIESTA-C images using house-built Matlab code.
Histology- Fixed thrombi were sectioned at 5 μm slice thickness and stained with H&E. The ImageJ color segmentation plugin (EPFL, Lausanne, Switzerland) was used to quantify histological thrombus RBC content.
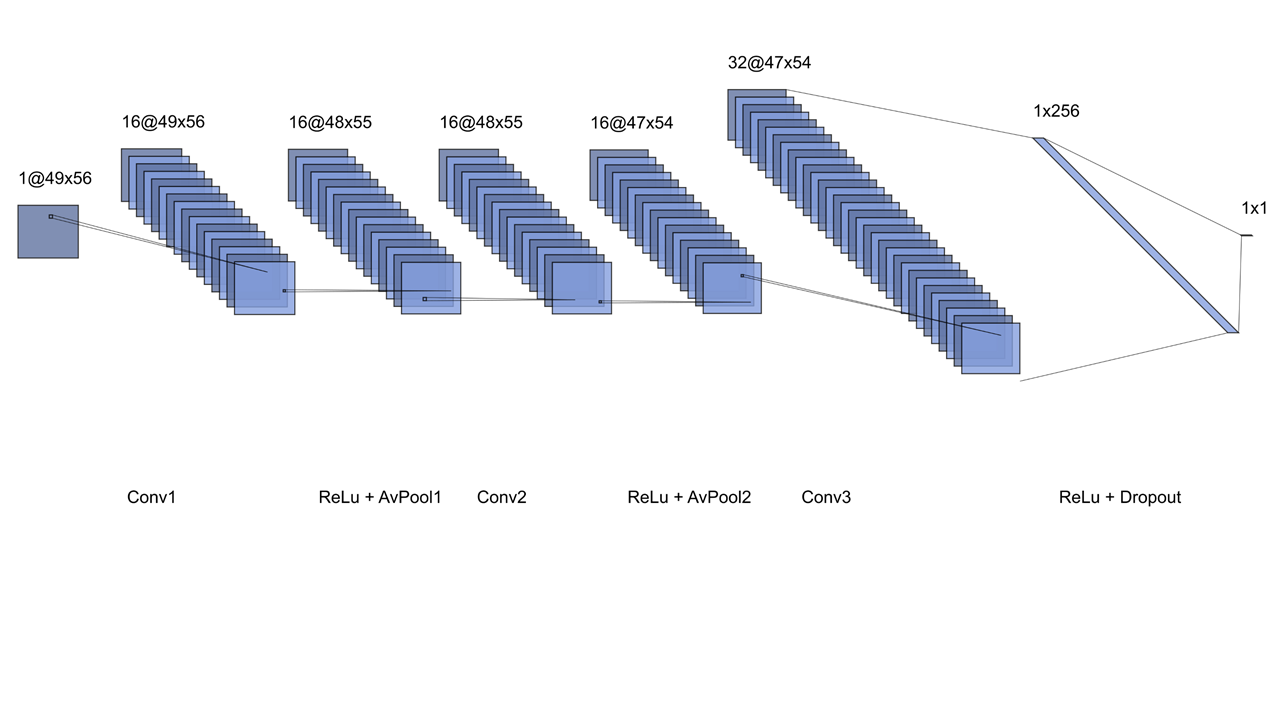
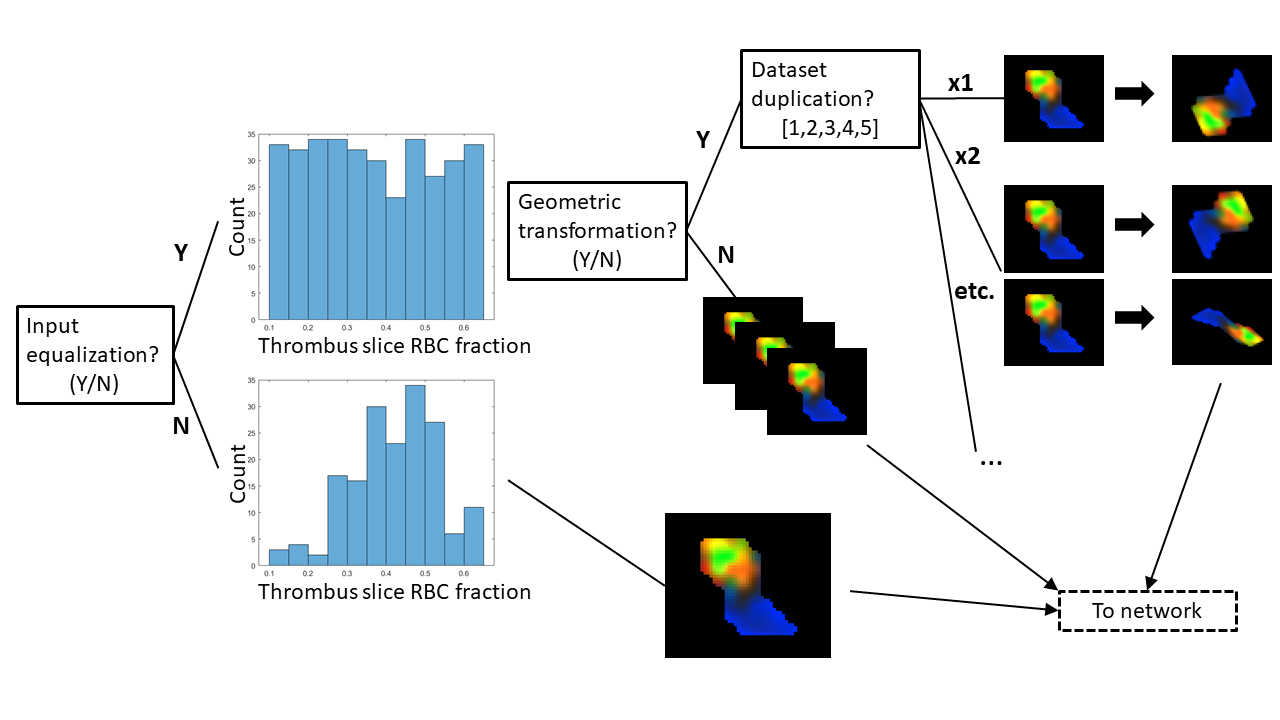
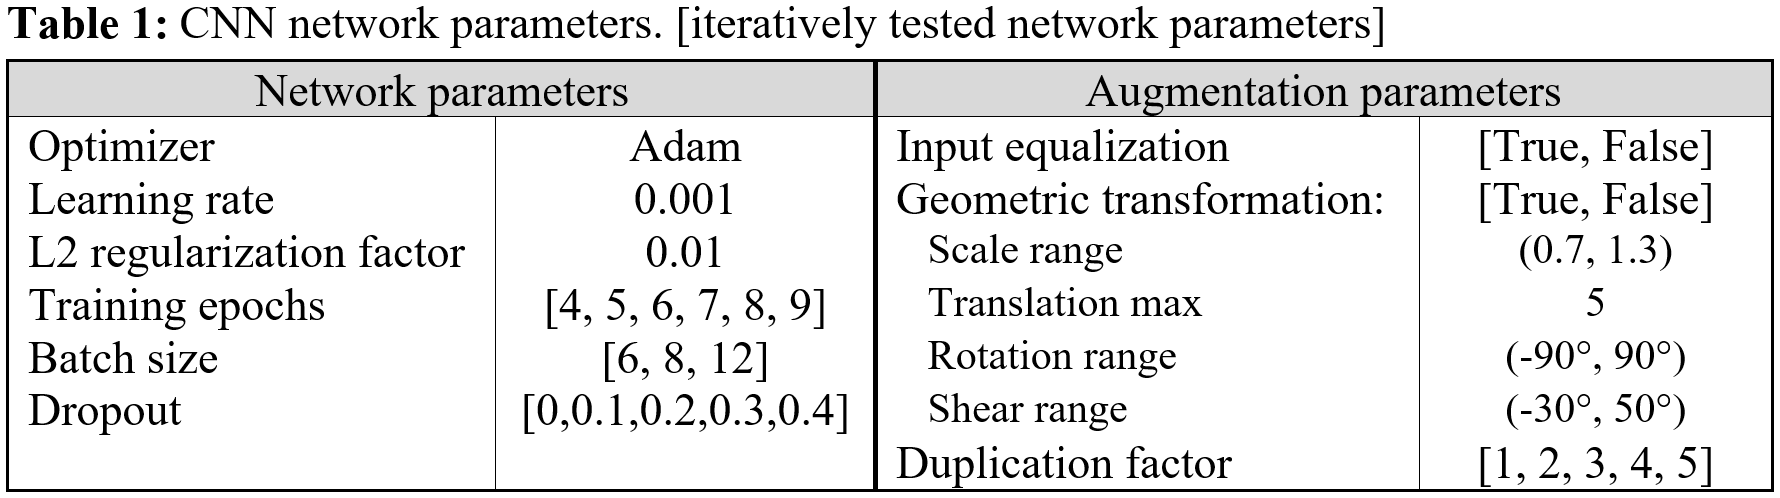
Deep learning network- A 3-layer convolutional neural network (CNN) implemented in Matlab was trained to predict histological RBC content from segmented, normalized 3-channel (R2*, QSM, late-echo GRE) thrombus MR image slices. A schematic diagram of the CNN is shown in Figure 1. 188 thrombus MR slices derived from the 48 thrombi were available for analysis; it was assumed that thrombus RBC content was consistent across all MR slices. Data augmentation involving equalization of input slices based on RBC content (true/false), random geometric transformation (true/false), and dataset duplication (×1 – ×5; prior to geometric augmentation) were iteratively applied. A flowchart depicting the data augmentation scheme is shown in Figure 2. At each data augmentation setting, the network was evaluated across a range of batch sizes, training epochs and dropout factors. Network parameters and data augmentation specifications are detailed in Table 1. 8-fold cross validation was used to evaluate each network’s performance, average accuracy (predictions within 10% of histology), absolute error and root mean square error (RMSE) across all folds were recorded. All slices associated with any particular thrombus were used for either network training or testing only within any fold.
Results
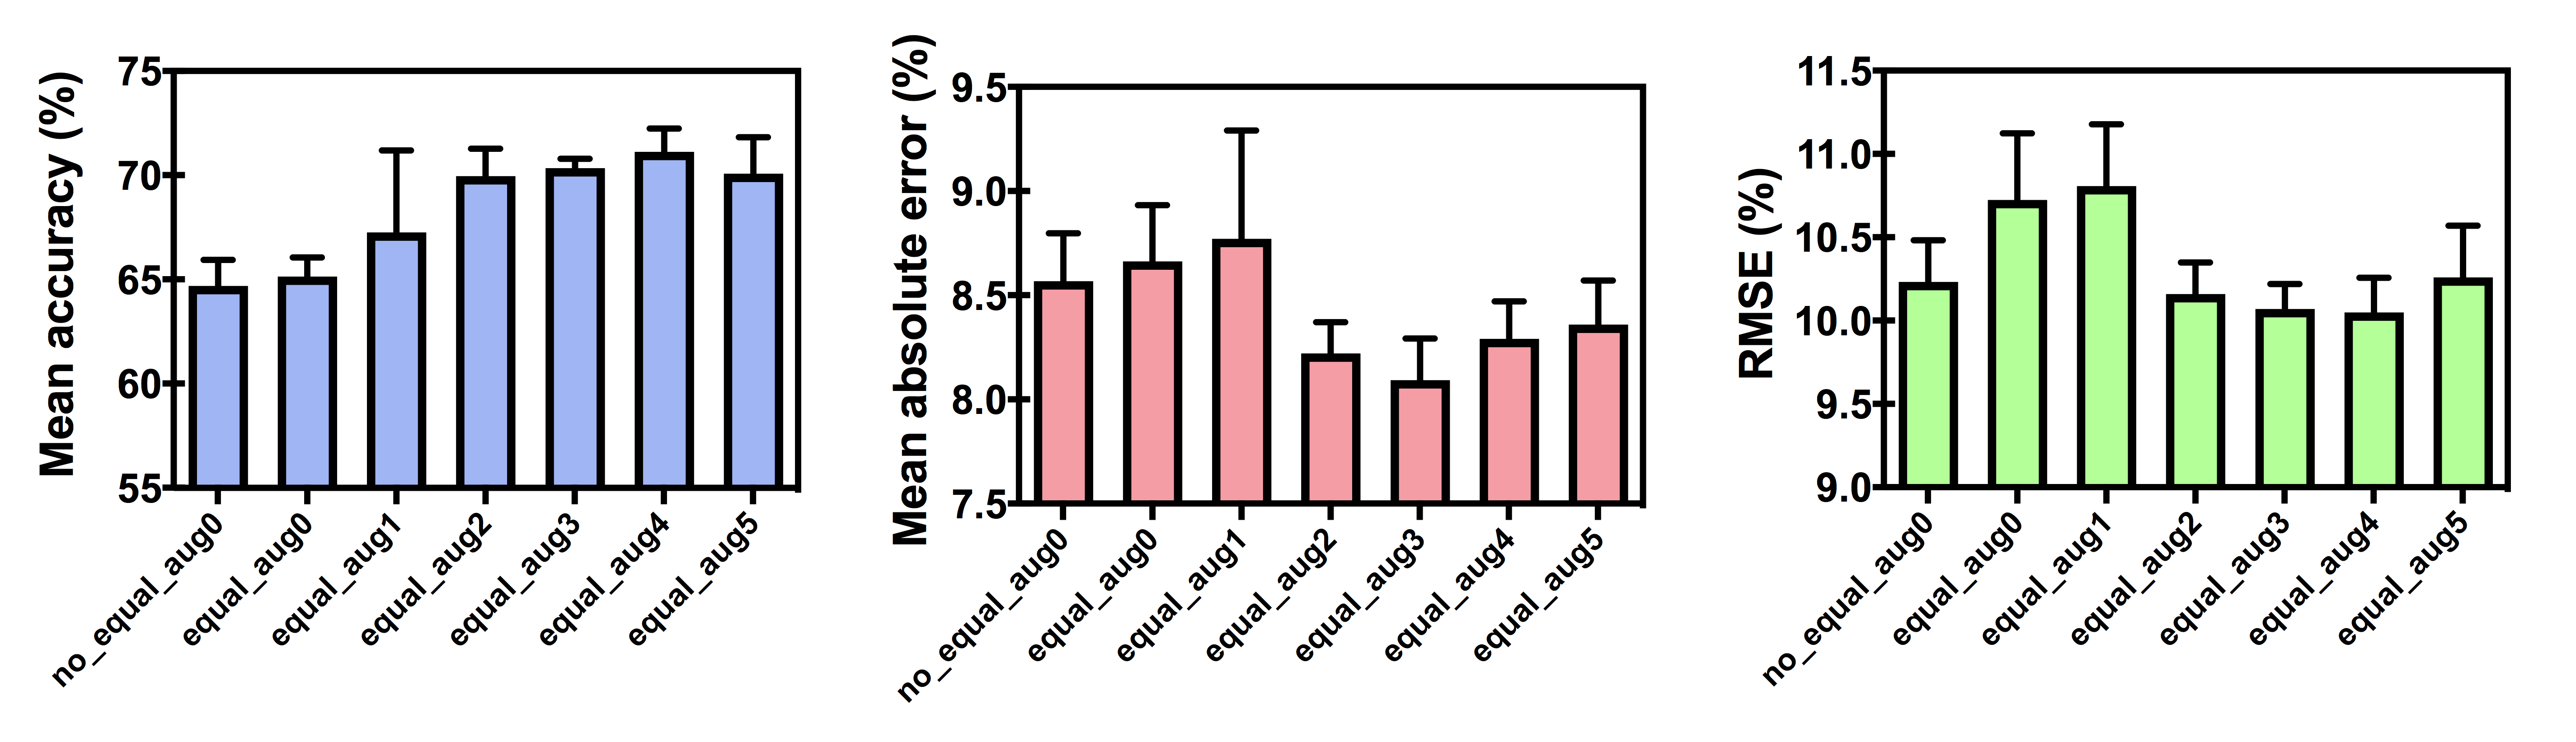
Mean thrombus RBC content determined by histological analysis was 39 ± 13%. Average accuracy and absolute error of the top-5-performing networks at each data augmentation setting are shown in Figure 3. Average network accuracy and absolute error improved from 65±1% and 8.6±0.2% when trained on the original, unaugmented dataset up to 71±1% and 8.1±0.2%, respectively, after augmentation. Root mean square error improved only marginally with augmentation, decreasing from 10.2±0.3% in the original dataset down to 10.0±0.2% after augmentation.Discussion
Despite a small dataset available for training, the CNN was able to accurately predict thrombus RBC content. Network performance improved as more drastic data augmentation was applied, in particular performance improved only after input equalization, geometric transformation and dataset duplication were all applied. Increasing dataset duplication improved network performance up to a factor of ×3, after which no further improvement was seen; dataset duplication may improve network performance only up to a point, but implies the network would show improved performance if trained on a larger thrombus dataset. Nonetheless, the mean absolute error in RBC content prediction of approximately 8% is already smaller than the average difference in RBC content between stroke etiologies (~14%)1,8 or between thrombi responsive vs. non-responsive to EVT (~17%),9,10 suggesting that a network analyzing stroke thrombi in vivo with similar performance would provide sufficient accuracy to guide acute stroke treatment.Conclusion
The CNN learned to accurately predict stroke thrombus RBC content from quantitative, multiparametric MR data, and performance improved through dataset augmentation. These results suggest this method may be useful for predicting thrombus RBC content and informing acute stroke treatment decisions in stroke patients in vivo.Acknowledgements
The authors wish to thank Justina Diaz Legaspe for recruiting and consenting participants, Ada Manini, Leanne Sperlich, Jon Collier, Steve Eggett, Sarah Sitts and Barb Lehrbass for storage of thrombi and facilitating sample transfer, the interventional neuroradiologists at London Health Sciences Centre for thrombus retrieval, Caroline O'Neil for performing thrombus histology, and Trevor Wade for implementation of the pulse sequence.References
1. Sporns, Peter B., et al. "Ischemic stroke: what does the histological composition tell us about the origin of the thrombus?." Stroke 48.8 (2017): 2206-2210.
2. Hashimoto, Tetsuya, et al. "Histopathologic analysis of retrieved thrombi associated with successful reperfusion after acute stroke thrombectomy." Stroke 47.12 (2016): 3035-3037.
3. Christiansen, Spencer D., et al. "Simultaneous R2* and quantitative susceptibility mapping measurement enables differentiation of thrombus hematocrit and age: an in vitro study at 3 T." Journal of neurointerventional surgery 11.11 (2019): 1155-1161.
4. Bourcier, Romain, et al. "MRI Quantitative T2* Mapping to predict dominant composition of in vitro thrombus." American Journal of Neuroradiology 40.1 (2019): 59-64.
5. Liu, J., S.D. Christiansen, and M. Drangova, Single multi-echo GRE acquisition with short and long echo spacing for simultaneous quantitative mapping of fat fraction, B0 inhomogeneity, and susceptibility. Neuroimage, 2018. 172: p. 703-717.
6. Liu, J. and M. Drangova, Method for B0 off-resonance mapping by non-iterative correction of phase-errors (B0-NICE). Magnetic Resonance in Medicine, 2015. 74(4): p. 1177-1188.
7. Liu, J., et al., Morphology enabled dipole inversion for quantitative susceptibility mapping using structural consistency between the magnitude image and the susceptibility map. NeuroImage, 2012. 59(3): p. 2560-2568.
8. Boeckh-Behrens, Tobias, et al. "Thrombus histology suggests cardioembolic cause in cryptogenic stroke." Stroke 47.7 (2016): 1864-1871.
9. Sporns, Peter B., et al. "Ischemic stroke: histological thrombus composition and pre-interventional CT attenuation are associated with intervention time and rate of secondary embolism." Cerebrovascular Diseases 44.5-6 (2017): 344-350.
10. Shin, Jong Wook, et al. "High red blood cell composition in clots is associated with successful recanalization during intra-arterial thrombectomy." PLoS One 13.5 (2018): e0197492.
Figures