3501
Temporal progression patterns of white-matter degeneration in CBS and PSP identified with Subtype & Stage Inference (SuStaIn)1Department of Radiology, Juntendo University Graduate School of Medicine, Tokyo, Japan, 2Centre for Medical Image Computing, Department of Computer Science, University College London, London, United Kingdom, 3Department of Radiological Sciences, Graduate School of Human Health Sciences, Tokyo Metropolitan University, Tokyo, Japan, 4Department of Radiology, Toho University Omori Medical Center, Tokyo, Japan
Synopsis
Corticobasal syndrome (CBS) and progressive supranuclear palsy (PSP) are classic clinical syndromes derived from 4R tau pathology. Differential clinical diagnosis remains difficult due to neurodegenerative overlap. Most previous studies have assessed white-matter (WM) degeneration using cross-sectional data. This study applied Subtype & Stage Inference (SuStaIn), a novel unsupervised machine-learning technique for regional WM fractional anisotropy based on cross-sectional brain diffusion MRI to identify differences in temporal progression patterns of WM degeneration between CBS and PSP. Results suggested the utility of SuStaIn for identifying temporal WM degeneration patterns in and classifying patients with CBS and PSP.
INTRODUCTION:
Corticobasal syndrome (CBS) and progressive supranuclear palsy (PSP) are sporadic atypical parkinsonian disorders associated with 4-repeat tauopathies.1-3 These neurodegenerative conditions closely overlap in their clinical information, pathology, and genetic risk factors, so it remains difficult to accurately diagnose CBS and PSP.4 Although white-matter (WM) degeneration using brain diffusion MRI (dMRI) to diagnose CBS and PSP has been studied, most studies have utilized cross-sectional data.5-10 While visualizing temporal progression patterns of WM degeneration may help to understand disease mechanisms and provide accurate patient stratification and prognostication, collecting massive amounts of longitudinal data is challenging. Recently, an unsupervised machine-learning technique called Subtype and Stage Inference (SuStaIn)11 has been proposed to reveal data-driven disease phenotypes with distinct temporal progression patterns from widely available cross-sectional data. To clarify differences in temporal WM degeneration patterns between CBS and PSP, this study applied SuStaIn for regional WM fractional anisotropy (FA), which was sensitive to WM degeneration5-10, based on cross-sectional brain dMRI data.METHODS:
Data acquisitionDemographic characteristics of participants are shown in Table 1. We obtained dMRI data of 15 normal healthy controls. Twenty-six patients with CBS and 25 with PSP were extracted from the Frontotemporal Lobar Degeneration Neuroimaging Initiative (FTLDNI) and Four Repeat Tauopathy Neuroimaging Initiative (4RTNI) database (http://4rtni-ftldni.ini.usc.edu). Brain dMR images were acquired using a 3-tesla scanner equipped with a 12-channel head coil. Acquisition parameters were: echo-planner imaging, TR/TE, 9200/82 ms; matrix, 128 × 128 (2.7 × 2.7 mm); thickness, 2.7 mm; b-values, 0 and 1000 s/mm2; and diffusion encoding directions, 41.
Diffusion MRI pre-processing
dMRI data were corrected for susceptibility and eddy-current induced geometric distortions and inter-volume subject motion.12,13 FA was calculated after fitting the diffusion tensor model to the corrected dMRI data.14
White-matter tract analysis
Average FA of each regional WM tract was measured using ICBM-DTI-81 WM labels atlas15,16 registered to subject’s diffusion space. The WM tracts were composed of 20 structures (as shown in Figure 1). The mean FA of each regional WM tract was converted into a z-score relative to a control population, as demonstrated in a previous study.11
Subtype and Stage Inference modeling
SuStaIn11 was applied to cross-sectional regional WM tract FAs to identify both disease subtypes and their trajectories with distinct WM degeneration patterns (Figure 2). Each progression pattern indicates a sequential transition of monotonically increasing z-scores of individual subregions of WM tract FA from zero z-score to another, relative to the control population. To assess SuStaIn performance, classification accuracy and sensitivity for CBS and PSP were calculated.
RESULTS:
Figure 3 shows the temporal WM degeneration patterns in CBS and PSP using SuStaIn. SuStaIn revealed that CBS degeneration started from the fornix and stria terminalis (FSTs) and corpus callosum (CC), followed by the posterior corona radiata (PCR), posterior thalamic radiation (PTR) and cerebral peduncle (CP), and then extended to the cingulum. Finally, it reached the superior cerebral peduncle (SCP) and corticospinal tract (CST). In contrast, PSP degeneration started from the SCP and cingulum, followed by CST, then extended to FST and CC. Eventually, it reached PCR, PTR, and CP. Accordingly, SuStaIn classified CBS and PSP with 0.863 accuracy (sensitivity: CBS, 0.885; PSP, 0.840) (Table 2).DISCUSSION:
This study applied SuStaIn, which is a novel unsupervised machine-learning technique for data-driven disease phenotype discovery, to identify, for the first time, the differences in temporal progression patterns of WM degeneration between CBS and PSP. Results showed that SuStaIn successfully identified distinct temporal WM degeneration patterns corresponding to CBS and PSP from cross-sectional dMRI data and classified them as individual disease subtypes with high accuracy.PSP typically showed brain atrophy in the SCP and brainstem, including CST,17-20 while CBS atrophy was in frontoparietal, CC, and CP.19-23 dMRI studies also showed that FA reduction was in the SCP and cingulum in PSP9,10 and in CC, PCR, and PTR in CBS.5-8 Longitudinal studies indicated that PSP atrophy extended from the SCP and brainstem to cerebellar WM and remarkable FA reduction in the SCP. In contrast, CBS atrophy extended from the cerebellar WM to brainstem and extensive FA reduction in cerebellar WM.18, 24 Accordingly, the temporal WM degeneration patterns in CBS and PSP estimated by SuStaIn were largely consistent with these results.
The accuracy of SuStaIn classification for CBS and PSP was compared with results of a previous study to assess SuStaIn classification performance. The mathematical model based on MR volumetry correctly predicted PSP and corticobasal degeneration, which is strongly associated with CBS, with 76% and 83% sensitivity, respectively.19 123I-FP-CIT SPECT striatal evaluation combined with support-vector machine (SVM) differentiated CBS and PSP with 73.9% accuracy (PSP sensitivity: 82.6%, specificity: 72.7%).25 The assay of CSF tau provided diagnostic sensitivity of 81.5%–84.2% and specificity of 66.7%–80.0% between CBD and PSP.26,27 SVM based on gray-matter volume, FA, and mean diffusivity-classified PSP and CBS with 62.2%–79.8% accuracy.28 These results suggest that SuStaIn modeling for disease stage heterogeneity allows for better stratification between CBS and PSP compared with models that only predict disease subtypes.11
CONCLUSION:
SuStaIn identifies distinct temporal WM degeneration patterns of CBS and PSP and classifies the diseases with high accuracy. It is useful for understanding disease mechanisms and for accurate patient stratification and prognostication.Acknowledgements
This work was supported by research grants from the Program for Brain/MINDS Beyond Program from the Japan Agency for Medical Research and Development (AMED) under Grant Number JP18dm0307024; MEXT-Supported Program for the Private University Research Branding Project; ImPACT Program of Council for Science, Technology and Innovation (Cabinet Office, Government of Japan); and JSPS KAKENHI Grant Number JP16K10327.References
- Boeve BF. Parkinson-related dementias. Neurol Clin 2007;25:761-781, vii.
- Litvan I, Bhatia KP, Burn DJ, et al. Movement Disorders Society Scientific Issues Committee report: SIC Task Force appraisal of clinical diagnostic criteria for Parkinsonian disorders. Mov Disord 2003;18:467-486.
- itvan I, Hauw JJ, Bartko JJ, et al. Validity and reliability of the preliminary NINDS neuropathologic criteria for progressive supranuclear palsy and related disorders. J Neuropathol Exp Neurol 1996;55:97-105.
- Ling H, Macerollo A. Is it Useful to Classify PSP and CBD as Different Disorders? Yes. Mov Disord Clin Pract 2018;5:145-148.
- Boelmans K, Bodammer NC, Suchorska B, et al. Diffusion tensor imaging of the corpus callosum differentiates corticobasal syndrome from Parkinson's disease. Parkinsonism Relat Disord 2010;16:498-502.
- Borroni B, Garibotto V, Agosti C, et al. White matter changes in corticobasal degeneration syndrome and correlation with limb apraxia. Arch Neurol 2008;65:796-801.
- Mridula KR, Alladi S, Varma DR, et al. Corticobasal syndrome due to a thalamic tuberculoma and focal cortical atrophy. BMJ Case Rep 2009;2009.
- Pierpaoli C, Barnett A, Pajevic S, et al. Water diffusion changes in Wallerian degeneration and their dependence on white matter architecture. Neuroimage 2001;13:1174-1185.
- Blain CR, Barker GJ, Jarosz JM, et al. Measuring brain stem and cerebellar damage in parkinsonian syndromes using diffusion tensor MRI. Neurology 2006;67:2199-2205.
- Erbetta A, Mandelli ML, Savoiardo M, et al. Diffusion tensor imaging shows different topographic involvement of the thalamus in progressive supranuclear palsy and corticobasal degeneration. AJNR Am J Neuroradiol 2009;30:1482-1487.
- Young AL, Marinescu RV, Oxtoby NP, et al. Uncovering the heterogeneity and temporal complexity of neurodegenerative diseases with Subtype and Stage Inference. Nat Commun 2018;9:4273.
- Andersson JL, Skare S, Ashburner J. How to correct susceptibility distortions in spin-echo echo-planar images: application to diffusion tensor imaging. Neuroimage 2003;20:870-888.
- Andersson JLR, Sotiropoulos SN. An integrated approach to correction for off-resonance effects and subject movement in diffusion MR imaging. Neuroimage 2016;125:1063-1078.
- Basser PJ, Mattiello J, LeBihan D. Estimation of the effective self-diffusion tensor from the NMR spin echo. J Magn Reson B 1994;103:247-254.
- Hua K, Zhang J, Wakana S, et al. Tract probability maps in stereotaxic spaces: analyses of white matter anatomy and tract-specific quantification. Neuroimage 2008;39:336-347.
- Wakana S, Caprihan A, Panzenboeck MM, et al. Reproducibility of quantitative tractography methods applied to cerebral white matter. Neuroimage 2007;36:630-644.
- Boxer AL, Geschwind MD, Belfor N, et al. Patterns of brain atrophy that differentiate corticobasal degeneration syndrome from progressive supranuclear palsy. Arch Neurol 2006;63:81-86.
- Dutt S, Binney RJ, Heuer HW, et al. Progression of brain atrophy in PSP and CBS over 6 months and 1 year. Neurology 2016;87:2016-2025.
- Gröschel K, Hauser TK, Luft A, et al. Magnetic resonance imaging-based volumetry differentiates progressive supranuclear palsy from corticobasal degeneration. Neuroimage 2004;21:714-724.
- Josephs KA, Whitwell JL, Dickson DW, et al. Voxel-based morphometry in autopsy proven PSP and CBD. Neurobiol Aging 2008;29:280-289.
- Kouri N, Murray ME, Hassan A, et al. Neuropathological features of corticobasal degeneration presenting as corticobasal syndrome or Richardson syndrome. Brain 2011;134:3264-3275.
- Koyama M, Yagishita A, Nakata Y, Hayashi M, Bandoh M, Mizutani T. Imaging of corticobasal degeneration syndrome. Neuroradiology 2007;49:905-912.
- Upadhyay N, Suppa A, Piattella MC, et al. Gray and white matter structural changes in corticobasal syndrome. Neurobiol Aging 2016;37:82-90.
- Zhang Y, Walter R, Ng P, et al. Progression of Microstructural Degeneration in Progressive Supranuclear Palsy and Corticobasal Syndrome: A Longitudinal Diffusion Tensor Imaging Study. PLoS One 2016;11:e0157218.
- Nicastro N, Wegrzyk J, Preti MG, et al. Classification of degenerative parkinsonism subtypes by support-vector-machine analysis and striatal (123)I-FP-CIT indices. J Neurol 2019;266:1771-1781.
- Aerts MB, Esselink RA, Bloem BR, Verbeek MM. Cerebrospinal fluid tau and phosphorylated tau protein are elevated in corticobasal syndrome. Mov Disord 2011;26:169-173.
- Urakami K, Wada K, Arai H, et al. Diagnostic significance of tau protein in cerebrospinal fluid from patients with corticobasal degeneration or progressive supranuclear palsy. J Neurol Sci 2001;183:95-98.
- Correia MM, Rittman T, Barnes CL, et al. Towards accurate and unbiased imaging-based differentiation of Parkinson's disease, progressive supranuclear palsy and corticobasal syndrome. Brain Commun 2020;2:fcaa051.
Figures

Table 1. Demographic characteristics of participants
Abbreviations: PSPRS, PSP Rating Scale, from 0 (best) to 100 (worst); UPDRS-III, Part-III of the Unified Parkinson's Disease Rating Scale, from 0 (best) to 108 (worst); MMSE, Mini-Mental State Examination, from 0 (worst) to 30 (best); MoCA, Montreal Cognitive Assessment, from 0 (worst) to 30 (best); and n.s., not significant. The hypotheses regarding group differences were tested using Fisher’s exact tests for categorical variables and the Mann–Whitney U tests for continuous variables (significant P < 0.05).

Table 2. Confusion matrix for classifying CBS and PSP using SuStaIn
SuStaIn had a classification accuracy of 0.863 and a sensitivity of 0.885 and 0.840 for CBS and PSP, respectively. Thus, SuStaIn was able to classify the diseases of CBS and PSP with higher accuracy than done in previous studies.19, 25-28 This suggested that SuStaIn modeling for disease stage heterogeneity allowed for better stratification between CBS and PSP compared with models that predicted only disease subtypes.11
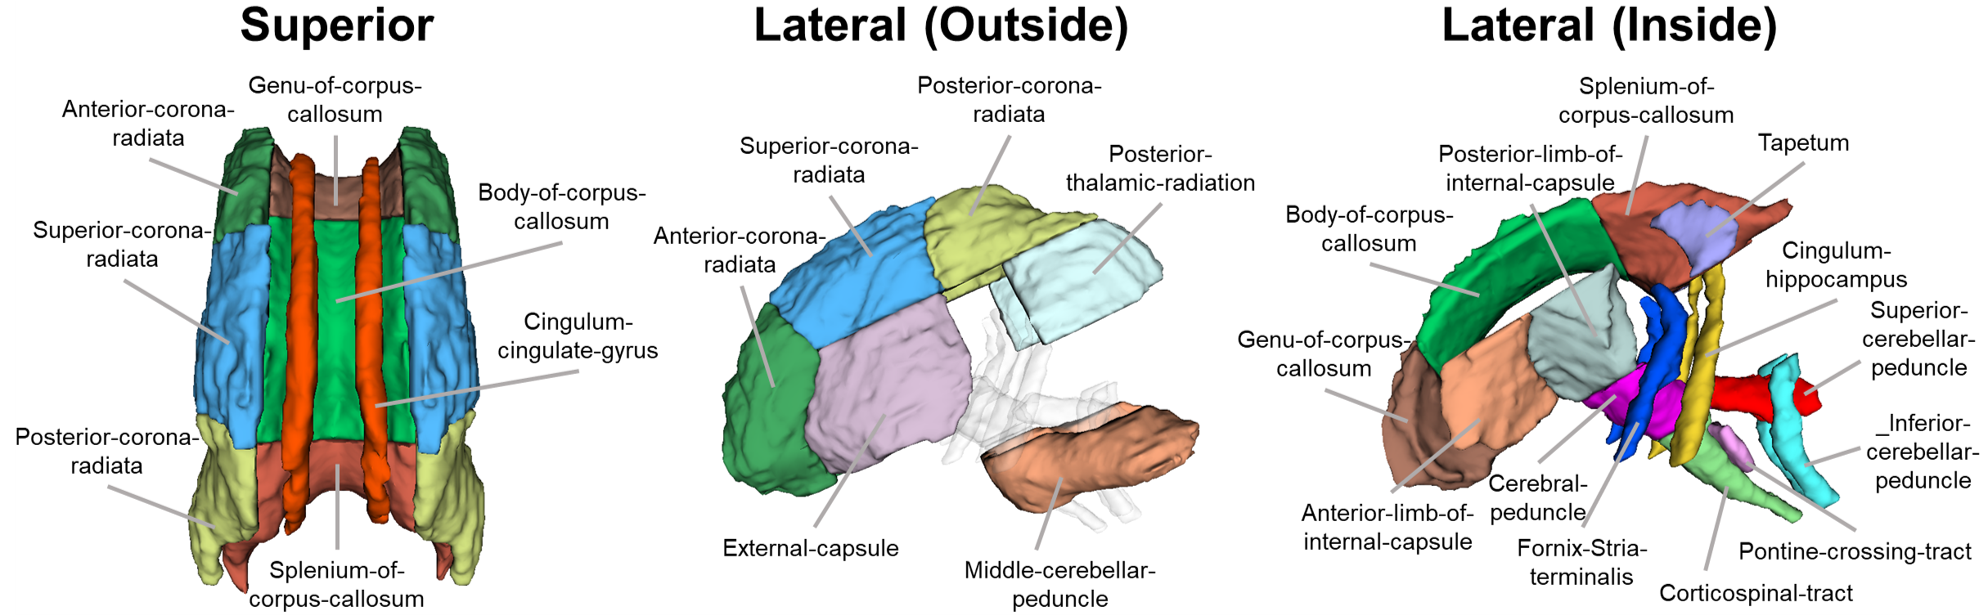
Figure 1. ICBM-DTI-81 WM labels atlas
The average FA of each regional WM tract was measured using ICBM-DTI-81 WM labels atlas15, 16 registered to subject’s diffusion space. The WM tracts were composed of 20 structures.
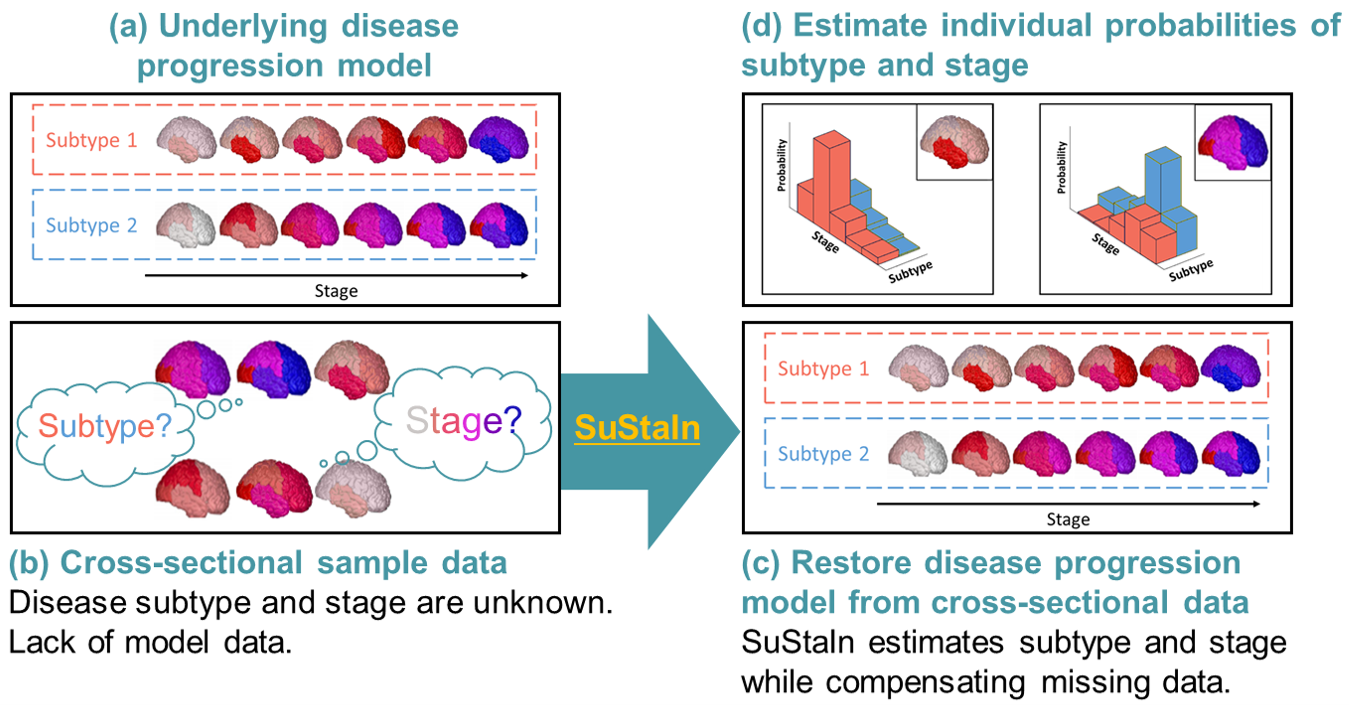
Figure 2. Conceptual overview of SuStaIn modeling
Assuming the underlying model (a), the cross-sectional sample data contains biomarker measurements from each subject with an unknown disease subtype and stage (b). SuStaIn restores disease subtypes and their temporal progression via simultaneous clustering and disease progression modeling (c). Moreover, SuStaIn estimates the probability that the subject belongs to each subtype and stage from the reconstructed snapshot (d). The color of each region indicates the pathologic severity, ranging from white to red to magenta to blue.

Figure 3. SuStaIn modeling of WM degeneration pattern in CBS and PSP using fractional anisotropy
The rows show the distinct temporal WM degeneration patterns of both subtypes, estimated using SuStaIn. Each progression pattern was inferred as a sequential transition of WM tract FA from one z-score to another, relative to the control population. The color at each stage and WM tract indicates the severity of regional WM degeneration with white being normal (z-score of 0), deepening to red for mildly affected (z-score of 1), and deepening to blue for severely affected (z-score over 2).