3500
Establishment of the automated diagnostic system using MR imaging for patients with progressive supranuclear palsy based on in vivo tau imaging1National Institute of Radiological Sciences, National Institutes for Quantum and Radiological Science and Technology, Chiba, Japan, 2Department of Psychiatry, Kyoto University Graduate School of Medicine, Kyoto, Japan, 3Department of Oral and Maxillofacial Radiology, Tokyo Dental College, Tokyo, Japan, 4Neurology Clinic Chiba, Chiba, Japan, 5Department of Radiology and Radiological Science, Johns Hopkins University School of Medicine, Baltimore, MD, United States
Synopsis
MRI-based diagnostic marker is desired for recruiting patients with progressive supranuclear palsy (PSP) for clinical trials of tau-targeting therapies. Elastic Net analysis was applied to a set of 144 MRI-VOIs (MR images-volumes of interest) to determine the VOIs useful for discriminating tau-positive PSP from healthy controls. The MRI-PSP score, calculated from the analysis, demonstrated 90.0% and 91.1% accuracy for training and validation data. The PSP rating scale correlated well with the MRI-PSP score. The MRI-PSP score calculated by an unbiased analysis system would be a promising diagnostic marker and can potentially predict disease severity in PSP.
INTRODUCTION:
Progressive supranuclear palsy (PSP) is a neurodegenerative disease involving the accumulation of abnormal tau aggregates in the brain, resulting in motor and cognitive decline.1 The number of patients has been increasing due to aging populations, and development of disease-modifying drugs for PSP is an urgent issue. 18F-PM-PBB3 and positron emission tomography (PET) can visualize tau pathologies of PSP.2 While tau-PET is a promising method for accurate diagnosis of PSP based on pathological evaluation, the tau-PET availability and versatility are limited partly due to facility requirement, cost, and radiation exposure. In contrast, MRI is a widely used non-invasive modality in clinical practice; however, existing MRI markers for PSP lack pathological validations. We hypothesized that anatomical features of the PSP brain, extracted from a cohort of PSP patients with positive tau accumulation, will be useful for screening candidates for tau-targeted clinical trials.The present study aims to establish an automated analytical system using structural MRI obtained from tau-positive PSP patients and investigate the diagnostic performance and association with disease severity.METHODS:
We employed the training cohort data of 23 healthy controls (HC, age 67.6 ± 5.3 [mean ± SD] y, nine females); 28 PSP Richardson's syndrome (PSP-RS) (70.4 ± 7.7 y, 19 females, PSP rating scale [PSPRS] 40.7 ± 18.5) who met the MDS-PSP criteria and showed a typical topological pattern of tau (18F-PM-PBB3)-PET. Subjects underwent MRI scans on a 3‐Telsa MAGNETOM Verio (SIEMENS), and T1‐weighted images were acquired for coregistration of PET images and volumetric analysis (sagittal orientation as 1‐mm‐thick sections, TR/TE 2300/1.95 ms, flip angle 9.0 degrees, TI 900 ms, FOV 250 mm, matrix size 512 × 512 × 176). We also confirmed that all cases were amyloid-negative using 11C-PiB PET by visual inspection. Typical patterns for PSP-RS with tau-PET images (90-110 min) of standardized uptake value ratios (SUVR) using the cerebellar cortex as reference region were visually determined by four neurologists familiar with imaging analysis. All data were corrected by age and sex, and standardized for analysis based on the training dataset. We obtained 144 volumes of interest (VOIs) by MRI multi-atlas method. Then, Elastic Net leave-one-out-cross-validation (LOOCV) analysis (Python scikit-learn library) was applied to the set of VOIs to determine which VOIs were useful for discriminating PSP from HC. The obtained coefficients were applied to individual data to calculate the sums of multiplication between the coefficients and volumes of VOIs, and defined as MRI-PSP scores. We also recruited 17 HC (67.4 ± 7.2 y, five females) and 5 PSP-RS (73.0 ± 7.8 y, two females, PSPRS 46.6 ± 11.3) for the validation cohort study with the same criteria as the training cohort. We evaluated the diagnostic performance of the MRI-PSP score using the validation cohort and the training cohort. We also evaluated the association between MRI-PSP score and disease severity measured by PSPRS.RESULTS:
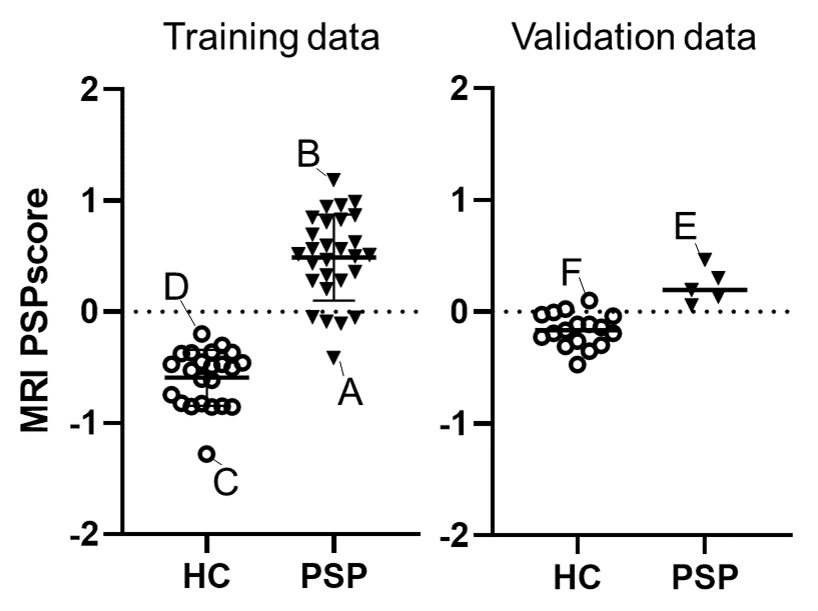
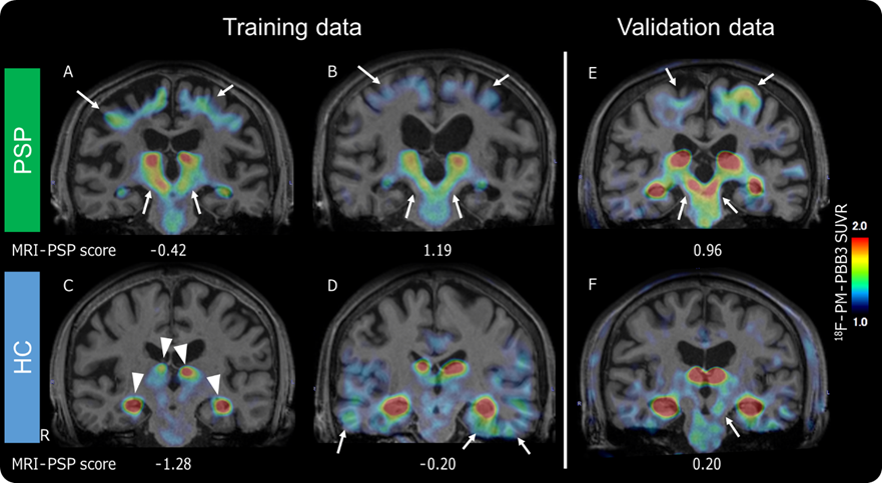
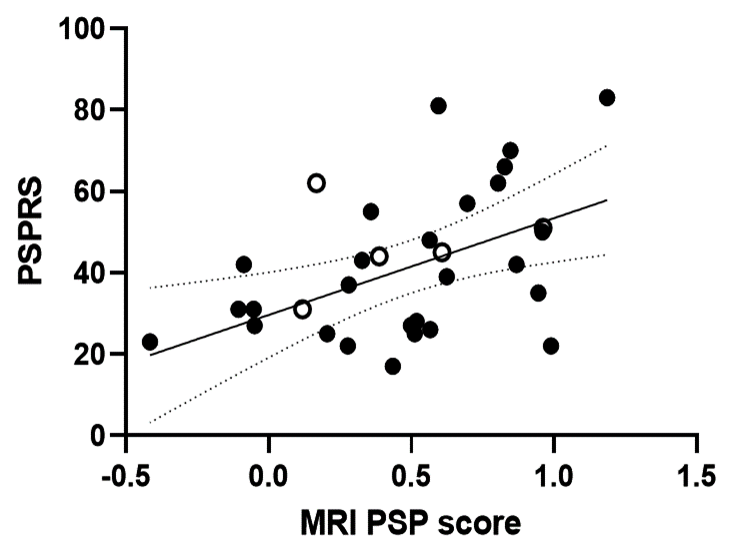
The best parameter for Elastic Net LOOCV analysis to obtain the highest area under the curve (0.968) in the training cohort was L1 ratio 0.5 and alpha 0.284. Globus pallidus and midbrain were selected as pivotal VOIs for calculating the MRI-PSP score (Figures 1, 2). MRI-PSP score for training and validation data showed accuracy of 90.0% and 91.1%, sensitivity of 82.0% and 100.0%, and specificity of 100.0% and 88.0%, respectively (Figure 3). Representative images for high and low MRI-PSP scores with HC and PSP-RS were demonstrated in Figure 4. PSPRS correlated well with MRI-PSP score (Spearman’s rs = 0.46, p = 0.02) (Figure 5).DISCUSSION:
In this study, only PSP-RS patients with tau pathology were selected for the training dataset. The structural MR images in specific regions, which are important for discrimination from HC, were obtained by an unbiased machine learning method. Based on these data, we calculated MRI-PSP scores, which discriminated well between PSP-RS and HC. Validation with another new cohort dataset yielded acceptable positive results. PSP-RS patients with low MRI-PSP scores could be influenced by other factors, such as severe cerebral atrophy and distribution of midbrain tau accumulation. We also noticed HC with high MRI-PSP scores, who may have a prodromal stage for PSP or other tauopathies. Indeed, previous consecutive autopsy studies demonstrated that 35 of 324 (10.8%) cases had tau pathology in the midbrain.3 Although the diagnostic performance of MRI in PSP-RS has been investigated, including midbrain and pons,4 none of the previous studies applied disease-specific VOIs defined by unbiased manner with a comparison between HC and tau-positive PSP. As shown in the validation study, calculation of MRI-PSP scores could be easily applied to other datasets using the coefficients obtained from the present study, and may provide comparable information for a diagnosis based on the pathological evaluation. This score could be useful for prescreening for tau-PET in tau-targeting clinical trials, resulting in cost reduction and efficient recruitment.CONCLUSION:
The unbiased automated analysis system of structural MRI providing MRI-PSP score would be a promising method for diagnosing and predicting disease severity in PSP-RS.Acknowledgements
The authors thank all patients and their caregivers for participation in this study, clinical research coordinators, PET and MRI operators, and research ethics advisers at QST for their assistance to the current projects.References
- Steele JC, Richardson JC, and Olszewski J. Progressive Supranuclear Palsy. A Heterogeneous Degeneration Involving the Brain Stem, Basal Ganglia and Cerebellum With Vertical Gaze and Pseudobulbar Palsy, Nuchal Dystonia and Dementia. Arch Neurol., 1964: 10; 333-59.
- Tagai K, Ono M, Kubota M, et al., High-Contrast In Vivo Imaging of Tau Pathologies in Alzheimer's and Non-Alzheimer's Disease Tauopathies. Neuron., 2020 (In press).
- Nogami A, Yamazaki M, Saito Y, et al. Early Stage of Progressive Supranuclear Palsy: A Neuropathological Study of 324 Consecutive Autopsy Cases. J Nippon Med Sch., 2015: 82; 266-73.
- Whitwell JL, Höglinger GU, Antonini A, et al. Radiological biomarkers for diagnosis in PSP: Where are we and where do we need to be? Mov Disord., 2017; 32: 955-971.
Figures
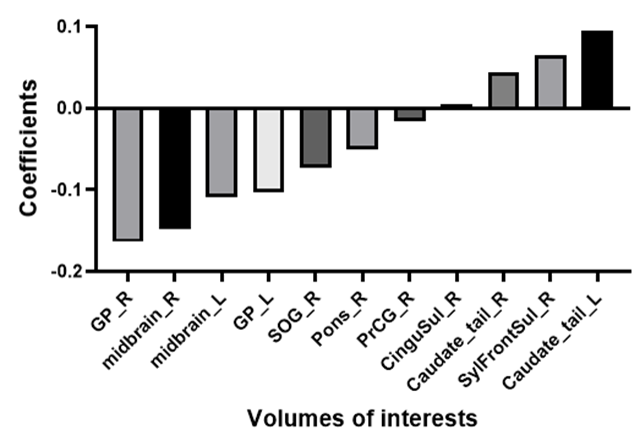
The graph shows important VOIs obtained from multi-atlas method to discriminate between HC and PSP.
Abbreviations and explanations: CinguSul: Cingular Cortex Sulci, GP: Globus Pallidus, L: left, midbrain: Red Nucleus + Substantia Nigra + Cerebral peduncle + MIDBRAIN (rest of midbrain region), Pons: Corticospinal tract + Superior cerebellar peduncle + Middle cerebellar peduncle + Pontine crossing tract + Medial lemniscus + PONS (rest of Pons region), PrCG: Precentral Gyrus, R: right, SOG: Superior Occipital Gyrus, SylFrontSul: Sylvian Fissure Frontal Lobe Part
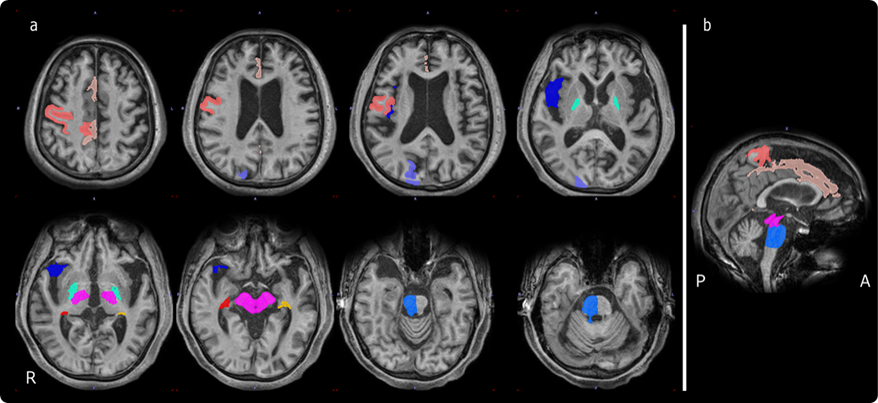
The panel shows regions of the VOIs on MRI (a: axial images; orange: Precentral Gyrus_R, beige: Cingular Cortex Sulci_R, purple: Superior Occipital Gyrus_R, light blue: bilateral Globus Pallidus, dark blue: Sylvian Fissure Frontal Lobe Part_R, pink: bilateral midbrain, red: Caudate_tail_R, yellow: Caudate_tail_L, blue: Pons_R, b: sagittal image).
Abbreviations: A: anterior, P: posterior, R: right