3498
Classification of Alzheimer's Disease Based on Amyloid-PET using Random Forest Ensemble1Department of diagnostic radiology, University of Hong Kong, Hong Kong, Hong Kong, 2Department of medicine, Queen Mary Hospital, Hong Kong, Hong Kong, 3Department of brain sciences, Imperial College London, London, United Kingdom
Synopsis
Random forest model as a high efficacy classifier was incorporated in our study for supporting clinical diagnosis. We aimed at evaluating the accuracy of RF model in distinguishing HC, MCI from AD and the importance of various neuroradiological features in selection. Additionally, in order to unify quantitative amyloid uptake across three cohorts, we transformed SUVR into standard Centiloid unit. The results indicated that RF model had moderate to high accuracy in differentiating AD from HC and MCI. Regional Ab load had more important effects than other features in distinguishing AD from others.
Introduction
Alzheimer’s disease (AD) is a neurodegenerative disorder with progressive pathological changes leading to cognitive impairment [1]. Within the continuum from cognitively normal to AD, mild cognitive impairment (MCI) is an intermediate stage with moderate neuropathological changes [2, 3]. MCI is also believed as a precursor of AD without clinical presentations [4]. Since earlier detection of the disease might lead to better therapy[5], current research focuses on the incorporation of biomarkers to predict conversion from cognitively normal elderly adults (HC), to MCI and eventually AD. Positron Emission Topography (PET) and Magnetic Resonance Imaging (MRI) are two major in-vivo techniques for detection of AD-related pathological changes, such as amyloid-beta (Ab) deposition, and cortical atrophy respectively [6-8]. However, complex interactions among the biomarkers increase the difficulty for human interpretation [9]. Random forest (RF) model as one of machine learning algorithms is an effective classifier for supporting clinical classification. Additionally, RF is featured with robustness to noise and a high ability to process non-linear correlated data [10].In current study, we aim at evaluating the accuracy of RF model in distinguishing HC, MCI from AD, and the importance of various neuropathological features in selection.Metholody
Cohorts: Three cohorts were included in our study. We recruited 94 AD, 82 MCI and 85 HC from GAAIN (The Global Alzheimer’s Association Interactive Network) database, AIBL (Australian imaging, biomarkers and lifestyle) database, and our memory clinic database. Image processing: All the raw MRI and PET images of each subject were processed by SPM12 (Statistical Parametric Mapping) and followed by Centiloid pipeline (details described in Centiloid paper) [11]. In addition, normalized MRI images were segmented by CAT12 (Computational Anatomy Toolbox) based on AAL (Automated Anatomical Labelling) template and DK (Desikan-Killiany) atlas to obtain 122 regional volumes and 68 cortical thicknesses as input features. Global CTX mask was obtained from Centiloid project directly and 16 small regional masks were created by wfu_pickatlas toolbox. Noticeably, subjects included in our study were injected with two different tracers. To standardize quantitative amyloid measures, we repeated Centiloid project procedures to transfer SUVR11C-PiB and SUVR11F-Flutemetamol into Centiloid unit for comparison. The final 17 regional amyloid -Regions-of-Interest (ROI) in Centiloid unit were input as features. RF algorithm: RF algorithm was performed on Python via scikit-learn package. The performance validation was based on OOB (out of bag) estimation. Gini index was used for intrinsic feature selection and total 1000 trees were included in the model. 70% of all cases were randomly selected as a training set and the left 30% were used as a testing set.Results
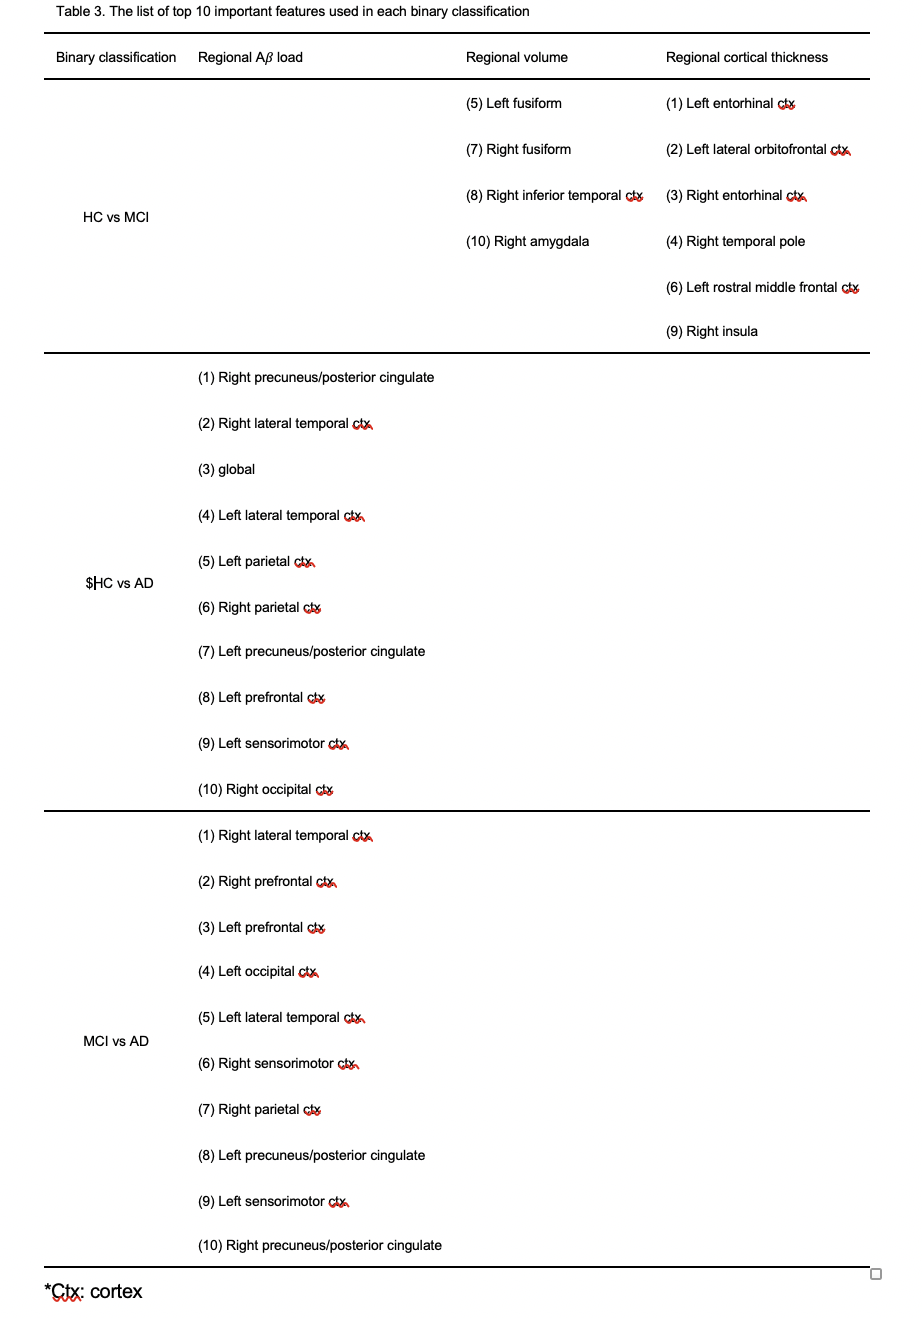
As listed in table 1, 65 AD, 20 MCI, and 10 HC subjects were included from GANNI database. At the same time, 12 AD, 26 MCI, 75 HC subjects and 17 AD, 36 MCI were recruited from AIBL database and our memory clinic respectively. The OOB score was 0.82, 0.87 and 0.78 in each binary classification (table 2). The AUC value was highest (AUC=0.82) in the classification between HC and AD, middle (AUC=0.78) between HC and MCI and lowest (AUC=0.65) between AD and MCI. In each binary classification, sensitivity-71%, specificity-85%, accuracy-78%; sensitivity-88%, specificity-76%, accuracy-81% and sensitivity-86%, specificity-44%, accuracy-66% were achieved in differentiating MCI from HC, AD from HC and AD from MCI separately (table 2). As importance ranking of features by RF model, the top 10 features contributing to differentiation was listed in table 3. 6 features of regional cortical thickness and 4 features of regional volume were presented in the classification between HC and MCI. However, all 10 essential features belong to regional A𝛽 -ROI in classification between HC and AD as well as MCI and AD.Discussion
According to our results, the accuracy in differentiating HC from AD was highest (81%), while the accuracy was lower in differentiating HC from MCI (78%) and MCI from AD (66%). It is consistent with previous studies [12-15]. Although brain atrophy is thought as a late biomarker in the time course [16]., regional volume and regional cortical thickness were more essential in binary classification between HC and MCI in our study. The possible reason may be explained by the bi-variate amyloid deposition in MCI subjects [17]. Part of MCI subjects were amyloid-positive similar to AD subjects and the others were amyloid-negative same as healthy controls [18, 19]. Hence, Ab burden in MCI group might be weakened as a discriminating feature. Besides, in the classification of AD from HC and MCI, regional Ab load played an important role instead. Comparing AD from HC, Ab load in precuneus / posterior cingulate, lateral temporal cortex and parietal cortex characteristic with early hierarchical regional progression pattern was more effective than other regions [20, 21]. While in comparison of MCI and AD, except in lateral temporal cortex and prefrontal cortex, Ab load in occipital lobe (left side) as late affected region was also highlighted in our result [22]. The result may reflect our high proportion of amyloid-negative MCI subjects. Furthermore, indicated by Jack et al study [1], the correlation between cognitive impairment and AD-related pathophysiology could vary due to individual cognitive reserve. Therefore, amyloid-positive MCI subjects may have similar spatial Ab patterns as the advanced AD stage.Acknowledgements
We would like to thank the State Key Laboratory of Brain and Cognitive Sciences, HKU for research funding.References
1. Jack, C.R., Jr., et al., Tracking pathophysiological processes in Alzheimer's disease: an updated hypothetical model of dynamic biomarkers. Lancet Neurology, 2013. 12(2): p. 207-16.
2. Petersen, R.C., Mild cognitive impairment as a diagnostic entity. Journal of Internal Medicine, 2004. 256(3): p. 183-194.
3. Visser, P.J., et al., Prevalence and prognostic value of CSF markers of Alzheimer's disease pathology in patients with subjective cognitive impairment or mild cognitive impairment in the DESCRIPA study: a prospective cohort study. Lancet Neurol, 2009. 8(7): p. 619-627.
4. Minati, L., et al., Current concepts in Alzheimer's disease: a multidisciplinary review. Am J Alzheimers Dis Other Demen, 2009. 24(2): p. 95-121.
5. Cabral, C. and M. Silveira, Classification of Alzheimer's disease from FDG-PET images using favourite class ensembles. Annu Int Conf IEEE Eng Med Biol Soc, 2013. 2013: p. 2477-80.
6. Dubois, B., et al., Advancing research diagnostic criteria for Alzheimer's disease: the IWG-2 criteria. Lancet Neurology, 2014. 13(6): p. 614-629.
7. Albert, M.S., et al., The diagnosis of mild cognitive impairment due to Alzheimer’s disease: Recommendations from the National Institute on Aging-Alzheimer’s Association workgroups on diagnostic guidelines for Alzheimer's disease. Alzheimer's & Dementia: The Journal of the Alzheimer's Association, 2011. 7(3): p. 270-279.
8. McKhann, G.M., et al., The diagnosis of dementia due to Alzheimer’s disease: Recommendations from the National Institute on Aging-Alzheimer’s Association workgroups on diagnostic guidelines for Alzheimer's disease. Alzheimer's & Dementia: The Journal of the Alzheimer's Association, 2011. 7(3): p. 263-269.
9. Sarica, A., A. Cerasa, and A. Quattrone, Random Forest Algorithm for the Classification of Neuroimaging Data in Alzheimer's Disease: A Systematic Review. Front Aging Neurosci, 2017. 9: p. 329-329.
10. Caruana, R. and A. Niculescu-Mizil, An empirical comparison of supervised learning algorithms, in ACM International Conference Proceeding Series. 2006, ACM. p. 161-168.
11. Klunk, W.E., et al., The Centiloid project: Standardizing quantitative amyloid plaque estimation by PET. 2015.
12. Gray, K.R., et al., Random forest-based similarity measures for multi-modal classification of Alzheimer's disease. Neuroimage, 2013. 65: p. 167-175.
13. Lebedev, A.V., et al., Random Forest ensembles for detection and prediction of Alzheimer's disease with a good between-cohort robustness. Neuroimage Clin, 2014. 6(C): p. 115-125.
14. Lebedeva, A.K., et al., MRI-Based Classification Models in Prediction of Mild Cognitive Impairment and Dementia in Late-Life Depression. Front Aging Neurosci, 2017. 9: p. 13-13.
15. Maggipinto, T., et al., DTI measurements for Alzheimer's classification. Phys Med Biol, 2017. 62(6): p. 2361-2375.
16. Jack, C., et al., Hypothetical model of dynamic biomarkers of the Alzheimer's pathological cascade. Lancet Neurology, 2010. 9(1): p. 119-128.
17. Rodrigue, K.M., K.M. Kennedy, and D.C. Park, Beta-amyloid deposition and the aging brain. Neuropsychol Rev, 2009. 19(4): p. 436-50.
18. Jack, C.R., et al., 11 C PiB and structural MRI provide complementary information in imaging of Alzheimer's disease and amnestic mild cognitive impairment. Brain, 2008. 131(3): p. 665-680.
19. Kemppainen, N.M., et al., PET amyloid ligand [11C]PIB uptake is increased in mild cognitive impairment. Neurology, 2007. 68(19): p. 1603-1606.
20. Grothe, J.M., et al., In vivo staging of regional amyloid deposition. Neurology, 2017. 89(20): p. 2031-2038.
21. Thal, D.R., et al., Phases of A beta-deposition in the human brain and its relevance for the development of AD. Neurology, 2002. 58(12): p. 1791-1800.
22. Cho, H., et al., In vivo cortical spreading pattern of tau and amyloid in the Alzheimer disease spectrum. Annals of neurology, 2016. 80(2): p. 247-258.
Figures