3494
Preoperative MR Radiomics for Prediction of Progression and Recurrence in Non-functional Pituitary Macroadenomas1Department of Medical Imaging, Chi Mei Medical Center, Tainan, Taiwan, 2Department of Health and Nutrition, Chia Nan University of Pharmacy and Science, Tainan, Taiwan, 3Department of Radiological Sciences, University of California, Irvine, CA, CA, United States, 4Department of Radiology, E-Da Hospital and I-Shou University, Kaohsiung, Taiwan
Synopsis
A subset of nonfunctioning pituitary macroadenomas (NFPAs) may show early progression/recurrence (P/R) after surgery. In clinical practice, one of the main challenges in the treatment of NFPAs is to determine factors associated with P/R. This study investigated the role of preoperative MR radiomics based on support vector machine (SVM) for the prediction of P/R in NFPAs. The three most significant radiomic features selected by SVM were used to calculate SVM score for each patient. High SVM scores were associated with P/R and short progression-free survival in NFPAs.
Background and Purpose
Pituitary tumors constitute 10%-15% of all primary brain tumors [1]. Further, the nonfunctioning pituitary macroadenomas (NFPAs) is the most frequent type of pituitary tumor [2]. Although most NFPAs are classified as benign adenoma based on the 2017 WHO classification system [3] , a subset of these adenomas have been shown to undergo early progression/recurrence (P/R) after surgical resection [4]. In clinical practice, gross-total resection (GTR) by a transsphenoidal approach (TSA) is the optimal treatment for NFPAs; however, this aim is often difficult to achieve in the large and solid NFPAs [5]. Conventional MR imaging findings such as cavernous sinus invasion, tumor size, and absence of apoplexy had been reported as the important imaging parameters related to P/R in NFPAs [6]. However, the association of quantitative MR radiomics analysis for prediction of P/R in NFPAs has rarely been reported. In this study, we investigated the role of preoperative MR radiomics based on SVM for the prediction of P/R in NFPAs.Materials and Methods
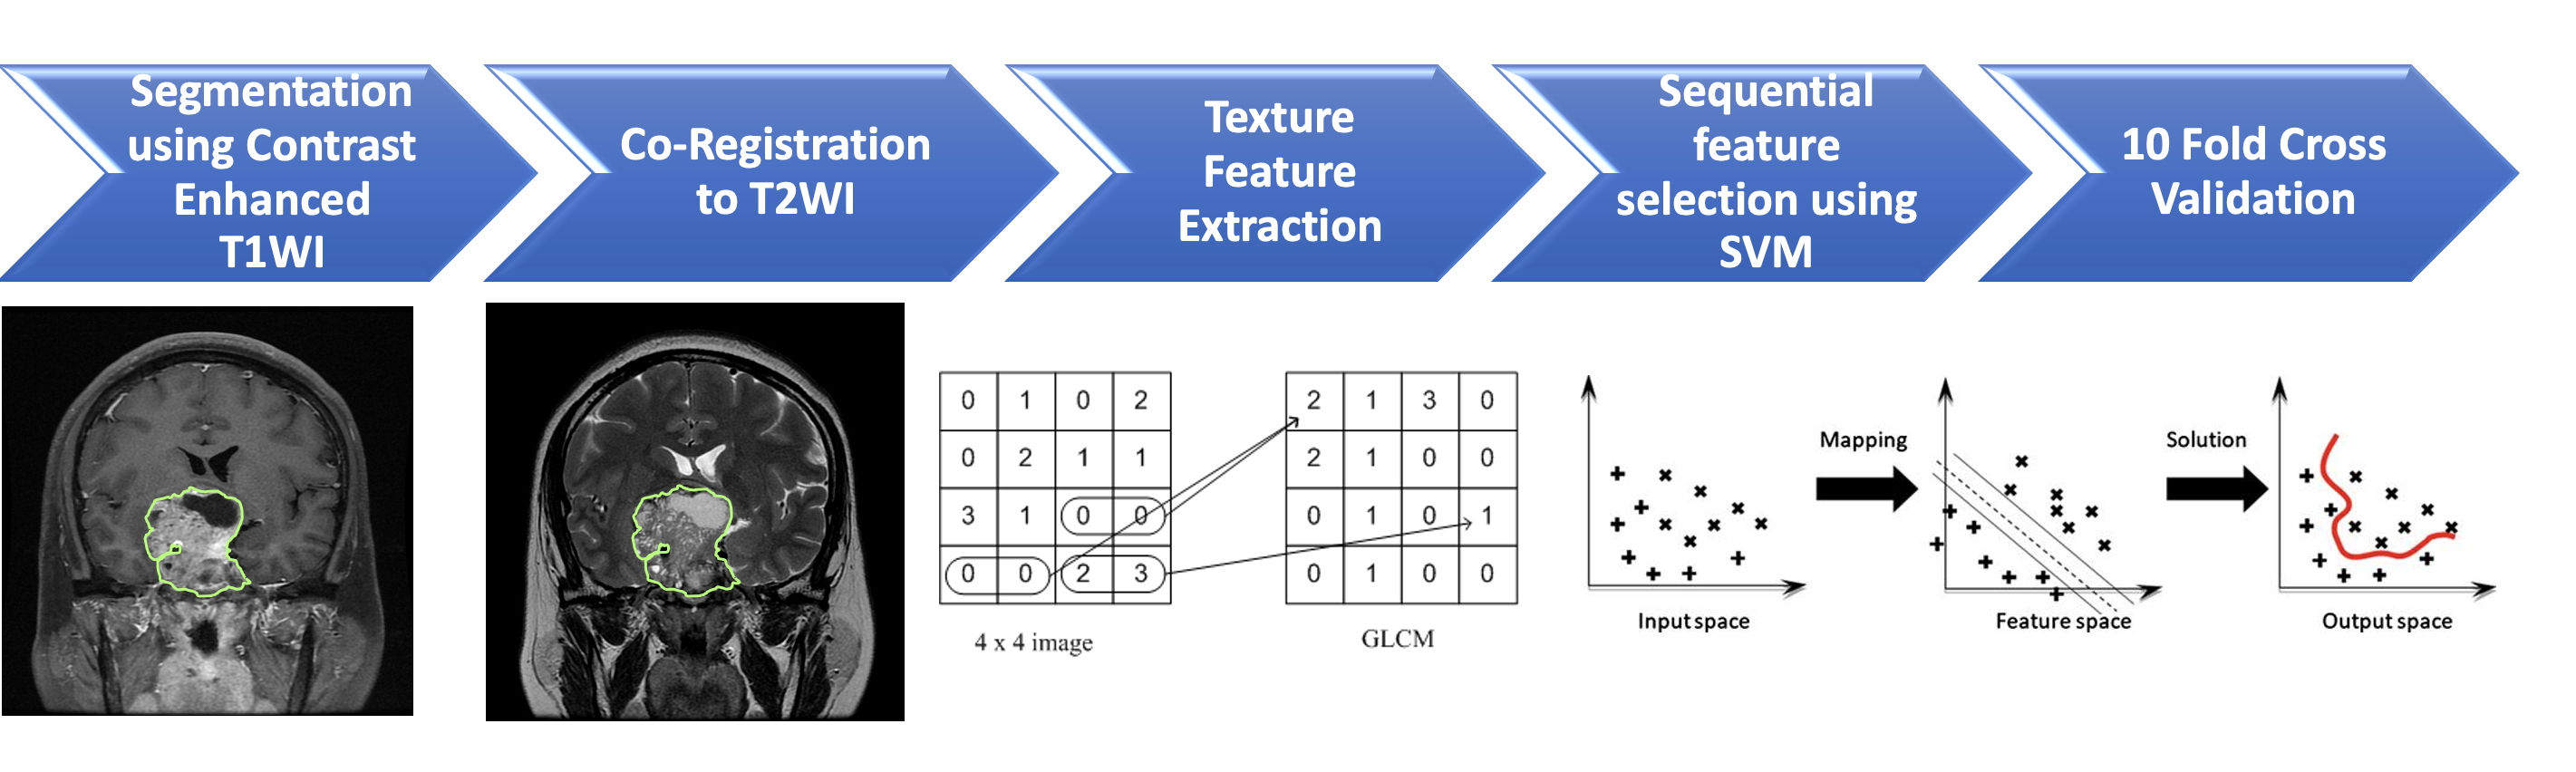
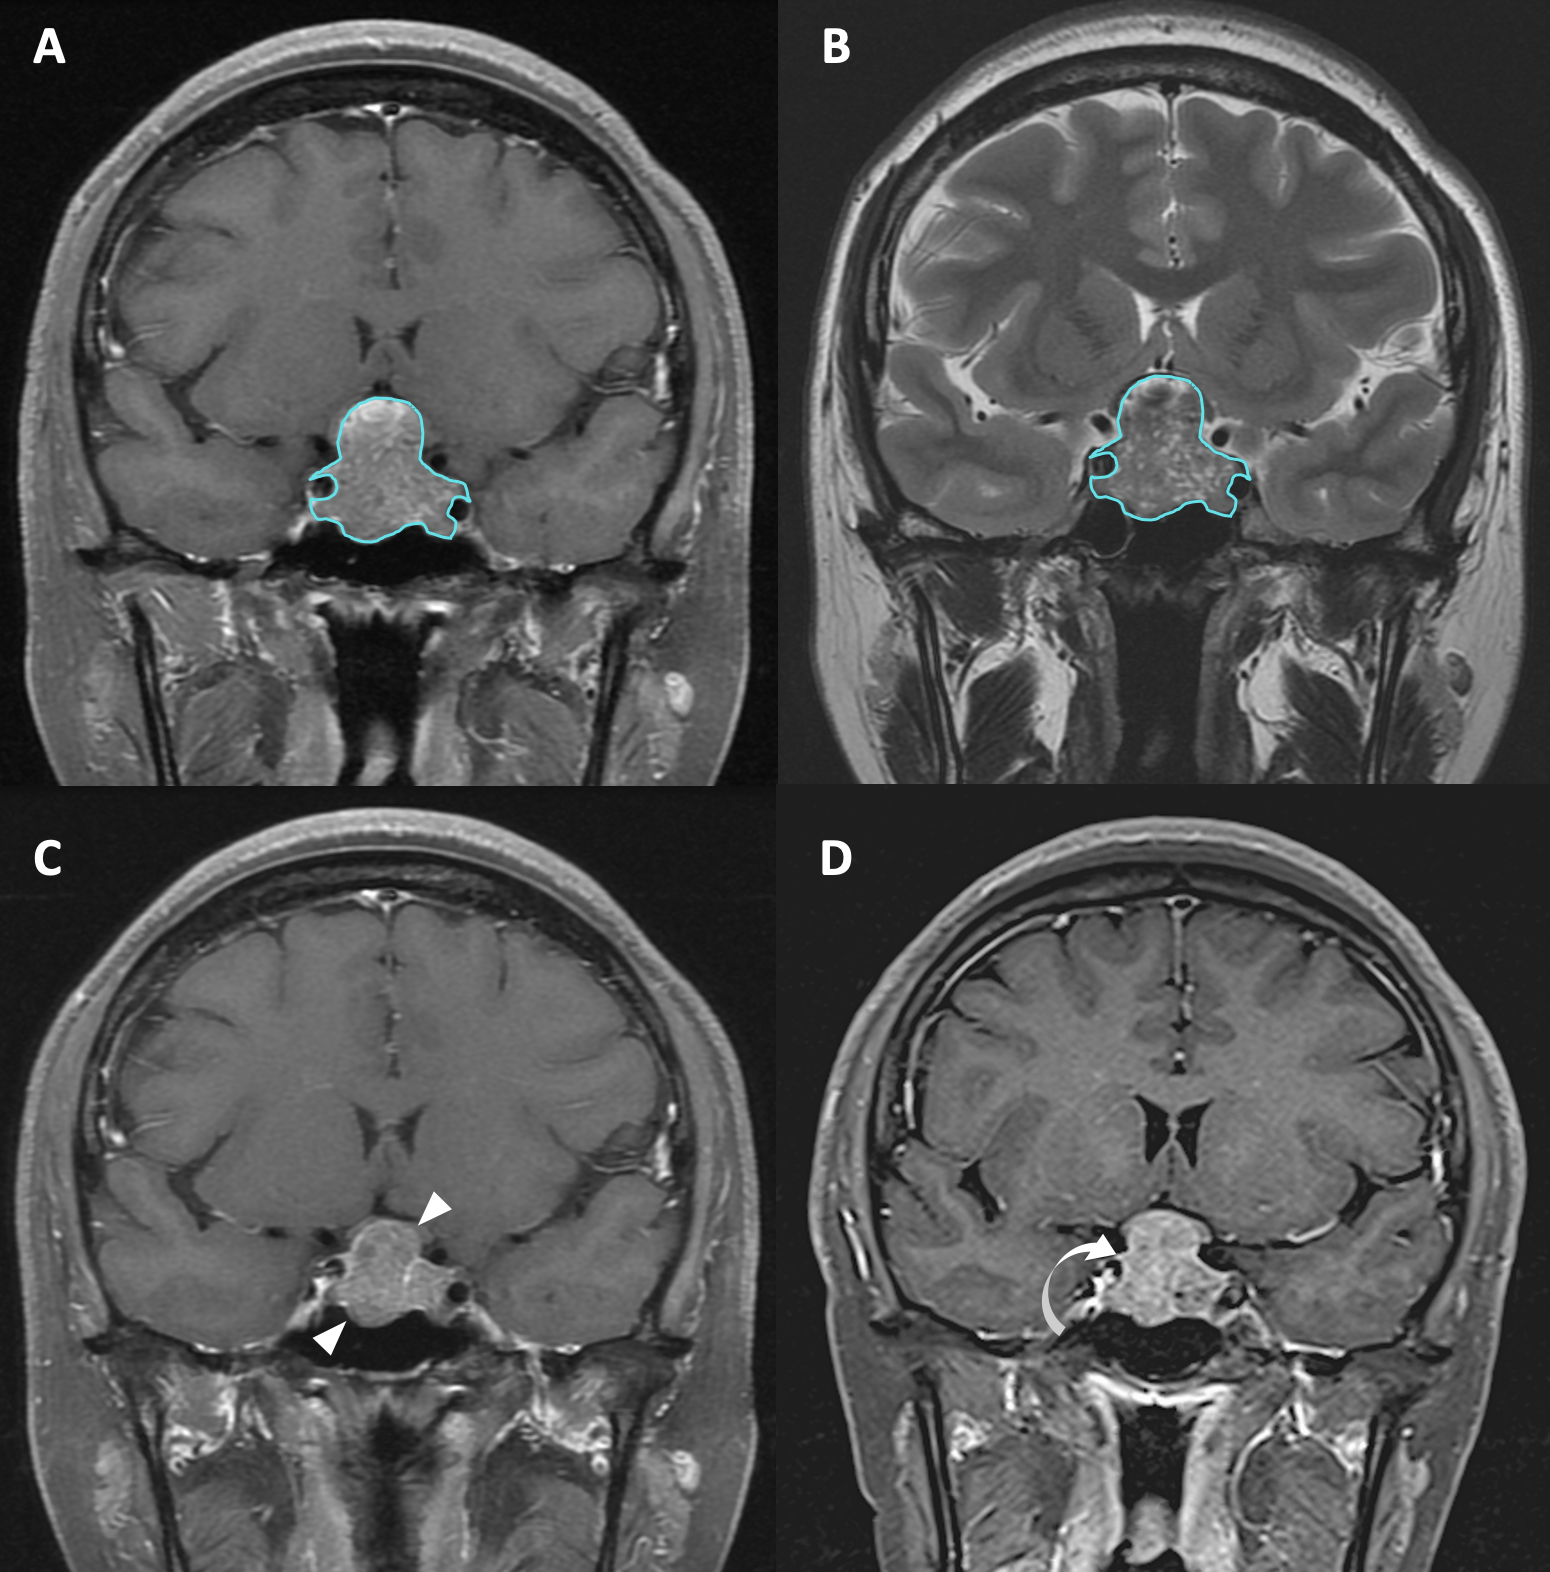
The inclusion criteria of this study were patients diagnosed with NFPAs by MRI and pathological confirmation and had post-operative MRI follow-up for more than 1-year after surgery. From September 2010 to December 2017, total 50 patients (median age, 52 years) were included in this study. The MRI images were acquired using a 1.5T or a 3.0T MRI scanner. The protocols of MR imaging included axial and sagittal spin echo T1-weighted imaging (T1WI), axial and coronal fast spin echo T2-weighted imaging (T2WI). Coronal and sagittal contrast-enhanced (CE) T1WI with fat saturation were performed. Figure 1 shows the workflow of the analysis process. The tumor was segmented from the coronal contrast enhanced T1WI. Then the fuzzy c-mean (FCM) clustering based algorithm was developed to calculate the outline of the lesion region of interest (ROI) on each imaging slice [7]. After segmentation, the ROIs from all imaging slices containing this lesion were combined to obtain 3D information of the whole lesion. Then 3D connected-component labeling was applied to remove scattered voxels not connecting to the main lesion ROI, and hole-filling algorithm was applied to include all voxels contained within the main ROI which were labeled as non-lesion. The segmented tumor mask was co-registered to T2W images to localize the tumor location on corresponding images using affine transformation. This process was done by FMRIB’s Linear Image Registration Tool (FLIRT) [8]. Within segmented tumor on enhanced T1W images and T2W images, 32 first order features and 75 textural features were extracted on each modality. Thus, totally we obtained 214 descriptors. To evaluate the importance of these features in differentiating P/R, sequential feature selection process was utilized via constructing multiple support vector machine (SVM) classifiers. Three radiomic features, including T1 surface-to-volume ratio, T1 GLCM Informational Measure of Correlation, and T2 NGTDM Coarseness with the highest importance were selected to build the final SVM classification model with Gaussian kernel. 10 folds cross-validation method was applied to test the model performance. The personalized SVM score was calculated for each patient based on the three selected features. This procedure was implemented in MATLAB 2018b.Results
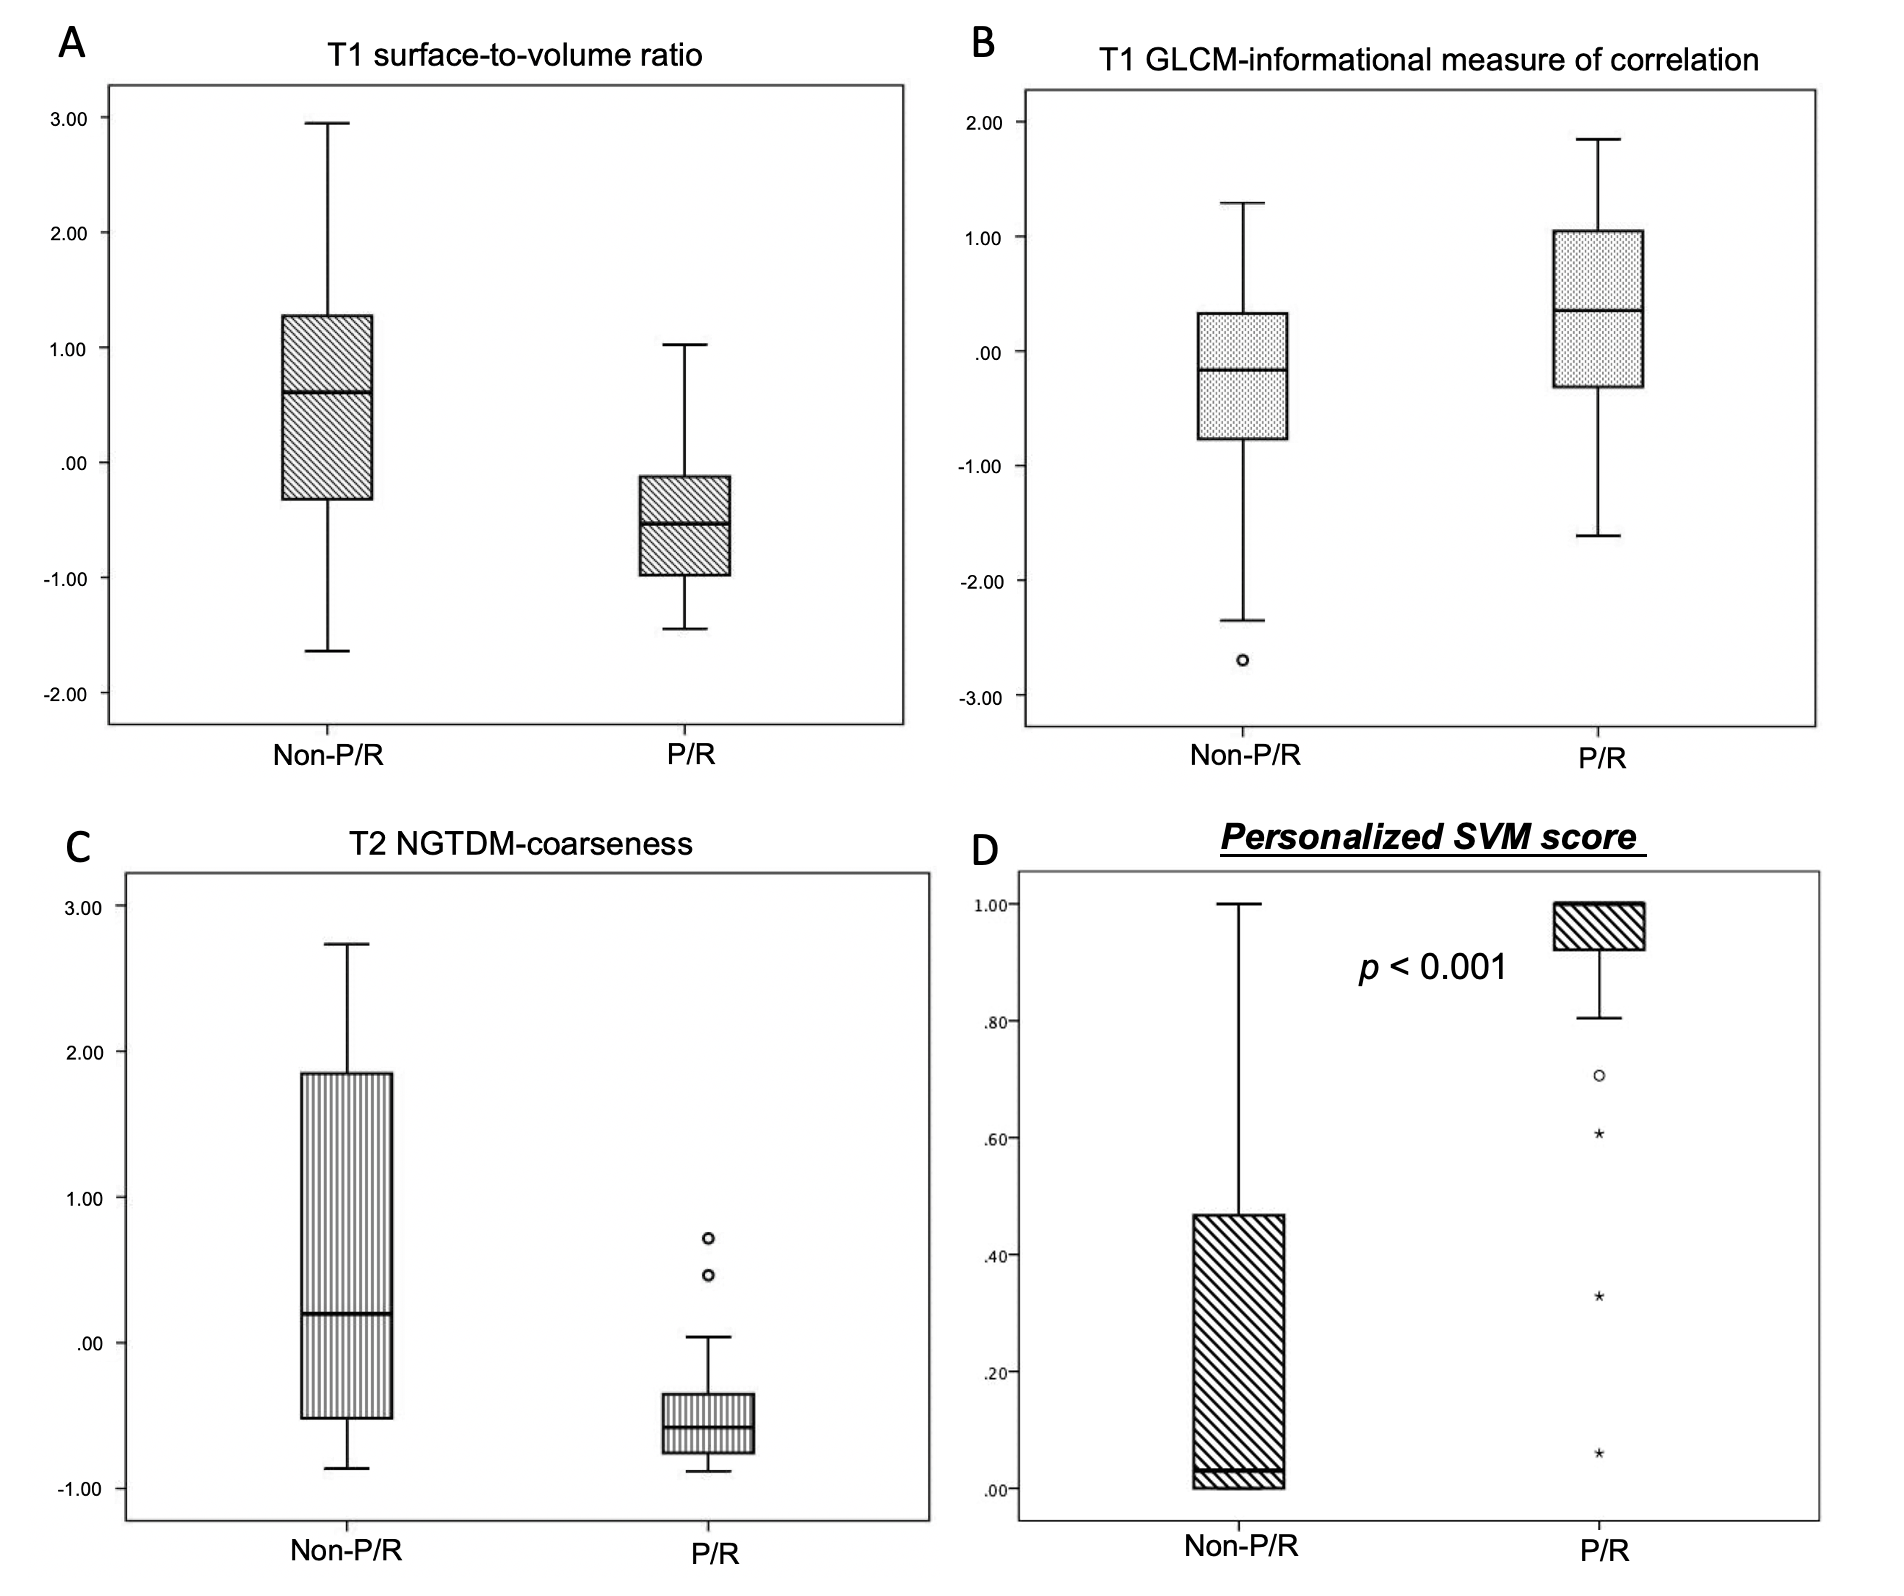
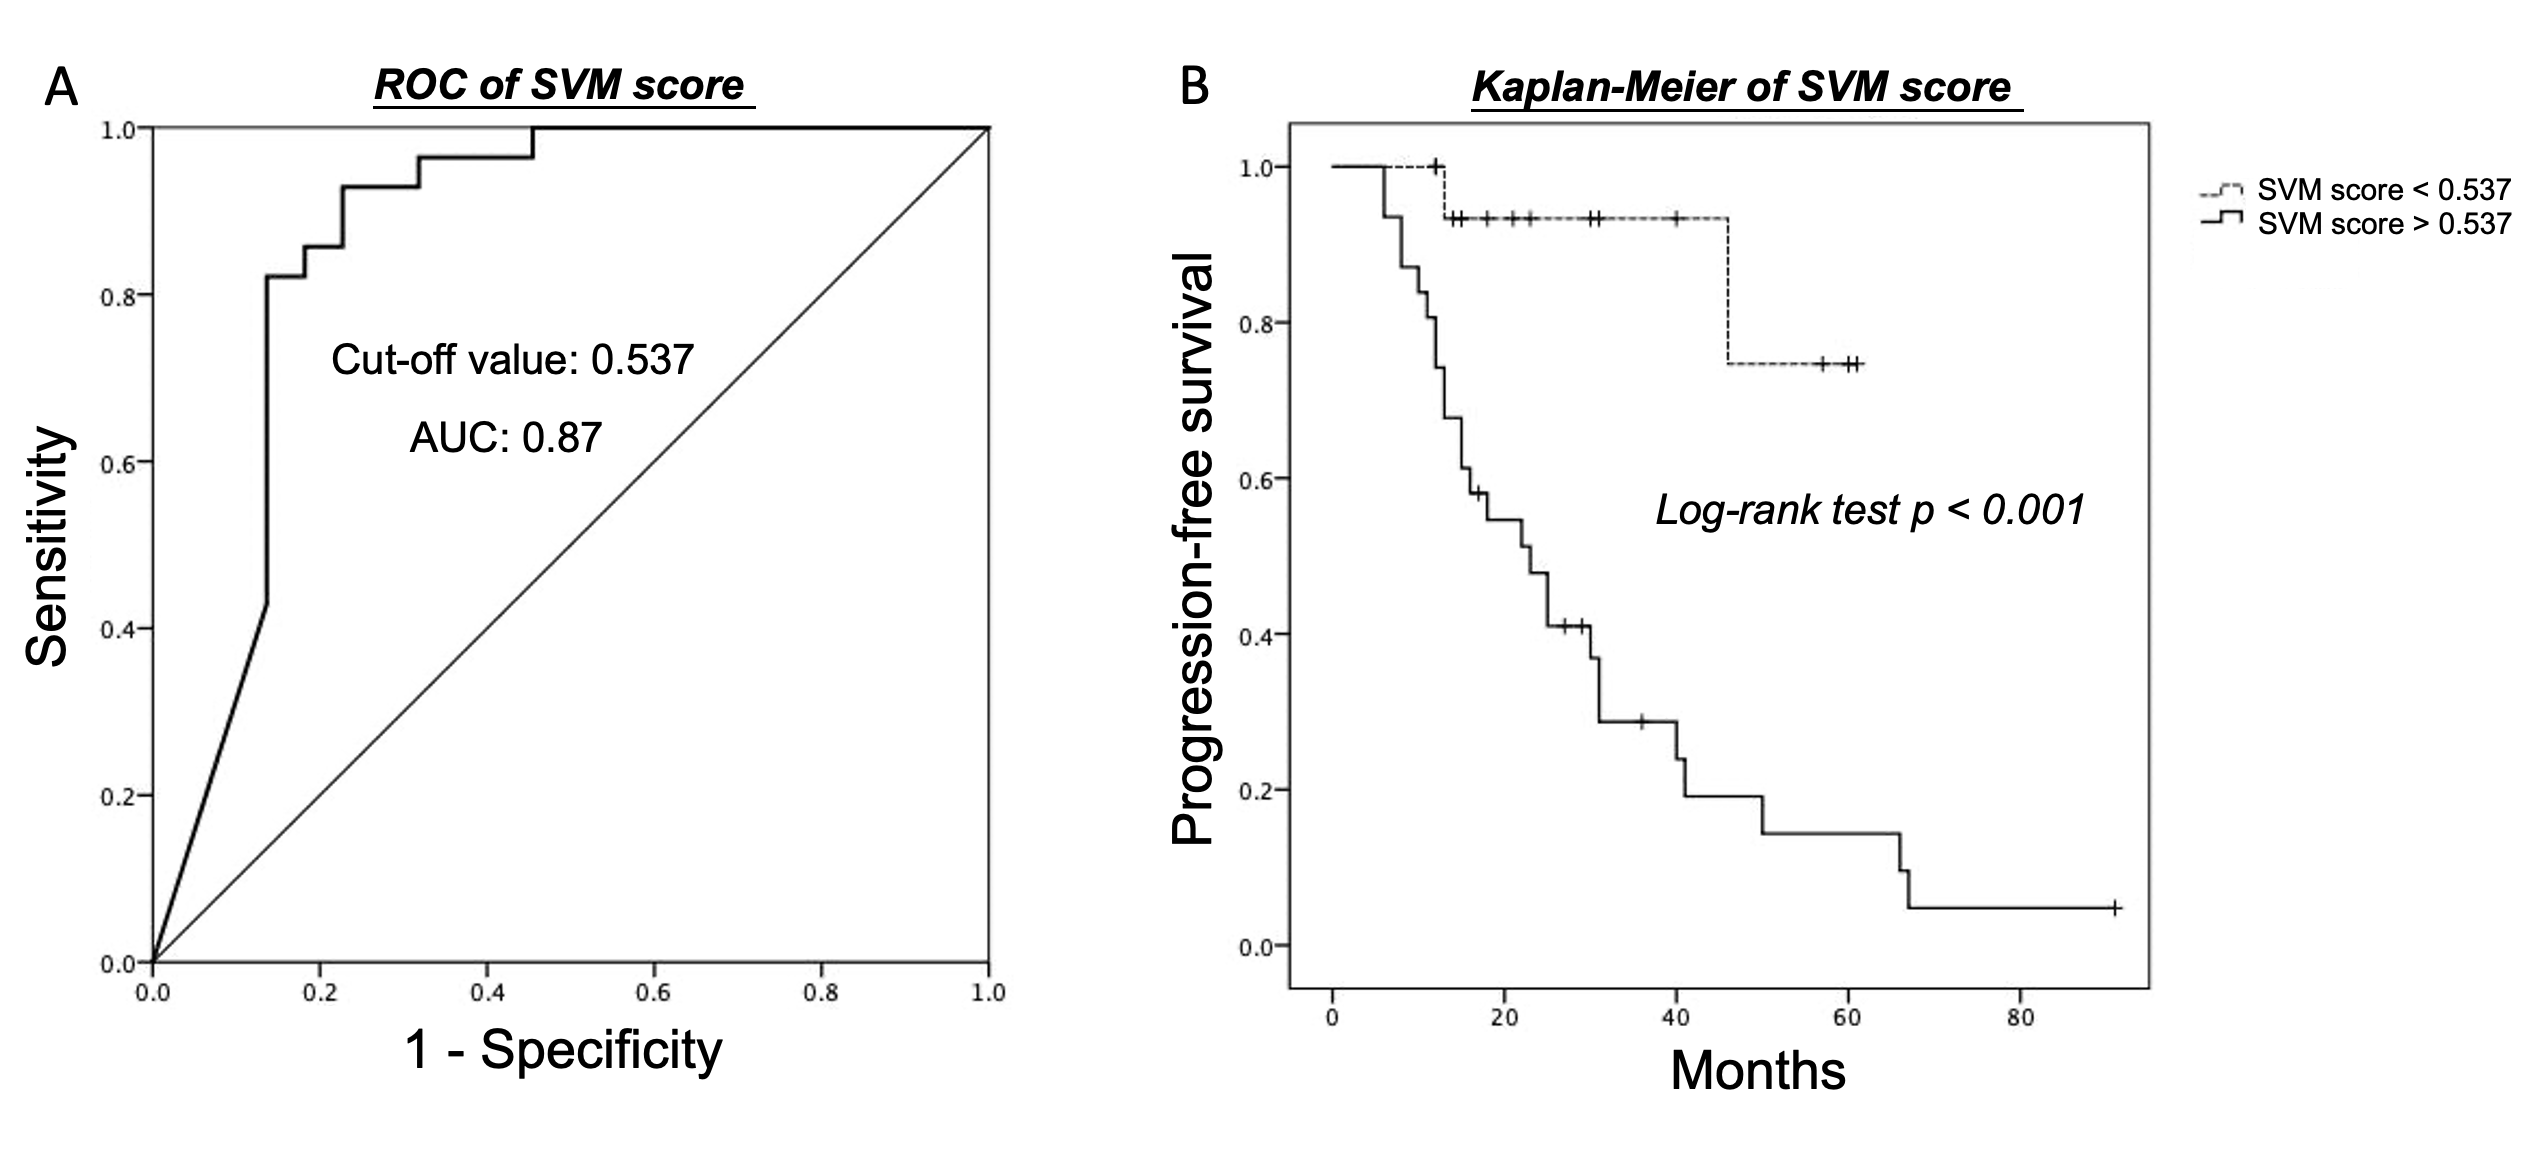
P/R was diagnosed in twenty-eight (28/50, 56%) patients. In radiomics analyses, the most important three parameters selected by the SVM model for the prediction of P/R were: T1 surface-to-volume radio, T1 GLCM-informational measure of correlation, and T2 NGTDM-coarseness, and all show significant differences (Mann-Whitney U test) (Figure 3). The optimal cut-off value of SVM score for differentiation of P/R was 0.537, with AUC of 0.87 (Figure 4). When tumor progression trends were compared, patients with high SVM score (more than the cut-off value of 0.537) were found to exhibit shorter progression-free survival (PFS) (p < 0.001) (Figure 4). In multivariate Cox hazards analysis, symptoms of sex hormones, hypopituitarism, and SVM score were high risk factors for P/R (p < 0.05) with hazard ratios of 10.71, 2.68, and 6.88 respectively.Conclusions
We developed a MR radiomics model to predict P/R in NFPAs. The calculated personalized SVM score had good performance in prediction of P/R for NFPAs, and patients with higher SVM score were found to exhibit shorter PFS. The results offer useful information for treatment planning in NFPAs.Acknowledgements
NoneReferences
1. Ostrom QT, Gittleman H, Farah P, Ondracek A, Chen Y, Wolinsky Y, Stroup NE, Kruchko C, Barnholtz-Sloan JS (2013) CBTRUS statistical report: Primary brain and central nervous system tumors diagnosed in the United States in 2006-2010. Neuro Oncol 15 Suppl 2:ii1-56. doi:10.1093/neuonc/not151.
2. Molitch ME (2008) Nonfunctioning pituitary tumors and pituitary incidentalomas. Endocrinology and metabolism clinics of North America 37 (1):151-171, xi. doi:10.1016/j.ecl.2007.10.011.
3. Lloyd RV, Osamura RY, Klöppel G, Rosai J (2017) WHO Classification of Tumours of Endocrine Organs ed 4. IARC Press, Lyon.
4. Roelfsema F, Biermasz NR, Pereira AM (2012) Clinical factors involved in the recurrence of pituitary adenomas after surgical remission: a structured review and meta-analysis. Pituitary 15 (1):71-83.
5. Boxerman JL, Rogg JM, Donahue JE, Machan JT, Goldman MA, Doberstein CE (2010) Preoperative MRI evaluation of pituitary macroadenoma: imaging features predictive of successful transsphenoidal surgery. AJR American journal of roentgenology 195 (3):720-728. doi:10.2214/ajr.09.4128.
6. Brochier S, Galland F, Kujas M, Parker F, Gaillard S, Raftopoulos C, Young J, Alexopoulou O, Maiter D, Chanson P (2010) Factors predicting relapse of nonfunctioning pituitary macroadenomas after neurosurgery: a study of 142 patients. European journal of endocrinology 163 (2):193-200. doi:10.1530/eje-10-0255.
7. Nasrabadi NM (2007) Pattern recognition and machine learning. Journal of electronic imaging 16 (4):049901.
8. Jenkinson M, Bannister P, Brady M, Smith S (2002) Improved optimization for the robust and accurate linear registration and motion correction of brain images. Neuroimage 17 (2):825-841.
Figures