3491
Deep learning-based Cerebral Microbleeds detection on quantitative susceptibility mapping(QSM) for Stroke Cohort1Department of Diagnostic Radiology, The University of Hong Kong, Hong Kong, China, 2Department of Rehabilitation Science, The Hong Kong Polytechnic University, Hong Kong, China
Synopsis
Cerebral microbleeds (CMBs) detection has been applied to many brain diseases but not well studied on stroke cohort. We developed and analyzed a deep learning-based CMB detection pipeline on quantitative susceptibility mapping (QSM) images from 138 stroke patients cohort.
Introduction
Cerebral microbleeds (CMBs) are associated with the risk of stroke and many other brain diseases. Due to hemosiderin containment, CMBs appear small and round hyperintensity points on susceptibility images 1. The location of CMBs may be related to different brain diseases. A recent study showed that CMBs' appearance in lobar areas may indicate hypertension; while CMB's existence on putaman and hippocampus potentially was associated with the amyloid 1. It might be necessary to report the detailed information of CMBs, including the location and number count.A two-stage detection was proposed and used by several studies, including 1) the first stage of candidate localization and 2) the second stage of false-positive reduction 2,3. Successful CMB detection has been demonstrated in disease diagnoses, such as hemodialysis, traumatic brain Injury(TBI), and gliomas. But the CMBs detection performance on large Stroke patients group remained less discussed 2,3. Here we focused on QSM CMB for stroke patients. The deep learning pipeline was developed andoptimized for achieving the state-of-the-art performance on CMBs detection.
Data and Methods
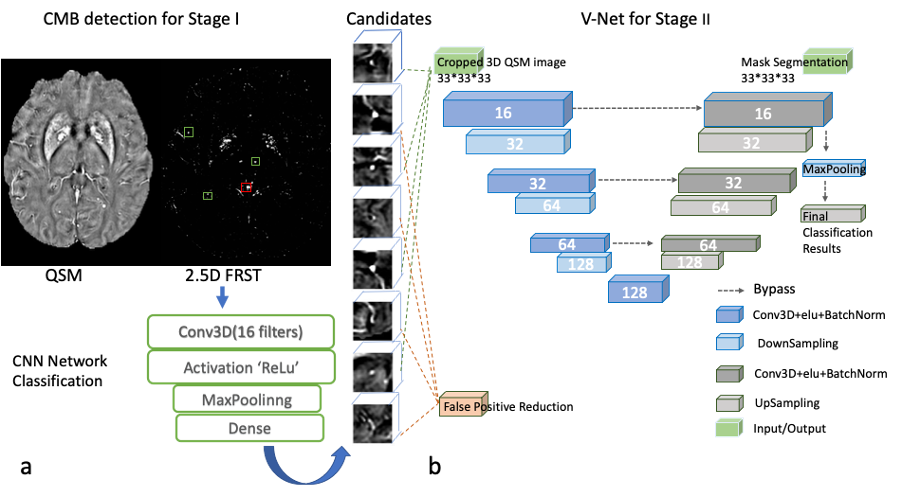
We included 138 stroke subjects from the HKU dataset, ranging from MRI exams between 2015-2019. The total number of manually labeled true CMB was 768, i.e., ~5.565 CMBs per subject. The raw QSM data was acquired using standard-of-care SWI sequence on 3T Philip MRI with parameters: TE=23ms, TR =29ms, resolution = 0.33*0.33*1mm3, matrix size = 704*704, and 135 slices. We reconstructed the QSM images using the STI studio software 4.In the CMB detection pipeline, we used the two-step approach, i.e., stage I for candidate detection and stage II for false-positive reduction. First, we applied a “2.5D” Fast Radial Symmetry Transformation (FRST) on each 32x32x32 patch of QSM images with three dimensions. The 2.5D FRST was based on 2D FRST that applied to x, y, and z directions three times, and then three 2D FRST maps were multiplied to form a 2.5D result. We built a CNN model that contained one conv layer and one fully connected layer for analyzing the 2.5D FRST. The CNN was designed to capture high-level features and distinguish the true CMBs and mimics. The most prevalent CMBs mimics were broken vessels and calcifications. Finally, on stage II, all the CMBs candidates, including true CMBs and mimics, were fed into V-Net to segment the CMBs' actual size 6. The performance of V-Net was also compared with that of ResNet [5] for false-positive reduction. The AUC (area under the curve) of ROC was utilized to assess the model performance.
The data were randomly divided into training, validation, and test sets with a ratio of 8:1:1. We performed data augmentation to increase the number of true positive CMBs.Because the V-Net output provided CMBs' size and location, we subsequently performed the Microbleeds Anatomical Rating Scaling (MARS) 7 We projected the brain atlas onto the subject space in FPM software. Then we used the CMB location information to calculate the MARS table for each stroke image.
Results and Discussion
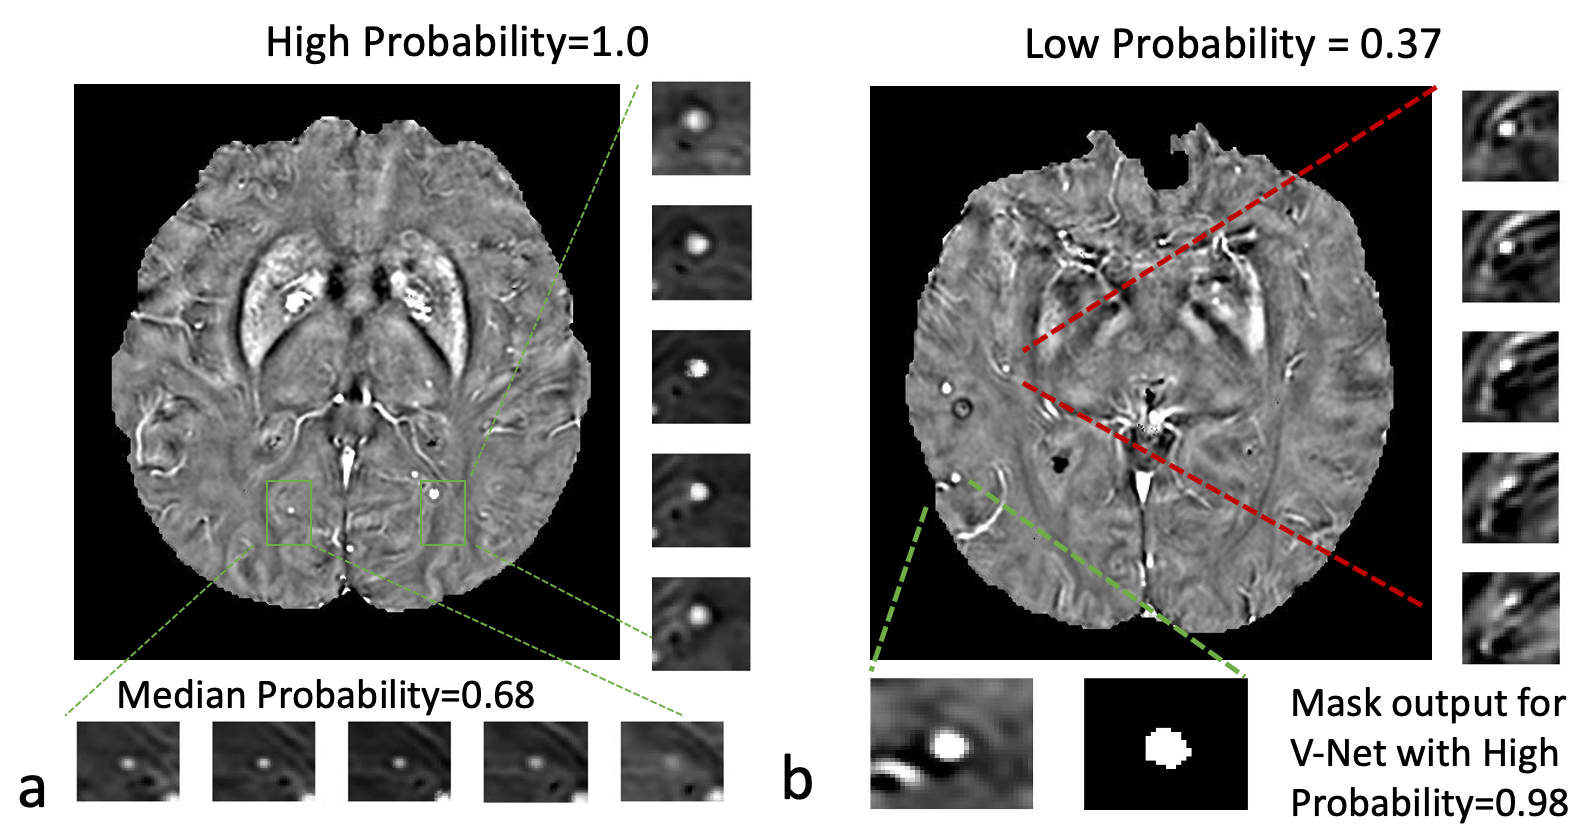
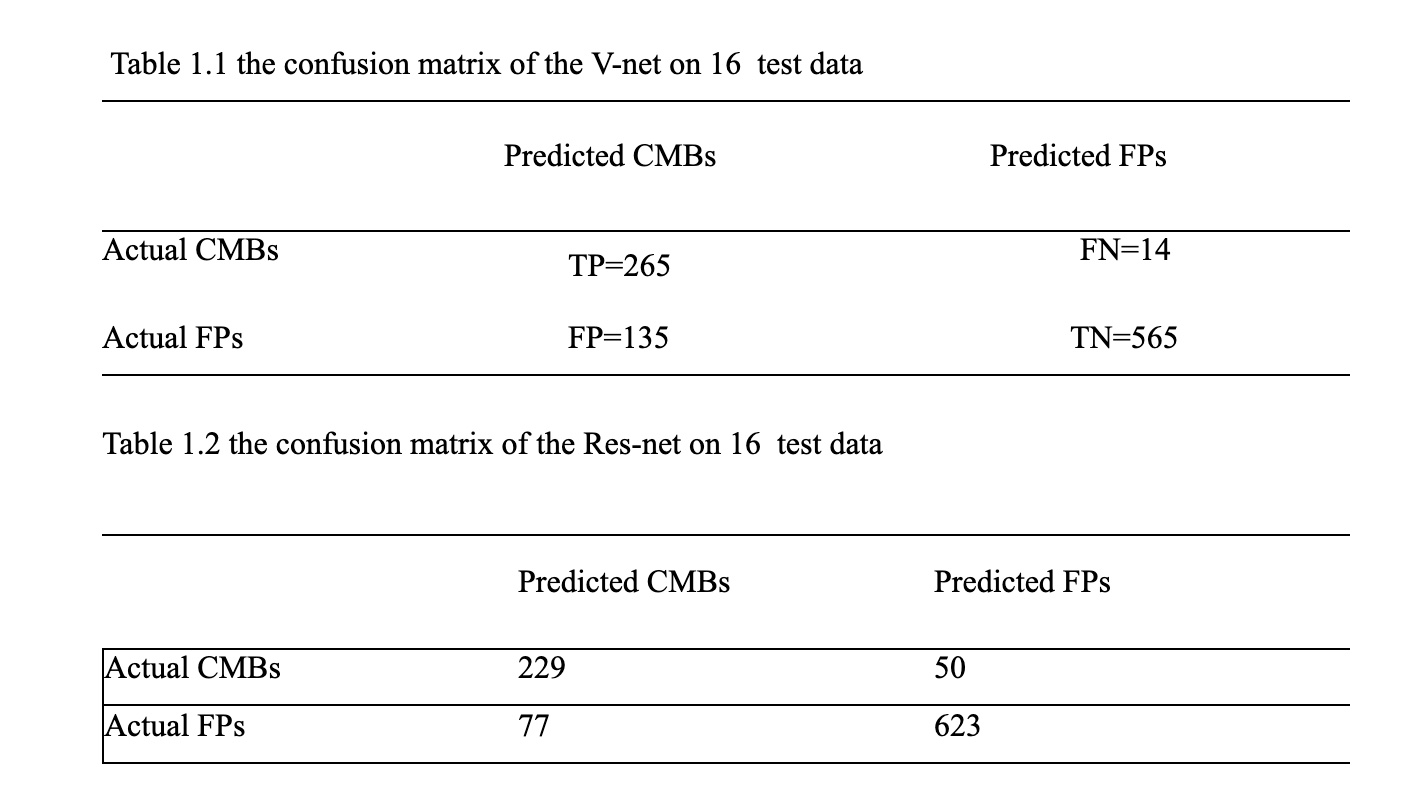
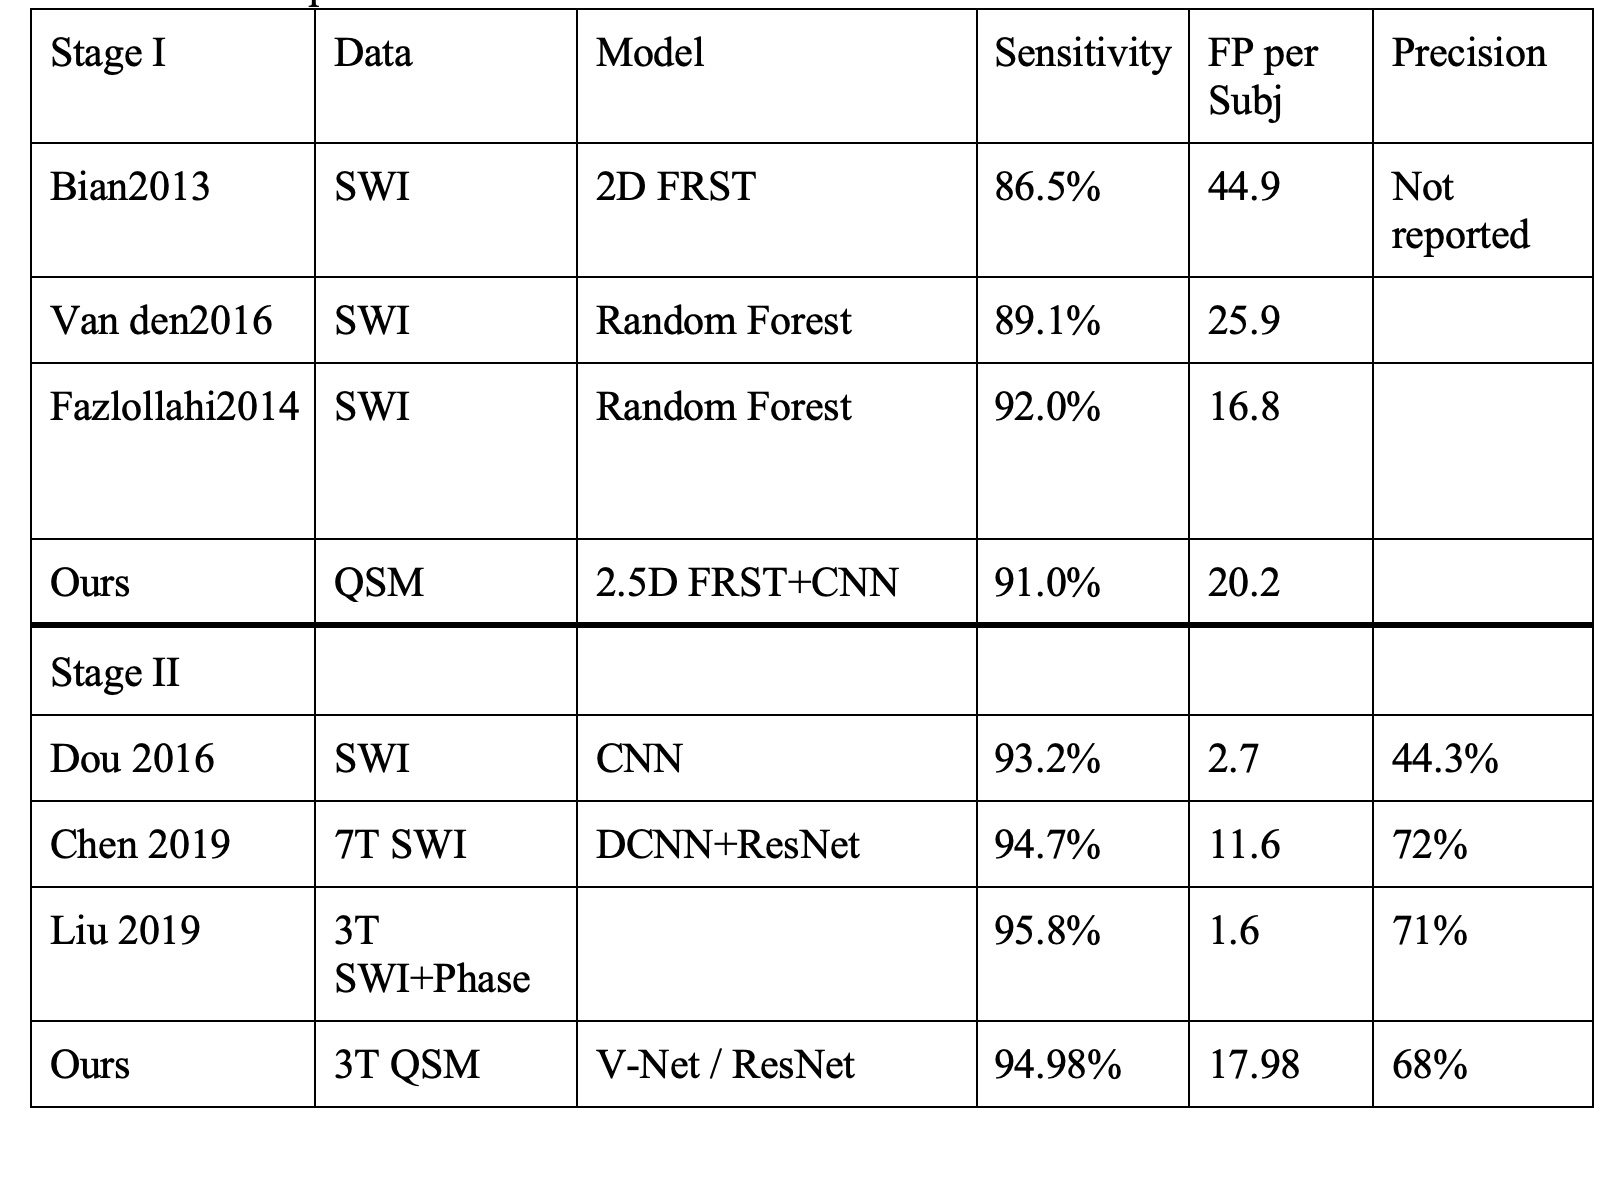
Table 1 shows the result of our two stages of detection pipeline and false- positive reduction. After the pipeline, 711 CMBs were detected out of the 3106 candidates. The detection sensitivity is 92.57%, with an average number of 5.15 detected CMBs and 17.35 FPavg (false positives per subject). For the second part: the false-positive reduction stage. The training model successfully reduced 80% false positive (565 out of 700) and missed 5% true CMBs (14 out of 279) on test data. The best model we have trained performance is 94.98% sensitivity and 80.71% specificity.The probability of segmentation predicted by the V-Net represented the likelihood of the output being a true CMBs. We set a threshold to be 0.5 to distinguish the true and false CMBs. In Figure2, the probability of 0.99 or nearly 1 indicated a true CMB, and the segmentation result is very close to the actual size of CMBs. The network also avoided the nearby vessel part. On the other hand, a probability of 0.37 showed a vessel-like mimic, which appeared to be round hyperintensity on QSM, very close to CMB shape.
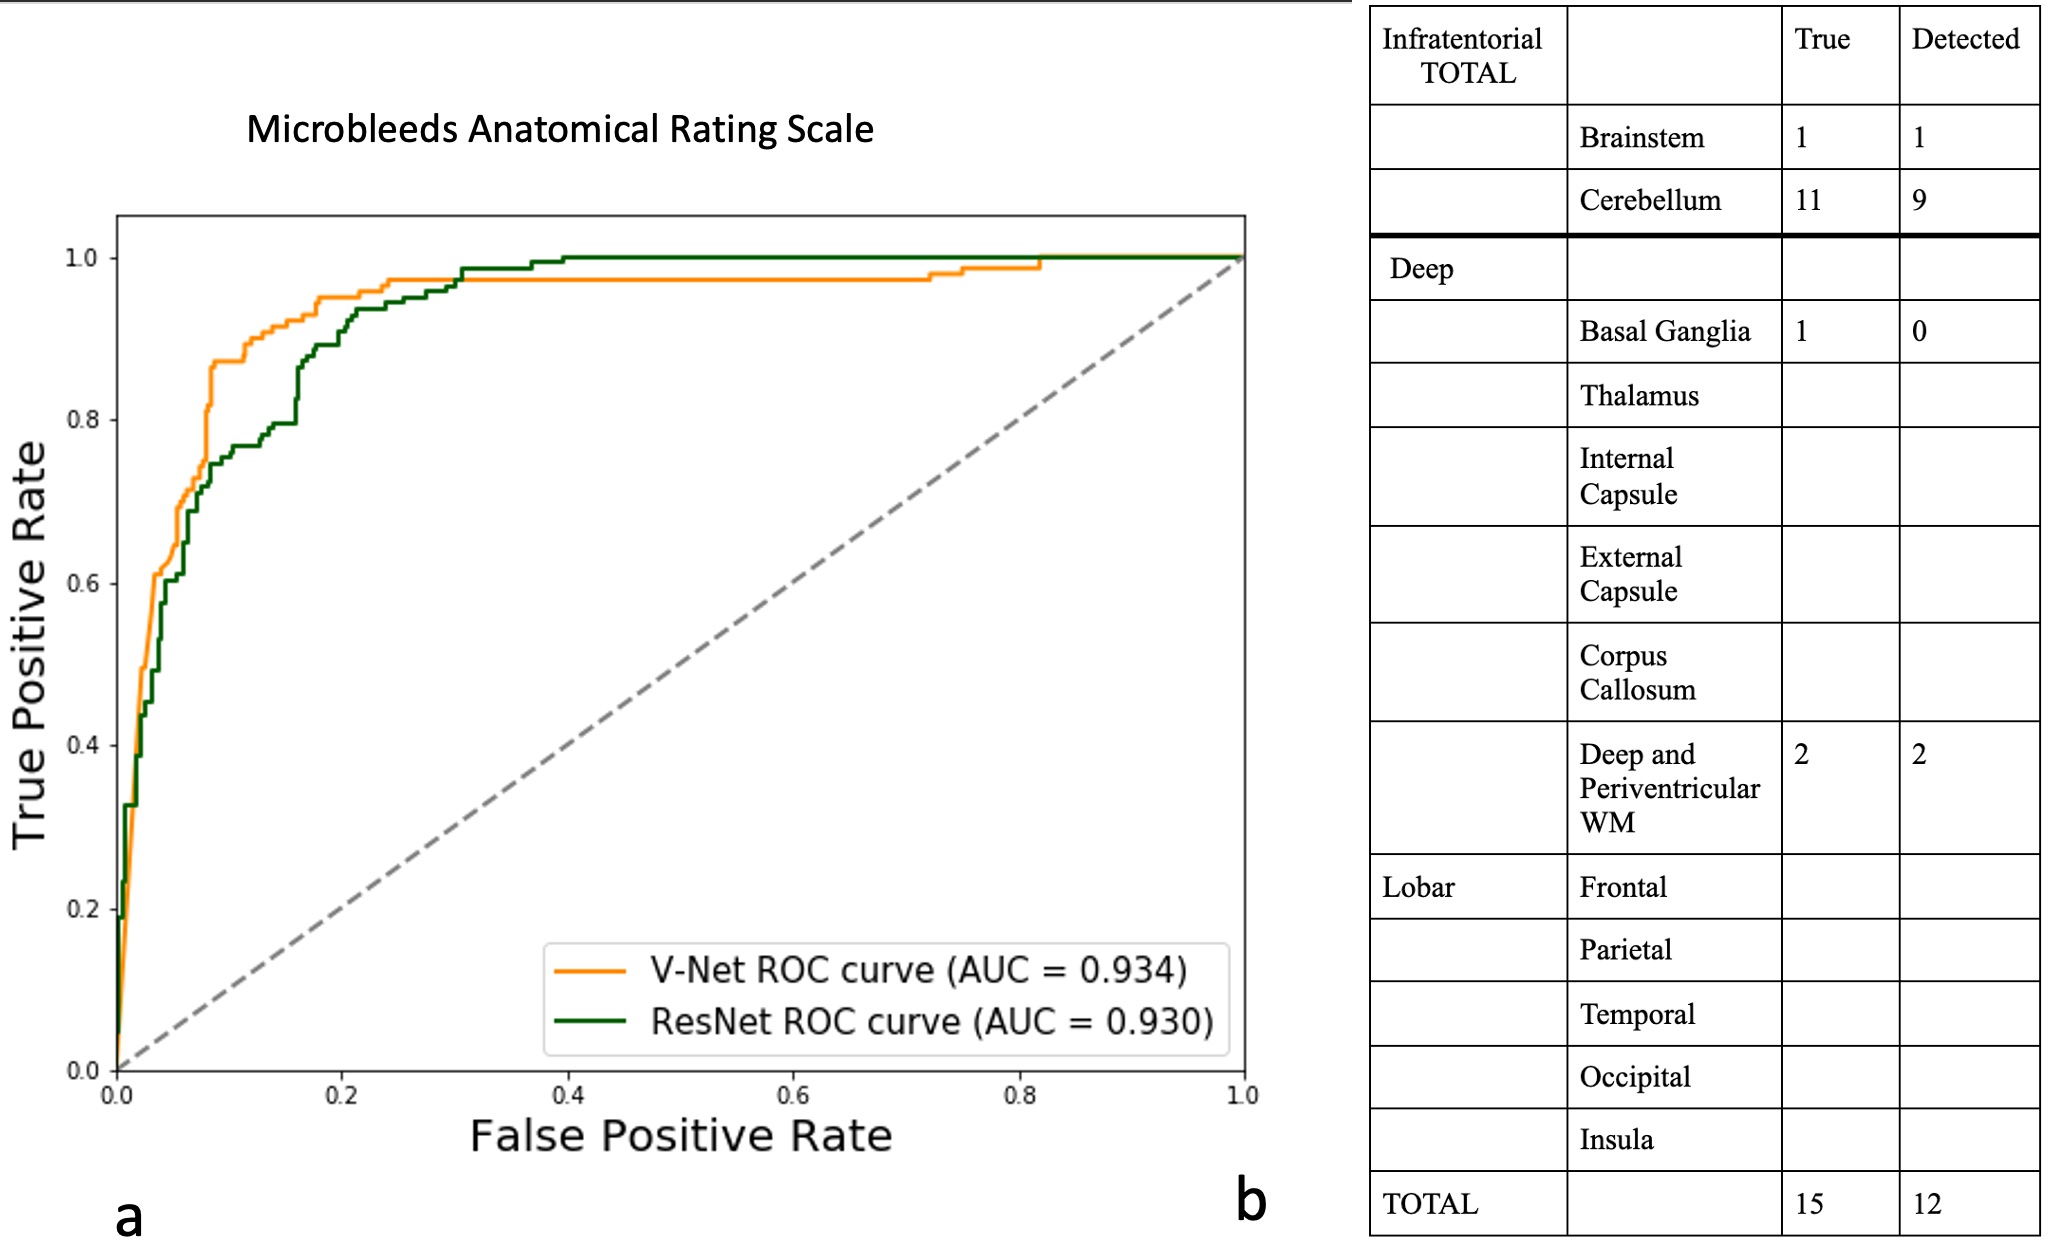
On stage II, we compared the results from ResNet and V-Net. The sensitivity of ResNet was 82%, and specificity was 89%. Precision was 229/(229+77)=74.8%. The AUC score of V-Net is 0.9343, and for ResNet it was 0.9303.
For our test data, taking one patient as an example, the detected CMBs distributed mainly distribute at the cerebellum region, account for 11/15, and 2/15 at deep white matter region, 1/15 at basal ganglia region, and 1/15 at the brainstem. The detected distribution of CMB (Detected column in Fig.2 right) using the deep learning method was close to the ground truth label (True column in Fig.2 right).
Conclusion
The combination of low-level features detected by FRST and high-level features obtained by CNN provided a more robust stage I of the CMB detection. Our method achieved sensitivity up to 94.98% on stage II. V-Net model also provided both the size and location of CMBs, which might be necessary for clinical evaluation of the disease and assist the diagnosis, i.e., in the MARS scoring system.Acknowledgements
No acknowledgement found.References
1.Greenberg, Steven M, Vernooij, Meike W, Cordonnier, Charlotte, Viswanathan, Anand, Al-Shahi Salman, Rustam, Warach, Steven, Launer, Lenore J, Van Buchem, Mark A, and Breteler, Monique MB. "Cerebral Microbleeds: A Guide to Detection and Interpretation." Lancet Neurology 8, no.
2 (2009): 165-74. 2.Liu, Saifeng, Utriainen, David, Chai, Chao, Chen, Yongsheng, Wang, Lin, Sethi, Sean K, Xia, Shuang, and Haacke, E. Mark. "Cerebral Microbleed Detection Using Susceptibility Weighted Imaging and Deep Learning." NeuroImage 198 (2019): 271-82.
3.Chen, Yicheng, Villanueva-Meyer, Javier E, Morrison, Melanie A, and Lupo, Janine M. "Toward Automatic Detection of Radiation-Induced Cerebral Microbleeds Using a 3D Deep Residual Network." Journal of Digital Imaging 32, no. 5 (2018): 766-72.
4.Liu, Chunlei, Wei, Hongjiang, Gong, Nan-Jie, Cronin, Matthew, Dibb, Russel, and Decker, Kyle. "Quantitative Susceptibility Mapping: Contrast Mechanisms and Clinical Applications." 2015.
5.Kaiming He et al. Deep Residual Learning for Image Recognition. , 2016.770–778.
6.Milletari, Fausto, Navab, Nassir, and Ahmadi, Seyed-Ahmad. "V-Net: Fully Convolutional Neural Networks for Volumetric Medical Image Segmentation." 2016, 565-71.
7.Gregoire, S. M, Chaudhary, U. J, Brown, M. M, Yousry, T. A, Kallis, C, Jager, H. R, and Werring, D. J. "The Microbleed Anatomical Rating Scale (MARS): Reliability of a Tool to Map Brain Microbleeds." Neurology 73, no. 21 (2009): 1759-766.
Figures