3490
Simulation of brain deficits on MRI: A novel approach of ‘ground truth’ generation for machine learning1UBC, Vancouver, BC, Canada, 2Surrey Memorial Hospital, Vancouver, BC, Canada, 3Safe Software, Vancouver, BC, Canada, 4National Research Council, Vancouver, BC, Canada, 5BC Cancer, Vancouver, BC, Canada, 6Baycrest Health Sciences Centre, Vancouver, BC, Canada, 7HealthTech Connex, Vancouver, BC, Canada
Synopsis
Robust machine learning algorithms for tumor identification require ground truth data sets. Ground truth data sets require expert input, are difficult and inefficient to produce. Feature Manipulation Engine (FME) allows for specific and complex data manipulation. We have created an FME workflow to produce simulated tumors that resemble realistic gliomas as rated by experts.
Introduction
One of the known challenges in deriving accurate machine-learning algorithms in MRI analysis is the limited number of labelled ground truth data sets with known information (Shen et al., 2017; Lundervold 2019). Such data sets are labour-intensive and time-consuming to create while being subjective error prone. For example, in the case of gliomas the actual tissue is required to confirm the tumour and edema volumes and shape (Yan et al., 2013).An alternative approach involves creating simulated changes on the brain MRI of healthy subjects (Rexilius et al., 2004; Prastawa et al., 2005; 2008). In addition to the fast and automated nature, the known label of the images is advantageous. For instance, Rexilius et al. (2004) created digital phantoms of brain tumours. Prastawa et al. (2005) proposed additional manipulations to generating simulated tumours using a biochemical model. These previous attempts all require sophisticated mathematical modelling. Besides, they are not readily accessible or applicable, limiting the further development of the research.
In the present study, we reported the development of an MRI simulation method for generating large set of dataset with labels for training machine learning models. We targeted the application with gliomas generation as that represent highly prevalent primary intracranial tumour with clear clinical significance (Ostrom et al., 2013), while their delineation on MRI for radiation planning in standard clinical care is a manual and time-consuming process.
Our specific objectives are to 1) create the brain tumour-simulation workflow using FME, 2) generate multiple simulated tumour appearances onto 3D MRI using the workflow, and 3) conducted an evaluation to examine the reliability and performance of the workflow in generating simulated tumours.
Methods and Results
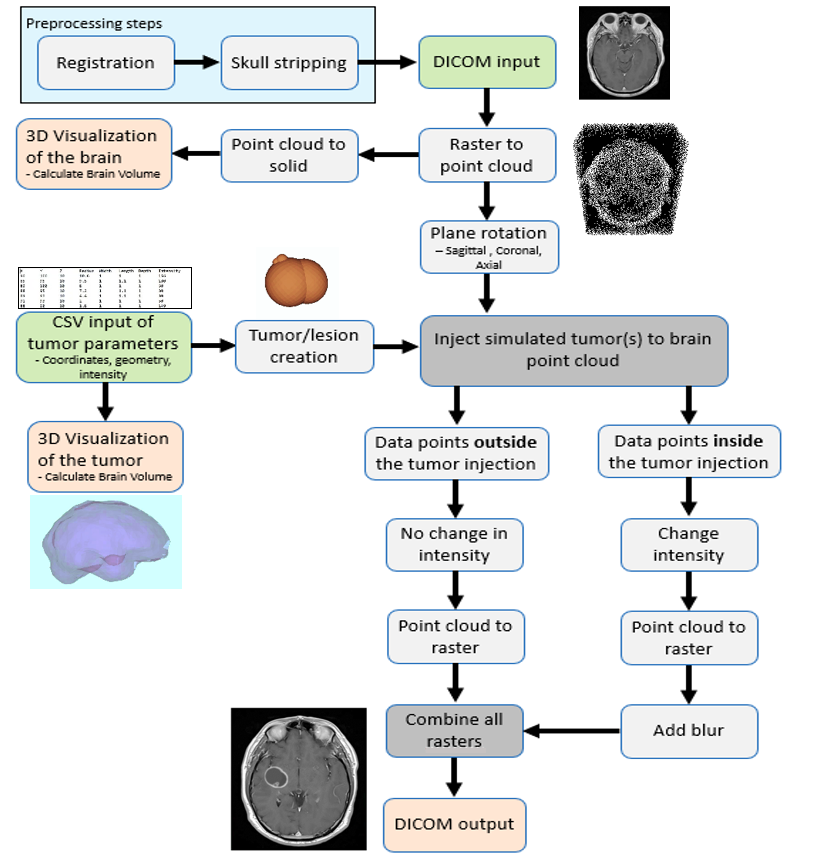
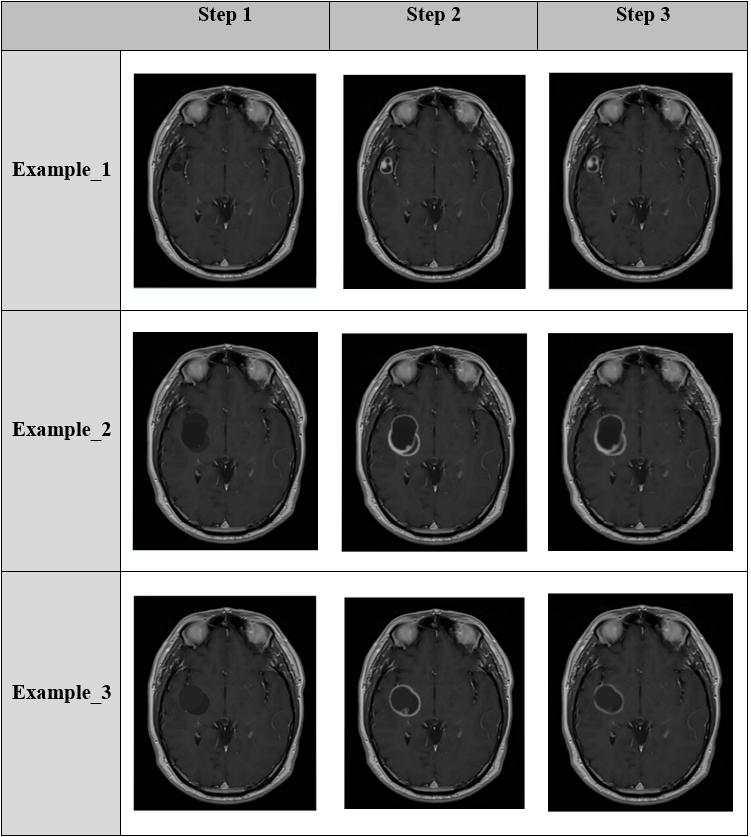
Simulated tumours were created onto gadolinium-based high-resolution 3D T1-weighted MRI (1mm3) of DICOM (Digital Imaging and Communication in Medicine) format. Figure 1 illustrates the step-by-step procedure of the tumour simulation workflow created using Feature Manipulation Engine (FME®; Safe Software Inc). The procedure started from user specification of the parameters about the location, signal intensity, shape, size of a simulated tumour in a text file to be inserted onto a base MRI dataset. The outcome of the workflow was a 3D MRI with the simulated tumour injected.It took several steps to complete tumour simulation as shown by the examples in Fig. 2. In Step 1, a simple dark sphere was blurred. This step led to odd-looking simulations. In Step 2, more spheres were used to enable a more complex combination of the shape and rim-like surrounding ring. In Step 3, additional effects were made to make the artificial object look like a real-world tumour. All the spheres, including the central dark and higher intensity rim ones, were grouped, and their combined volume calculated using polyhedron volume calculation.
Runtime and Memory Usage
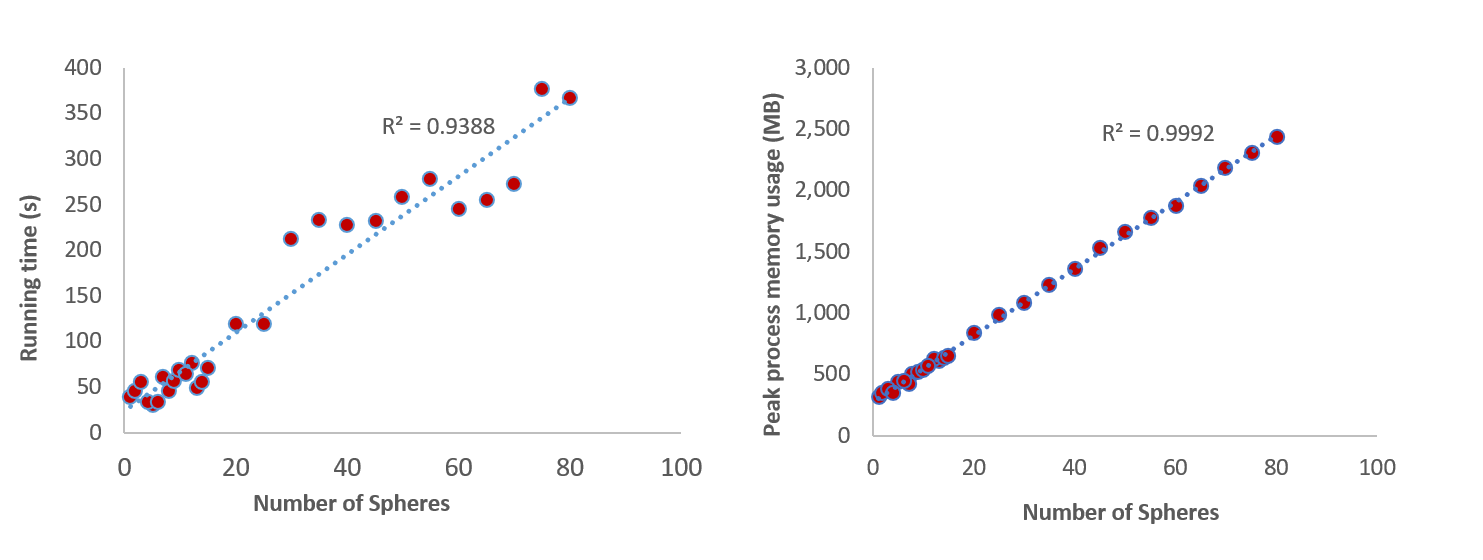
Pearson correlation was used to determine the relationship between runtime, memory and the number of spheres generating simulated tumours. The running time of the workflow increased with the increase of the number of spheres in a linear manner (Fig. 3). A linear relationship was also found in memory usage (Fig. 3).
Expert Evaluation
An online survey was used to evaluate the simulated tumour generated using the workflow with Real-world gadolinium-enhanced T1-weighted MRI data of patients with canonical gliomas. Experts (n=20) with experience in MRI of brain tumours, including oncologists and radiologists were invited to conduct the survey anonymously. Out of the 20 respondents who completed the first two survey questions, 17 of them also completed the last question.
The performance in distinguishing the images showing simulated or real tumours was assessed using sensitivity (i.e., true positive rate) and specificity (i.e., true negative rate) analysis. Differences in the mean rating scores between the real and simulated tumours and among expert types were examined using the non-parametric Kruskal-Wallis test. The level of statistical significance was p<0.05.
The respondents' accuracy rate ranged between 33.3 and 83.3% independent of years of experience (Fig. 4). The sensitivity and specificity were low for a human expert to differentiate simulated lesions from real gliomas (0.43 and 0.58) or vice versa (0.65 and 0.62). The mean scores ranking the real-world gliomas did not differ between the simulated and real tumours.
Discussion
Our innovative solution has several strengths. First, the tumour simulation tool is easy to use. Built based on the FME, a well-established data integration software platform, the software tool allows the user to create the tumour specification parameters and input them into the workflow to produce desired outcomes. Also, the tumour simulation workflow is very user friendly. The tunable parameters in the workflow can allow users the flexibility in generating an almost infinite number of possible sphere-type shapes, signal intensities, and locations. An additional worthy noting strength of our solution is the realistic appearance of the tumour simulation outcome.Presently, the simulation was developed with the gadolinium contrast-enhanced T1-weighted imaging only. Further research is needed to investigate whether the simulation of various brain deficits can be realized in other MRI such as T2, and T2-Flair.
Conclusion
In this study, we developed a reliable and user-friendly software with a practical workflow to allow simulation of brain deficits on MRI. The software tool is available for free at https://hub.safe.com/publishers/ksep/templates/tumor-simulation.Acknowledgements
Funding
This work was supported in part by the Porte Hungerford Neuro-Oncology Fund held by Dr. AV Krauze and the NeuroAward Grant (FHA-G2017-001) from Surrey Hospital Foundation held by Dr. X. Song.
Acknowledgments
The authors acknowledge Dmitri Bagh, Lena Bagh, and Sienna Emery at Safe Software for their generous support with formulating and optimizing the workflow, as well as with improving the FME functions to best meet the need of our study; the Society of Neuro-Oncology for help with dissemination of the study; the anonymous experts for participating in the survey; BC Cancer, Safe Software, and Fraser Health Department of Evaluation and Research Services and Surrey Memorial Hospital for administrative and management supports.
References
Shen D, Wu G, Suk H. Deep learning in medical image analysis. Annual Review of Biomedical Engineering 19. 2017. 221-248.
Lundervold AS, Lundervold A. An overview of deep learning in medical imaging focusing on MRI. Zeitschrift für Medizinische Physik. 2019. 29(2): 102-127.
Yan Y, Rosales R, Fung G, Subramanian R, Dy J. 2013. Learning from Multiple Annotators with varying expertise. Machine Learning. 95: 291-327. doi: 10.1007/s10994-013-5412-1.
Rexilius J, Hahn H, Schlüter M, Kohle S, Bourquain H, Böttcher J, Peitgen H. A Framework for the Generation of Realistic Brain Tumor Phantoms and Applications. Lecture Notes in Computer Science. 2004. 1: 243-250. doi: 10.1007/978-3-540-30136-3_31
Prastawa M, Bullitt E, Gerig G. Synthetic ground truth for validation of brain tumor MRI segmentation. Medical Image Computing and Computer-Assisted Intervention. 2005. 8(Pt 1): 26-33. doi: 10.1007/11566465_4
Prastawa M, Bullitt E, Gerig G. Simulation of Brain Tumors in MR Images for Evaluation of Segmentation Efficacy. Medical Image Analysis. 2008. 13(2): 297-311. doi: 10.1016/j.media.2008.11.002
Figures