3487
Deep Learning Identifies Neuroimaging Signatures of Alzheimer’s Disease Using Structural and Artificial Functional MRI Data1Biological Science, Columbia University, New York, NY, United States, 2Taub Institute for Research on Alzheimer's Disease and the Aging Brain, Columbia University, New York, NY, United States, 3Mortimer B. Zuckerman Mind Brain Behavior Institute, Columbia University, New York, NY, United States, 4Electrical Engineering, Columbia University, New York, NY, United States, 5Biomedical Engineering, Columbia University, New York, NY, United States, 6Radiology, Columbia University, New York, NY, United States, 7Gertrude H. Sergievsky Center, Columbia University, New York, NY, United States, 8Psychiatry, Columbia University, New York, NY, United States
Synopsis
Alzheimer’s disease (AD) is a neurodegenerative disorder where functional deficits precede structural deformations. Various studies have demonstrated the efficacy of deep learning in diagnosing AD using imaging data, and that functional modalities are more helpful than structural counterparts over comparable sample size. To deal with the lack of large-scale functional data in the real world, we used a structure-to-function translation network to artificially generate a previously non-existent spatially-matched functional neuroimaging dataset from existing large-scale structural data. The artificial functional data, generated with little cost, complemented the authentic structural data to further improve the performance of AD classification.
Introduction
Current neuroimaging techniques provide paths to investigate the structure and function of the brain in vivo and have made great advances in understanding Alzheimer’s disease (AD). Besides the traditional large-scale statistical analyses to discover group-level differences, recent advancements in deep learning push the limits to individual-level disease diagnosis. Great progress has been made for classifying AD with deep learning models developed upon increasingly available structural MRI data1,2. The lack of scale-matched functional neuroimaging data prevents such models from being further improved by observing functional changes in pathophysiology. Here we propose a potential solution by synthesizing spatially matched functional images from large-scale structural scans. We evaluate our approach by building convolutional neural networks to discriminate patients with AD from healthy normal subjects based on both structural and functional neuroimaging data.Methods
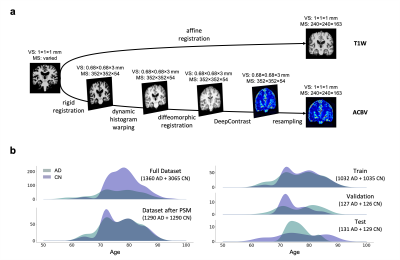
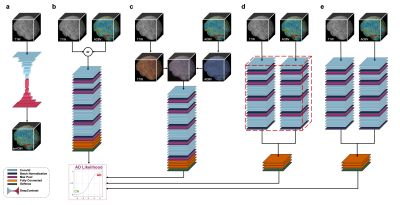
We utilized a pre-trained network called DeepContrast3 that performs quantitative structural- to-functional mapping, extracting the hemodynamic information from structural MRI. We applied DeepContrast on a 2580-scan T1W MRI cohort and yielded 2580 artificial CBV (ACBV) scans, each corresponding to one T1W MRI scan. Then, we trained multiple networks based on VGG19 to perform the AD vs. CN binary classification task. We altered the network input with different options, including T1W MRI, ACBV, or the combination of the two. We screened T1W MRI scans from the Alzheimer’s Disease Neuroimaging Initiative (ADNI)4 dataset, selected for 3 Tesla MP-RAGE acquisitions, and performed propensity score matching (PSM)5 to match the age distributions. The T1W MRI scans were affine-registered to an unbiased template to reduce variance in features such as the brain volume while still preserving differences in local anatomy which may presumably reflect AD-related effects on brain structures. The artificial CBV scans were diffeomorphically-registered to minimize effects from structural differences. The prepared scans were randomly assigned to train, validation, and test sets at an 8:1:1 ratio.For the AD classification tasks with one single input modality, the architecture “VGG-19 with batch normalization” (VGG-19BN)6 was used. When both T1W and ACBV were used as inputs, three options were experimented with for information fusion. One is appending the two 3D volumes in an additional fourth axis, treating them as separate channels. In the last two options, we used separate VGG encoders for each volume and later appended the extracted feature vectors together before entering the fully-connected layers. The two encoders may either share identical weights or keep different weights. For all architectures, the input is the relevant 3D scan(s) while the output is a continuous-valued number representing the predicted AD-likelihood.
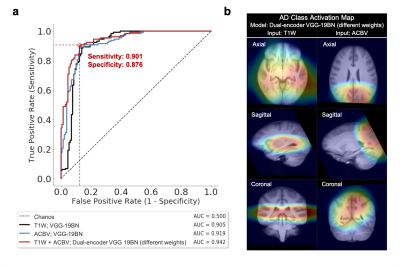
To evaluate the descriptiveness of the predicted AD-likelihoods, we conducted receiver-operating characteristics (ROC) studies to analyze the concordance between the model-generated classification and ground truth AD/CN labels. Further, we investigated the brain regions that had the most contributions to the AD classification task by visualizing the class activation maps (CAM)7.
Results
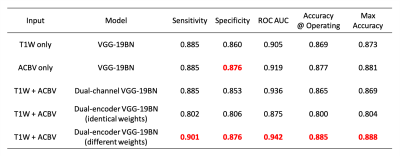
After training the networks, we tested the five aforementioned candidates on the same stand-alone dataset. Classification performance using the artificial functional data (ACBV) alone is equal or better in every aspect than that using the structural data (T1W) alone. Utilization of both modalities using channel combination yielded better ROC but worse accuracy compared to using any one single modality. The dual-encoder approach for modality fusion, with the encoders sharing identical weights yielded the worst performance among all candidates, whereas the same approach with the weights not shared between the encoders resulted in the best performances across all metrics. When inspecting the ROC curves, the same trend is preserved. The class activation map of the best-performing classifier demonstrates that the most highly contributing structural information comes from the temporal lobe, while the most highly informative artificial functional information comes from the parieto-occipital lobe.Discussion & Conclusion
By using the DeepContrast model, we demonstrated that a large- scale functional dataset can be artificially generated and subsequently used to assist AD classification. The best performing model structure was the dual-modality model making use of both structural T1W scans and artificial functional scans using two separate encoders. Training each encoder to focus on one of the two modalities independently allowed the most efficient grasp of the data distribution and eventually yielded the best classification performances. While we have demonstrated the effectiveness of combining structural and artificial functional data for AD classification, what is more significant is DeepContrast’s ability to essentially fill the void for functional data, which is usually sparse and less abundant in nature. Further, our regional analyses identified the temporal lobe to be the most predictive structural-region and the parieto-occipital lobe to be the most predictive functional-region for our model, which are both in concordance with previous group-level neuroimaging findings. Together, we demonstrate the potential of deep learning with large- scale structural and artificial functional MRI to impact AD classification and to identify AD’s neuroimaging signatures.Acknowledgements
This study was funded by the Seed Grant Program and Technical Development Grant Program at the Columbia MR Research Center. This study was performed at the Zuckerman Mind Brain Behavior Institute MRI Platform, a shared resource. Data collection and sharing for this project was partially funded by the Alzheimer’s Disease Neuroimaging Initiative (ADNI).References
- K. Aderghal, J. Benois-Pineau, K. Afdel, and C. Gwenaëlle,“Fuseme: Classification of smri images by fusion of deepcnns in 2d+εprojections,” inProceedings of the 15thInternational Workshop on Content-Based MultimediaIndexing, 2017, pp. 1–7.
- X. Feng, J. Yang, Z. C. Lipton, S. A. Small, F. A. Provenzano, A. D. N. Initiative,et al., “Deep learning on mriaffirms the prominence of the hippocampal formation in alzheimer’s disease classification,”bioRxiv, p. 456 277,2018.
- C. Liu, N. Zhu, D. Sikka, X. Feng, et al., “Deep learning substitutes gadolinium in detecting functional and structural brain lesions with mri,” PREPRINT (Version 1) available at Research Square, 2020. DOI:10.21203/rs.3.rs-56518/v1.
- S. G. Mueller, M. W. Weiner, L. J. Thal, R. C. Petersen, C. Jack, W. Jagust, J. Q. Trojanowski, A. W. Toga, andL. Beckett, “The Alzheimer's disease neuroimaging initiative,” Neuroimaging Clinics, vol. 15, no. 4, pp. 869–877, 2005.
- R. H. Dehejia and S. Wahba, “Propensity score-matching methods for nonexperimental causal studies,” Review of Economics and Statistics, vol. 84, no. 1, pp. 151–161, 2002.
- M. Simon, E. Rodner, and J. Denzler, “Imagenet pre-trained models with batch normalization,” arXiv preprint, arXiv:1612.01452, 2016.
- B. Zhou, A. Khosla, A. Lapedriza, A. Oliva, and A. Torralba, “Learning deep features for discriminative localization,” in Proceedings of the IEEE conference on computer vision and pattern recognition, 2016, pp. 2921–2929.
Figures


