3484
Image-to-image translation of 3T to 7T MRI using Generative Adversarial Networks: A step towards longitudinal harmonization1Electrical and Computer Engineering, University of Pittsburgh, Pittsburgh, PA, United States, 2Bioengineering, University of Pittsburgh, Pittsburgh, PA, United States
Synopsis
We implemented a generative adversarial network (CycleGAN) to tackle the problem of MRI data harmonization across scanner strength. We leveraged a large dataset of unpaired 3T and 7T MR images for training and evaluated our model in a dataset of paired 3T and 7T data by generating synthetic 7T images and comparing them with their real counterparts. Dice scores and volumetric measures showed strong agreement between the synthetic and real 7T images. This approach allows for research studies to transition from 3T to 7T MR systems, thereby harnessing 7T systems advantages without losing the prior wave’s 3T MR data.
Introduction
There has been rapid progress in MR imaging, including higher contrast and resolution. Ongoing longitudinal studies can take advantage of improved technology by switching to the latest systems. However, this presents a challenge in the statistical analysis due to the systematic change in image quality over time. The advances in deep learning methods allow for the development of approaches to harmonize data across different imaging platforms, field strengths, and sites. Notably, generative adversarial networks (GANs) are showing impressive results in a broad range of applications. In MR Imaging, these include data augmentation1, inter-modality translation2, image denoising3, and motion-artifact correction4. We evaluate the use of CycleGAN5 for longitudinal harmonization of low field (3T) T1-weighted MR image slices to high field (7T-like) slices.Methods
Model. In CycleGANs, in addition to adversarial training, the generators of two GANs $$$f: X \rightarrow Y$$$ and $$$g: Y \rightarrow X$$$ are composed and trained to attain cycle consistency, i.e., $$$f = g^{-1}$$$. This setup enables training with unpaired 3T and 7T data. CycleGAN also introduces identity losses, which enforce the generators to learn separable mappings between the two domains. Similar to the original model5, our generators are U-Nets with residual blocks between encoding and decoding blocks. We use instance normalization instead of batch normalization and stride-2 convolution instead of max pooling. Discriminator networks are 70x70 PatchGAN.Data. Structural 3T images from 1112 subjects from the Human Connectome Project (HCP)6 and 490 7T images collected at the RF Research Facility at the University of Pittsburgh were used for training/validation (80/20% split). We also collected a separate dataset of 30 paired 3T and 7T images for testing. All 7T data were acquired using a Siemens Magnetom 7T whole-body MR scanner, with 0.75mm isotropic resolution, TR/TE = 3000/2.17ms, and an in-house developed RF 7T Tic-Tac-Toe head coil system7. All images were bias-field corrected, linearly aligned to MNI152, skull-stripped, and intensity normalized. Finally, we extracted axial slices from the 3D volume to create the datasets.
Implementation. The model was implemented with Tensorflow and optimized with Adam. The training was performed on an NVIDIA TitanX GPU with 432 seconds/epoch. The training stopped after 20,000 iterations or when no significant improvement in the validation dataset occurred after 5 epochs. The network was trained from scratch, with a batch size of 32 and a learning rate of 0.0001 for the first 100 epochs which linearly decayed to zero afterward. In each training loop, the discriminators were iterated four times, while the generators only once to slow the rate at which generators learn with respect to the discriminators.
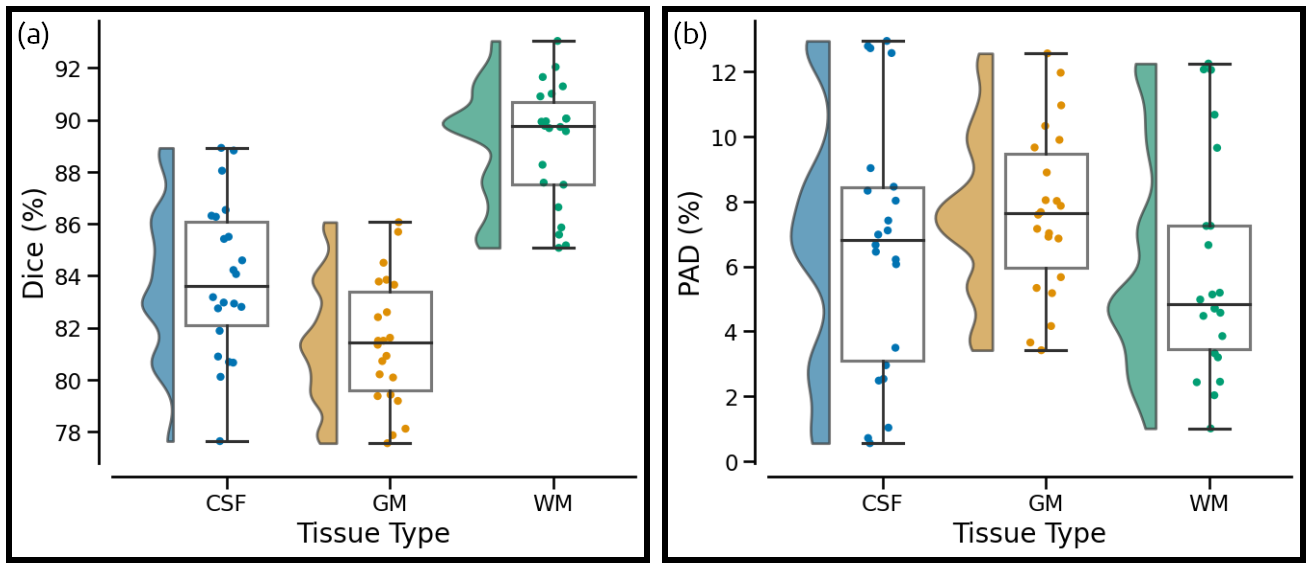
Primary Outcomes. The test dataset was evaluated using Dice score and percentage Area Difference (PAD) amongst cerebrospinal fluid (CSF), gray matter (GM), and white matter (WM) segmentation maps of real and generated 7T images. Segmentation was performed using FSL-FAST8. The following equations were used to compute Dice and PAD:
$$Dice = 100 \times 2 \cdot \dfrac{A(R \cap S)}{A(R) + A(S)}$$
$$PAD = 100 \times 2 \cdot \dfrac{|A(R) - A(S)|}{A(R) + A(S)}$$,
where $$$A$$$ is the area function, and $$$R$$$ and $$$S$$$ are the segmentations of the real and synthetic images, respectively. A Dice of 100 implies a perfect match between the two segmentations. Conversely, a PAD of 0 indicates that both segmentations have an equal area.
Results
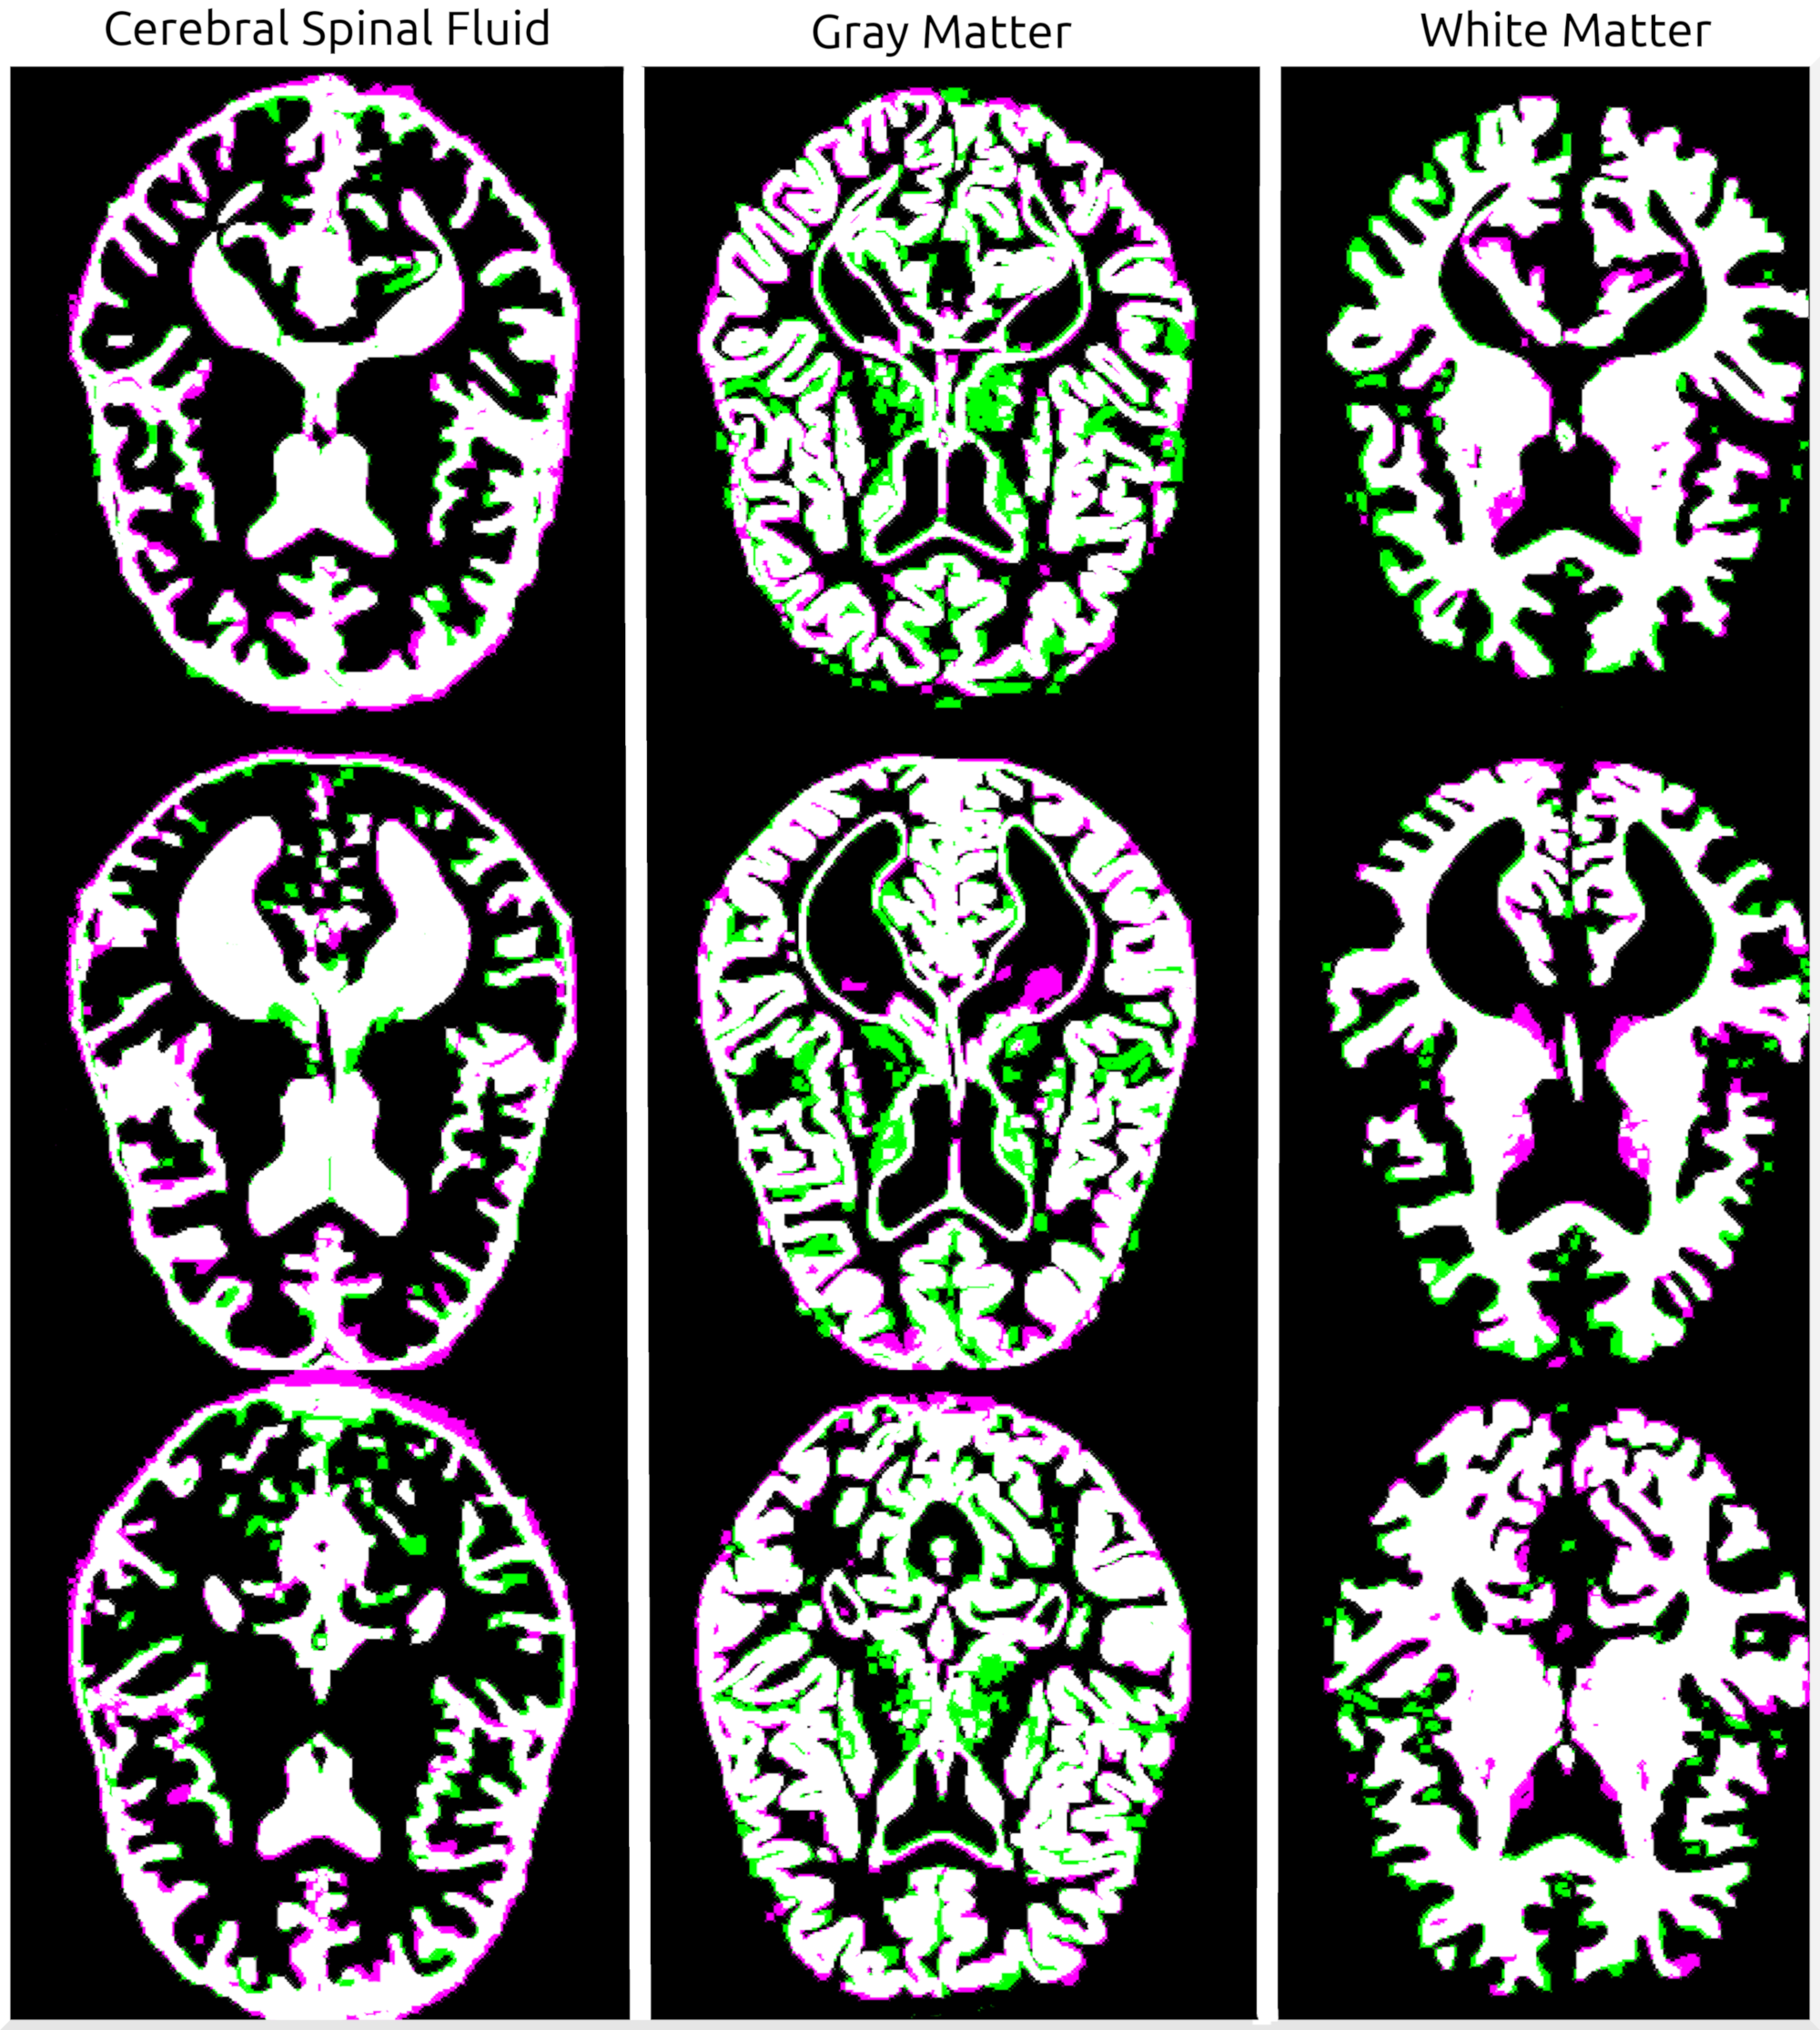
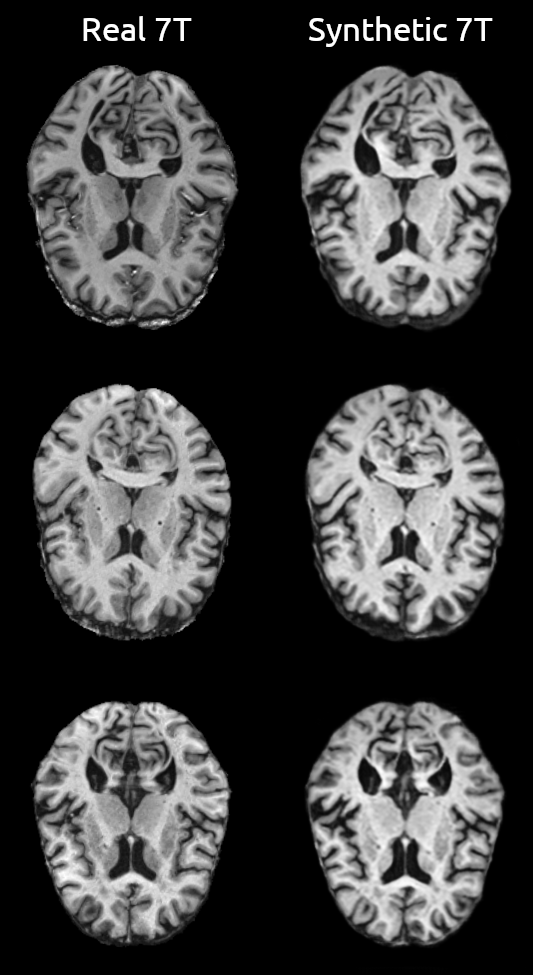
Figure 1 shows examples of real/synthetic 7T image pairs. Upon quick visual examination, the synthetic images appear to attain plausible resolution and contrast properties. Figure 2a shows box plots for segmentation results measured by Dice Score. CSF, GM, and WM all had a reasonable performance with mean Dice scores of 84%, 81%, and 88%. Figure 2b shows the corresponding PAD results. Figure 3 shows the segmentation for the images in Figure 1. In accordance with the summary statistics, the tissue overlaps look reasonably good.Discussion
Recent research has demonstrated the possibility to synthesize 7T images using state-of-the-art deep learning methods.9-11 However, unlike the prior art, our model is fully unsupervised and does not resort to wavelet domain information. Still, our results demonstrate a substantial decrease in the variance between images and make the harmonization problem more tractable. A shortcoming of our model is its 2D nature, which leads to slice-to-slice inconsistencies. A fully 3D model would alleviate this, but GPU memory constraints are a challenge. Another limitation is the many-to-one 3T-to-7T mapping, which leads to non-functional relationships within the CycleGANs. These transformations can introduce unrealistic information, which makes synthetic images unfit for diagnostic purposes. However, there are specific post-processing tasks that don't demand detailed image content but instead, global contrast properties are desired. For example, having a 3T-to-7T map would permit research studies to transition from 3T to 7T MR systems for the gain in image quality and still allow the prior collected 3T data to be used in the assessment of global image features, such as volumetric analysis.Conclusion
In summary, this technology allows for the smooth transition to state-of-the-art imaging especially in longitudinal studies where missing data can result in biased estimates and a loss of power. We believe this framework will be valuable to researchers performing imaging data collection and analysis who are interested in MRI data harmonization.Acknowledgements
This work was supported by the National Institutes of Health under award numbers: R01MH111265, R01AG063525, R01MH076079, RF1AG025516. This research was also supported in part by the University of Pittsburgh Center for Research Computing through the resources provided. 3T data were provided in part by the Human Connectome Project, WU-Minn Consortium (Principal Investigators: David Van Essen and Kamil Ugurbil; 1U54MH091657) funded by NIH and Washington University. Eduardo Diniz has been supported by Ph.D. Scholarship Ciência sem Fronteiras, Brazil (#210150/2014-9).References
1. Sandfort, Veit et al. (2019). “Data augmentation using generative adversarial networks (CycleGAN) to improve generalizability in CT segmentation tasks”. In: Scientific reports 9.1, pages 1–9.
2. Nie, Dong et al. (2018). “Medical image synthesis with deep convolutional adversarial networks”. In: IEEE Transactions on Biomedical Engineering 65.12, pages 2720–2730.
3. Wang, Jianing et al. (2018). “Conditional generative adversarial networks for metal artifact reduction in ct images of the ear”. In: International Conference on Medical Image Computing and Computer-Assisted Intervention. Springer, pages 3–11.
4. Armanious, Karim et al. (2020). “MedGAN: Medical image translation using GANs”. In: Computerized Medical Imaging and Graphics 79, page 101684.
5. Zhu, Jun-Yan et al. (2017). “Unpaired image-to-image translation using cycle-consistent adversarial networks”. In: Proceedings of the IEEE international conference on computer vision, pages 2223–2232.
6. Glasser, M. F., Sotiropoulos, S. N., Wilson, J. A., Coalson, T. S., Fischl, B., Andersson, J. L., ... & Van Essen, D. C. (2013). The minimal preprocessing pipelines for the Human Connectome Project. Neuroimage, 80, 105-124.
7. Kim, Junghwan et al. (2016). “Experimental and numerical analysis of B1+ field and SAR with a new transmit array design for 7 T breast MRI”. In: Journal of Magnetic Resonance 269, pages 55–64.
8. Smith, S. M., Jenkinson, M., Woolrich, M. W., Beckmann, C. F., Behrens, T. E., Johansen-Berg, H., ... & Niazy, R. K. (2004). Advances in functional and structural MR image analysis and implementation as FSL. Neuroimage, 23, S208-S219.
9. Qu, L., Zhang, Y., Wang, S., Yap, P. T., & Shen, D. (2020). Synthesized 7T MRI from 3T MRI via deep learning in spatial and wavelet domains. Medical Image Analysis, 62, 101663.
10. Sharma, A., Kaur, P., Nigam, A., & Bhavsar, A. (2018). Learning to decode 7t-like mr image reconstruction from 3t mr images. In Deep Learning in Medical Image Analysis and Multimodal Learning for Clinical Decision Support (pp. 245-253). Springer, Cham.
11. Qu, L., Wang, S., Yap, P. T., & Shen, D. (2019, October). Wavelet-based Semi-supervised Adversarial Learning for Synthesizing Realistic 7T from 3T MRI. In International Conference on Medical Image Computing and Computer-Assisted Intervention (pp. 786-794). Springer, Cham.
Figures