3474
Morphological Assessment of the Instrumented Spinal Cord using Isotropic 3D-MSI MRI1Radiology, Medical College of Wisconsin, Milwaukee, WI, United States
Synopsis
Morphological analysis of the spinal cord can provide valuable insight into injury and degeneration of damaged cord tissues. Accurate morphological analysis requires high resolution 3D anatomic imaging to be utilized as inputs into automated or semi-automated post-processing analysis algorithms. Historically, high resolution 3D imaging of the instrumented spinal cord has been difficult to achieve. As a result, the substantial damage and pathology near hardware cannot be analyzed using advanced morphological tools. In this technical feasibility study, isotropic 3D-MSI metal-artifact suppressed images are collected and utilized within a novel analysis framework constructed around the Spinal Cord Toolbox infrastructure.
Introduction
Quantitative imaging of the spinal cord has seen substantial research growth over the past several years. Exciting quantitative MRI biomarkers including, diffusion, magnetization transfer, chemical exchange transfer, and perfusion have shown exciting capabilities for spinal cord analysis. However, arguably more mundane parameters associated with cord morphology are often neglected. As quantitative MR of the spinal cord continues to grow, the use of cord morphology metrics, such as cord cross sectional area, aspect ratio, and impingement will, at a minimum, offer important covariate roles in qMRI analysis of the spinal cord.Cooperative development of advanced software packages, such as the Spinal Cord Toolbox (SCT)1, continues to enable more consistent and robust cord morphology analysis within the spinal cord imaging research community. Unfortunately, a common confound with human studies of the diseased or injured spinal cord is the presence of fusion hardware.
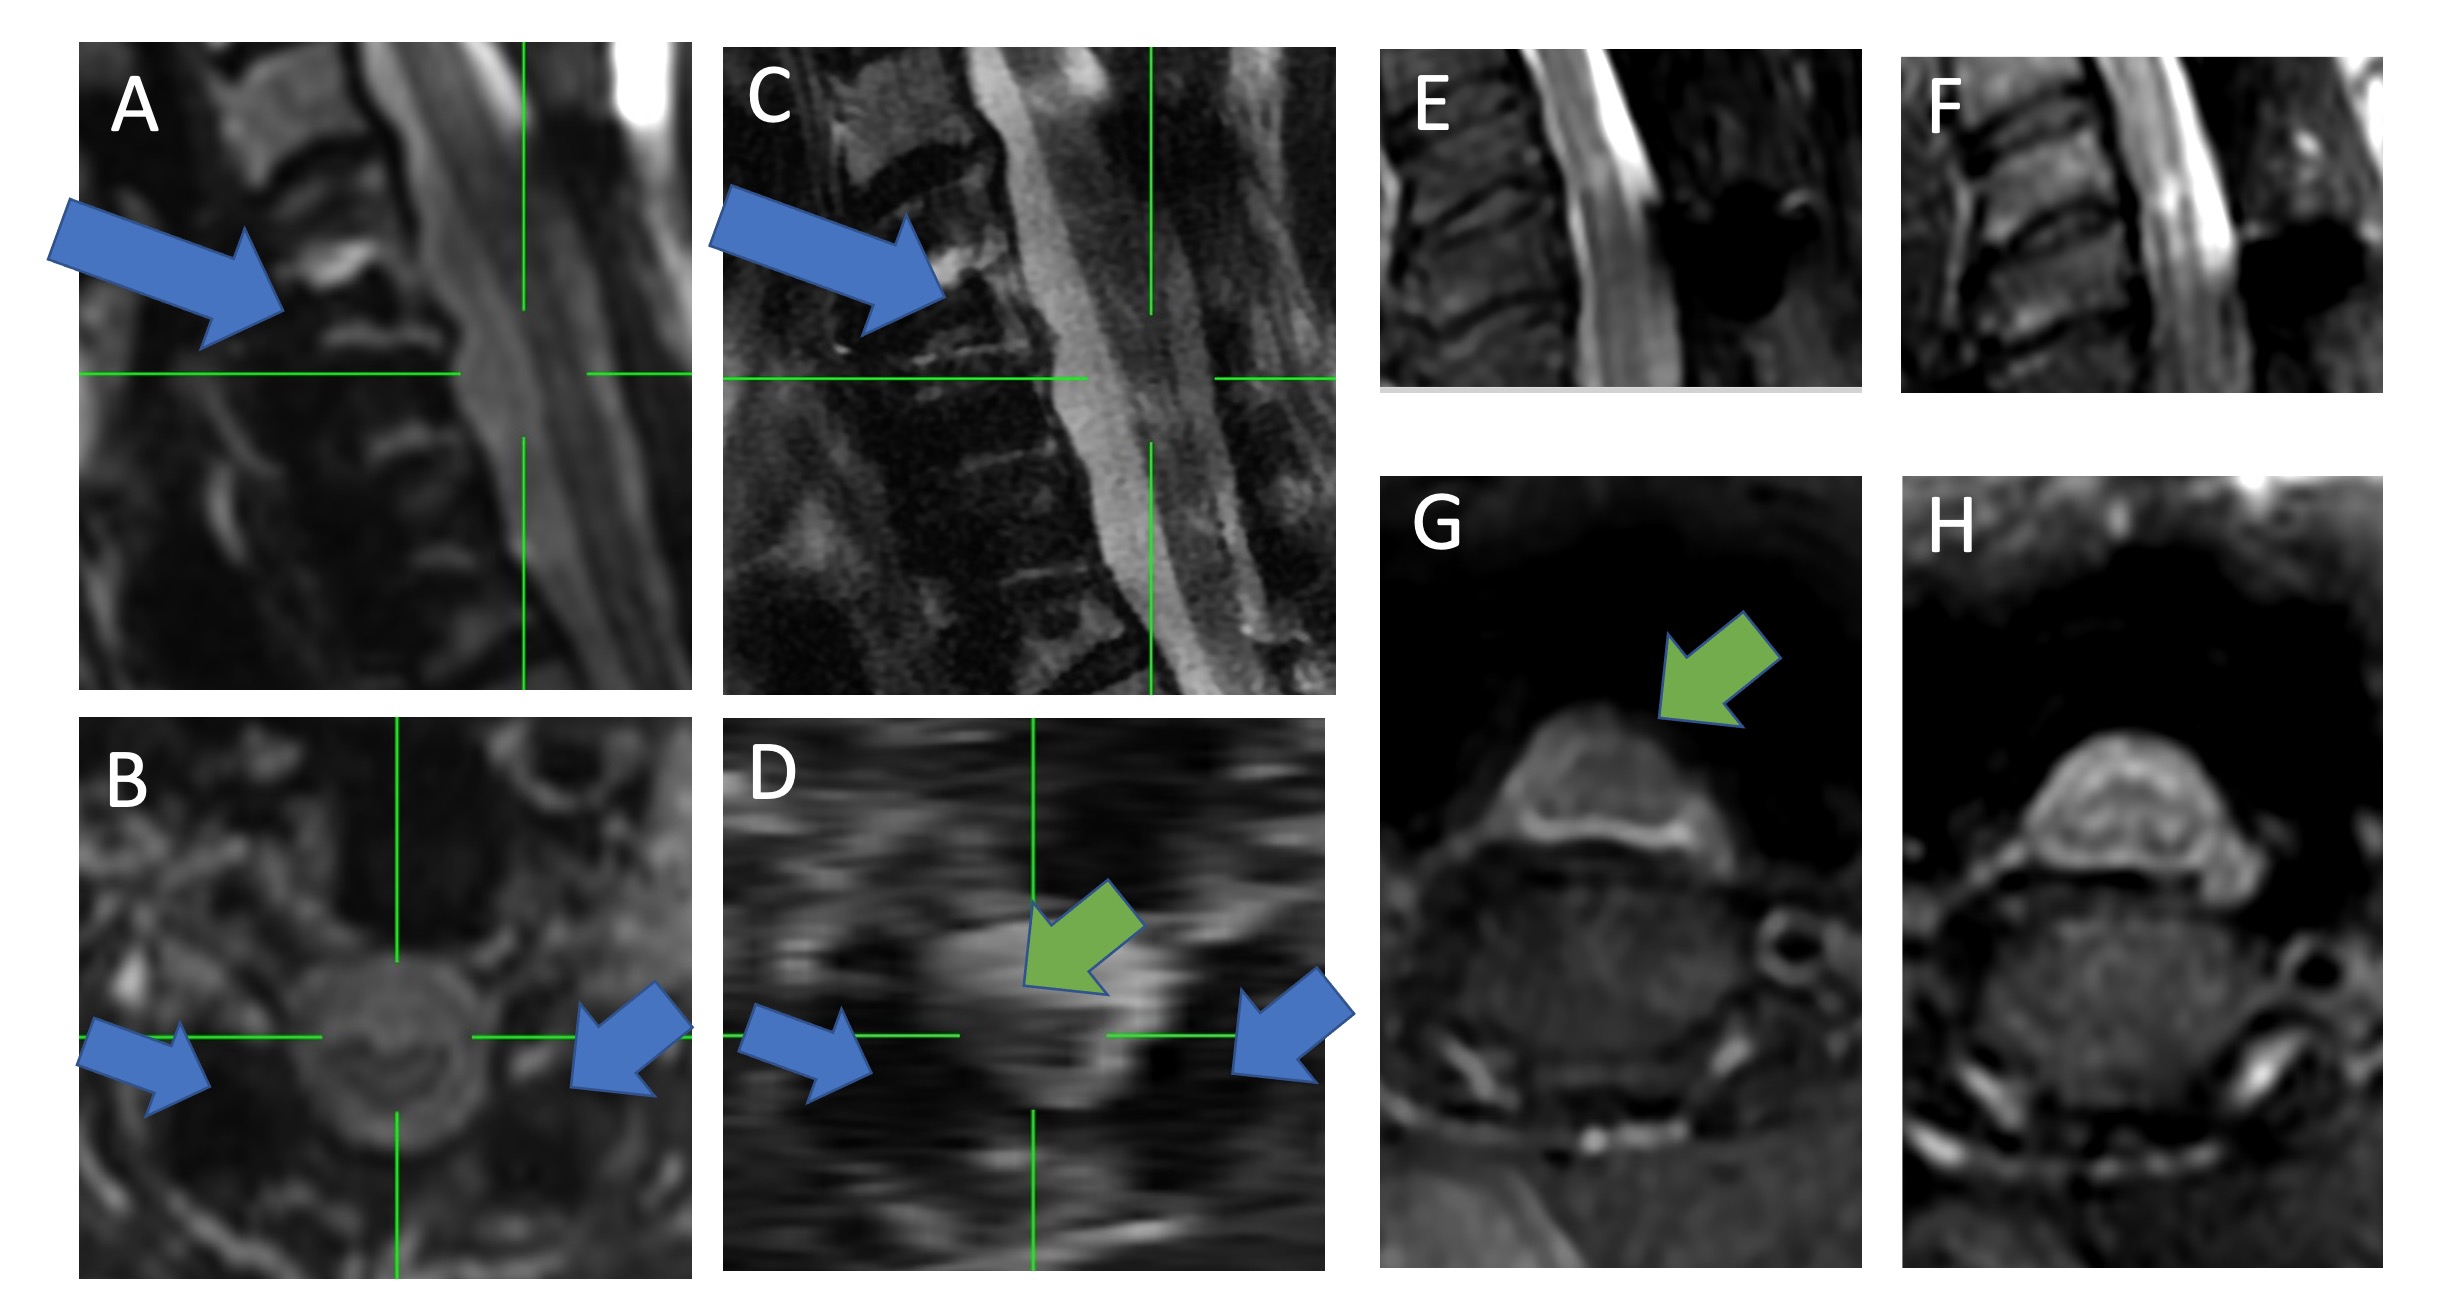
Figure 1 provides example images of potential MRI inputs for morphological analysis of the cord. It is clear that conventional 2D and 3D imaging sequences are problematic data inputs, whereby the cord is warped and/or impeded by signal loss due to metal artifacts. 3D-MSI MRI is an established approach to metal artifact reduction and is available on most major imaging vendor platforms.
Recently, new advances to 3D-MSI have allowed for 3D isotropic acquisitions near metal hardware.2 Presently, this new brand of 3D-MSI is deployed for morphological characterization of the spinal cord. This approach is tested on a pilot cohort of subjects treated with spinal fusion stabilization for substantial cord injury or degeneration. Technical methodology development required to utilize isotropic 3D-MSI MRI within SCT processing pipelines are described. Several morphological metrics are then demonstrated on the pilot test cohort.
Methods
T1 and T1 weighted 1.2 mm isotropic 3D-MSI MRI of the instrumented cervical spine were collected on a GE 3T Premier system. Data was collected on 12 subjects who provided written consent into an approved IRB study protocol. All subjects were fitted with either anterior, posterior, or both a/p titanium hardware fusions. Eight subjects were fused to treat severe degenerative cervical myelopathy, while the other 4 were fused to acutely stabilize a spinal cord injury.T2w images were acquired with TE=50ms, TR = 2s, using fast-recovery tip-back. T1w images were acquired with TE=8ms and TR = 600ms. The MSI sequences required 8 spectral bins to provide sufficient spectral coverage.
The acquisition time for each image series was roughly 5 minutes.
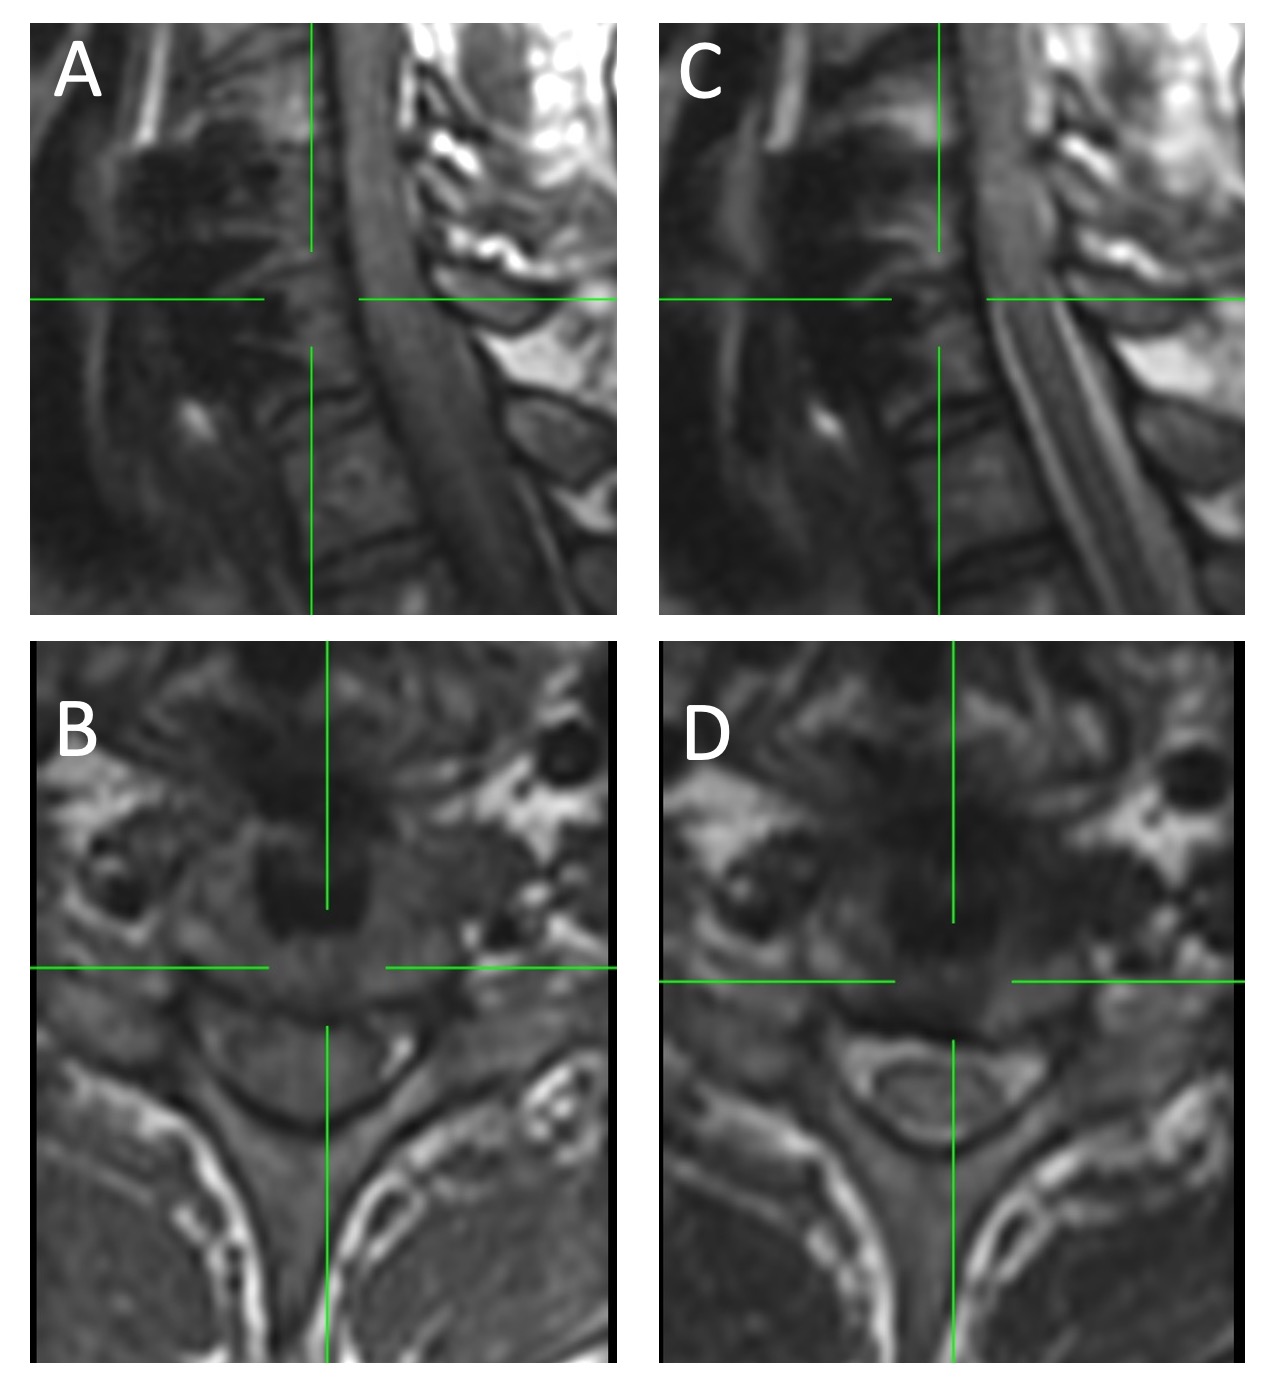
Figure 2 provides sample images from the isotropic 3D-MSI acquisitions. It should be noted that these images were acquired specifically for 3D morphological analysis and were not intended for planar radiological diagnostics.
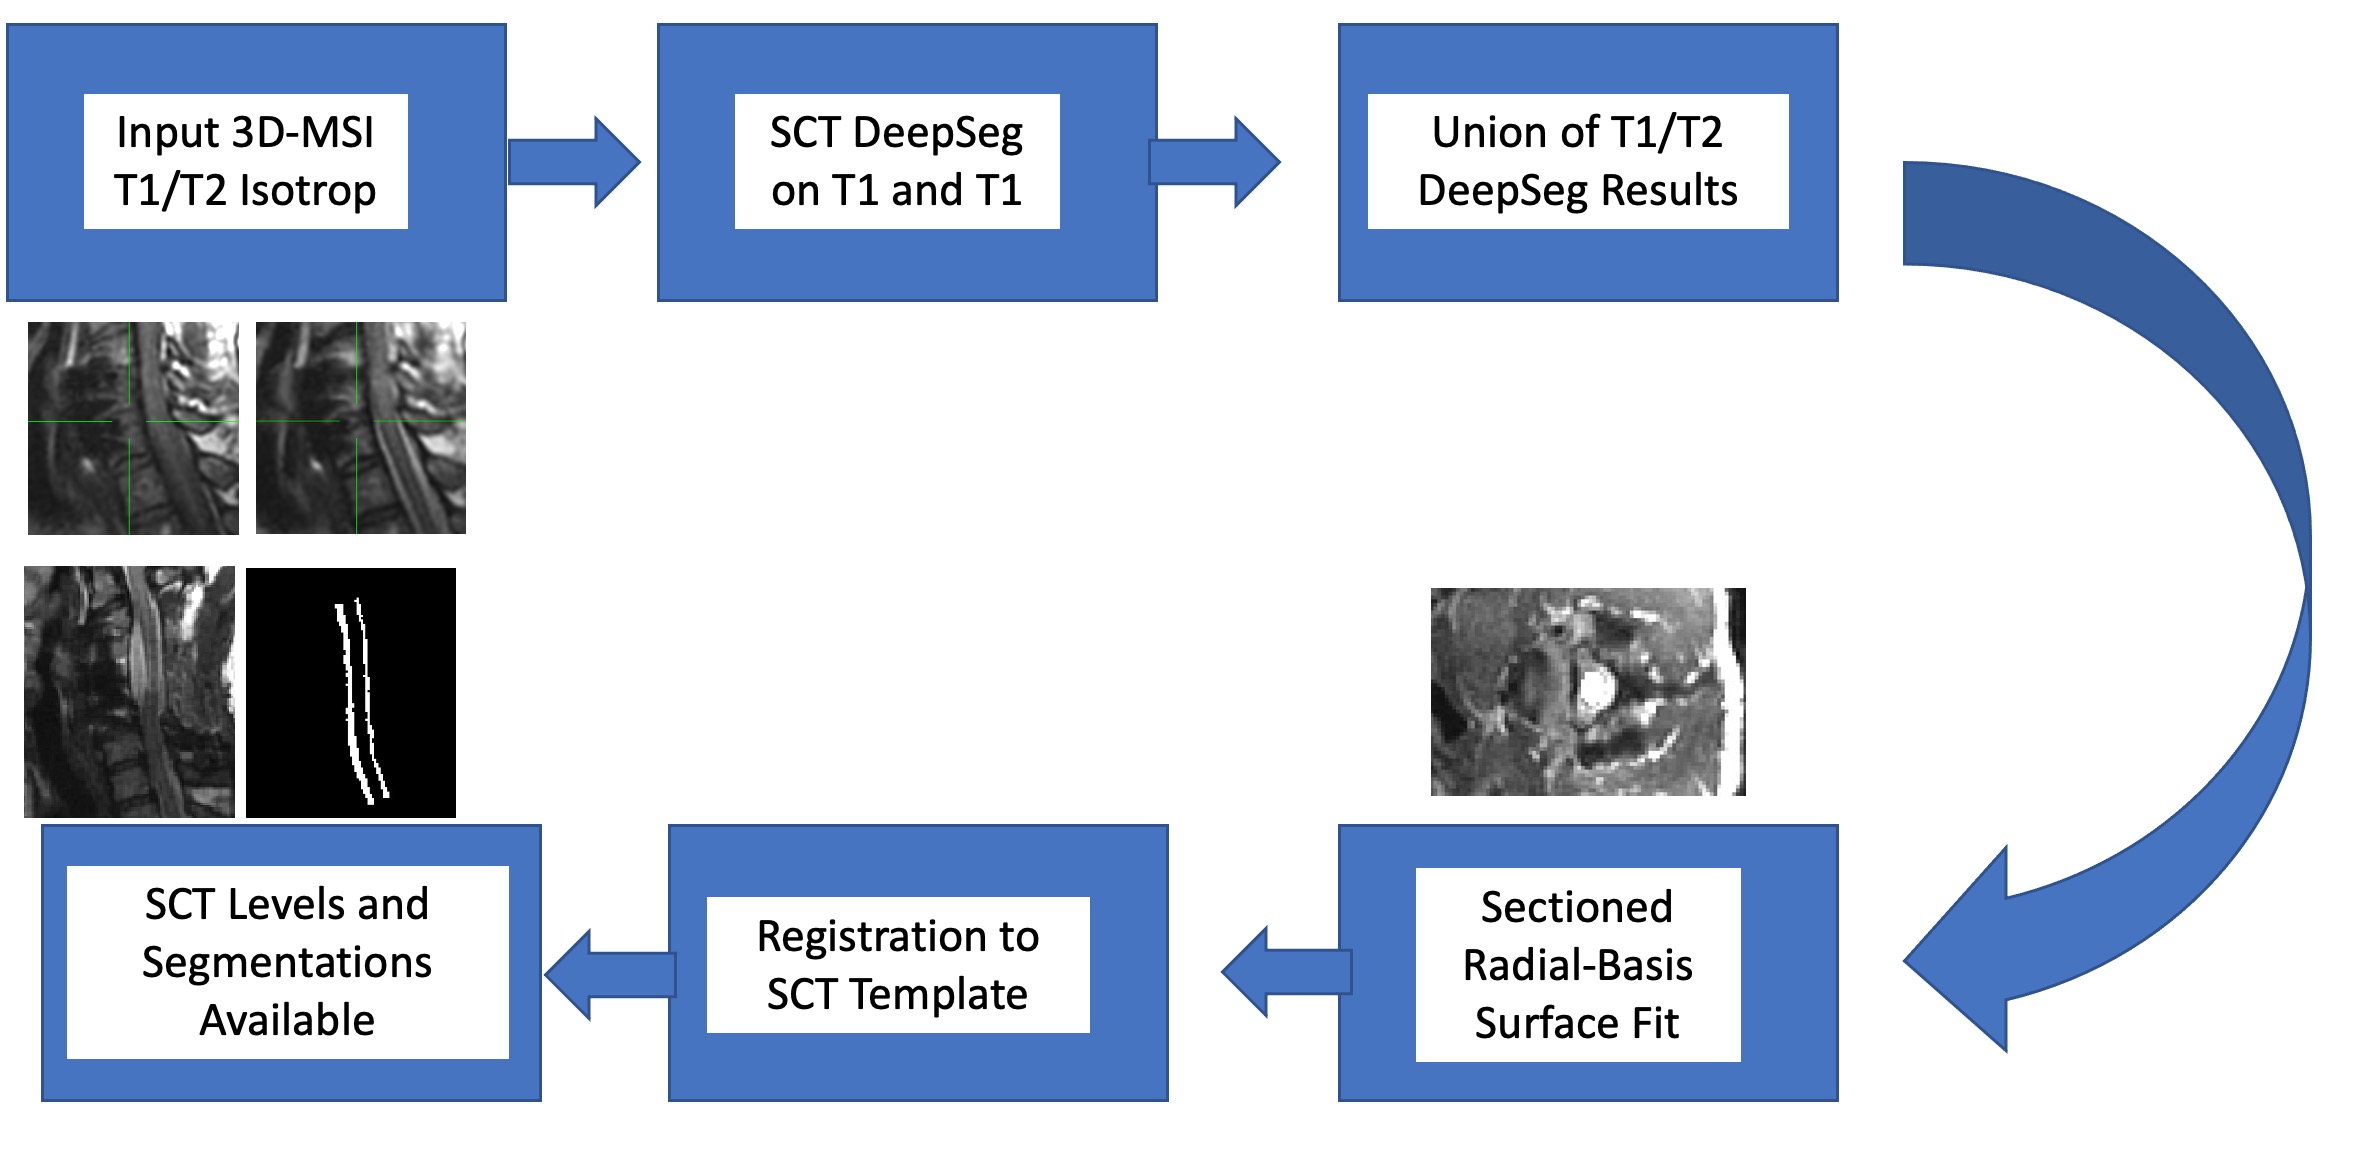
After an exhaustive search of options using the SCT cord segmentation tools, it was realized that the 3D-MSI input images could not be segmented using the available automated or semi-automated options. As a result, a dedicated pipeline was constructed for automated segmentation of 3D-MSI isotropic images. This pipeline augments the conventional SCT pipeline to automatically process input 3D-MSI data. This pipeline is illustrated in Figure 3.
Using the augmented SCT pipeline results, cord cross-sectional area and aspect ratio were computed using a custom-developed ray-tracer algorithm. In addition, the registered SCT cerebral spinal fluid template was used within another custom developed script to perform “pothole” z-Score analysis of reduced peri-cord CSF in the pilot study cohort. This final metric proved to offer valuable morphological insight into cord impingement across the disease cohort.
Results
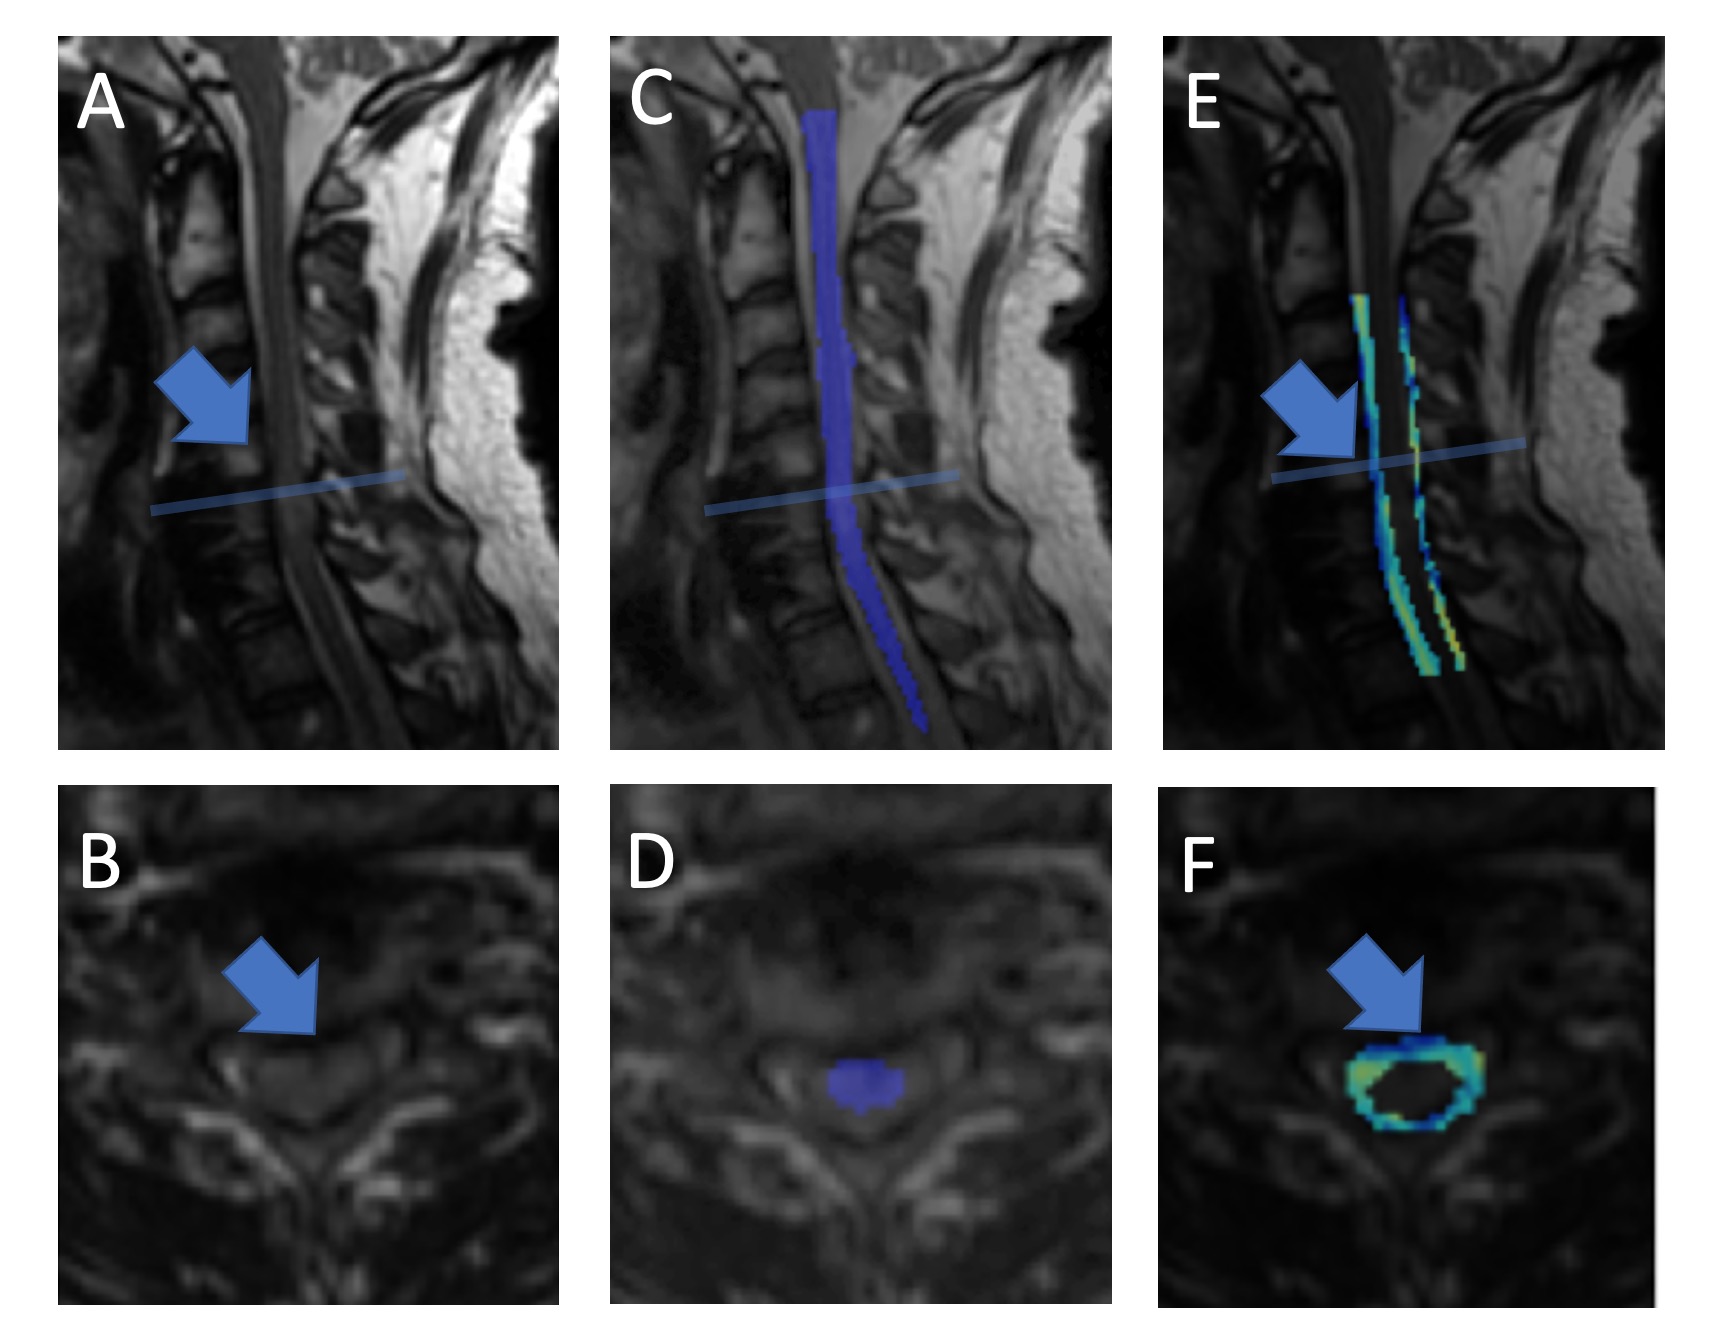
The described augmented SCT pipeline was able to automatically process 3D-MSI data acquired within the entire 12 subject pilot cohort without failure.Figure 4 provides exemplary images of the resulting automated morphological pipeline. The displayed subject has been diagnosed with cervical myelopathy and has substantial cord impingement.
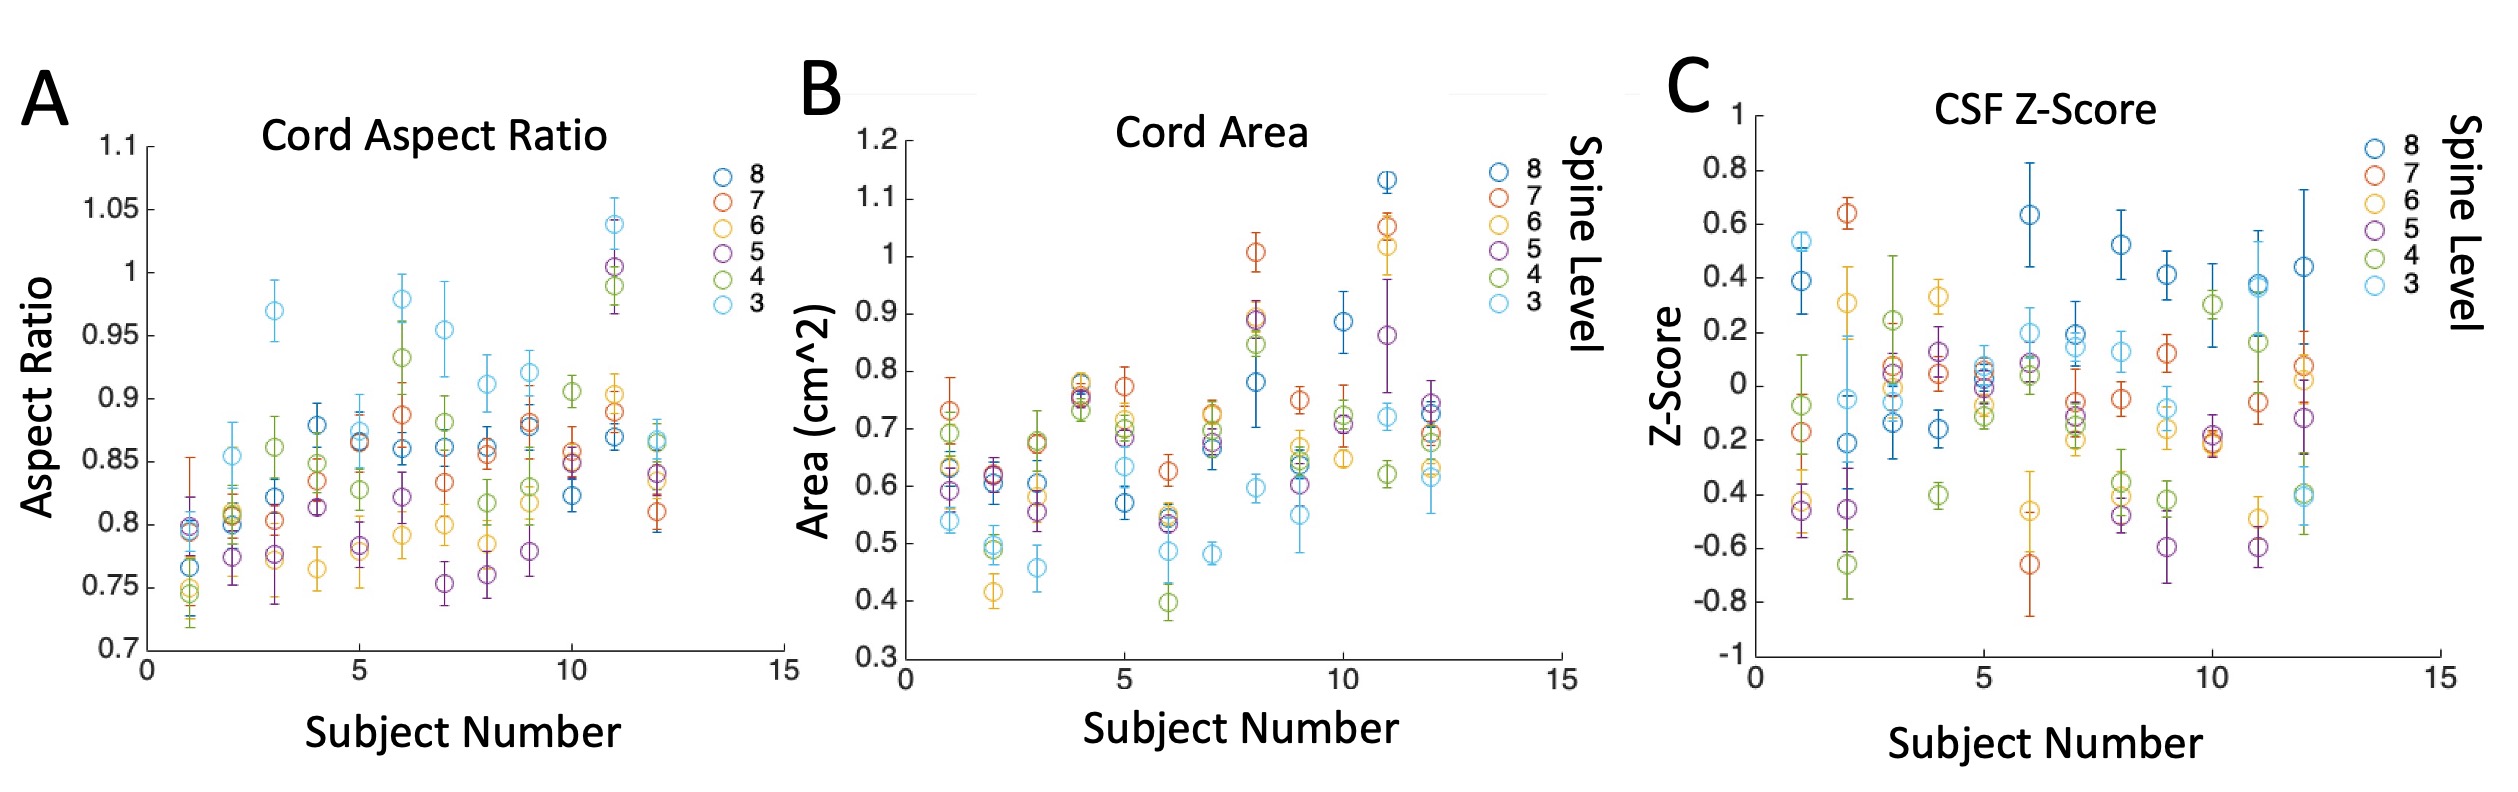
Figure 5 displays the results of 3 morphological metrics automatically computed across the pilot cohort. Error bars reflect the relative stability (standard deviation) of each metric, as the displayed points are averaged over spinal cord levels for each subject.
Discussion
This technical feasibility study has established a viable automated pipeline for morphological spinal cord analysis of isotropic 3D-MSI MRI. The described technology is currently being utilized within an active study of spinal cord injury and degeneration. Specialized metrics indicative of the morphology encountered in these subjects, including cord compression and impingement, have been developed and presented in this report. Future testing and trials of the presented workflows and metrics will allow for improved refinement and robustness analysis.Following further stress testing of the described pipeline, we plan to merge its code into the main branch of the open-source SCT package to offer the spinal cord research community a pathway for automated segmentation and analysis of the instrumented cord. The algorithms presented in this report were developed in python using standard tools, including SciPy, NumPy, and SimpleItk, which will facilitate simple integration into the SCT framework.
Future investigations will also leverage the radial basis functions utilized for the cord surface modeling presented in this work to perform more sophisticated differential geometry measures of surface morphology. It is anticipated that further insight on cord pathology may be extracted from measures such as mean and Gaussian curvature of cord surfaces.
Acknowledgements
Supported by the Department of Defense Broad Agency Announcement for Extramural Medical Research through award number W81XWH1910273References
1. De Leener B, Levy S, Dupont SM, Fonov VS, Stikov N, Louis Collins D, Callot V, Cohen-Adad J. SCT: Spinal Cord Toolbox, an open-source software for processing spinal cord MRI data. Neuroimage 20162.
2. Zochowski, Kelly C., Mauro A. Miranda, Jacky Cheung, Erin C. Argentieri, Bin Lin, S. Sivaram Kaushik, Alissa J. Burge, Hollis G. Potter, and Matthew F. Koff. "MRI of Hip Arthroplasties: Comparison of Isotropic Multiacquisition Variable-Resonance Image Combination Selective (MAVRIC SL) Acquisitions With a Conventional MAVRIC SL Acquisition." American Journal of Roentgenology 213, no. 6 (2019): W277-W286.
Figures