3469
A robust framework for characterising diffusion metrics of peripheral nerves: exploiting state of the art tracking methods1Brain and Mind Centre, The University of Sydney, Sydney, Australia, 2Central Clinical School, The University of Sydney, Sydney, Australia, 3I-MED Radiology Network, Camperdown, Australia, 4Department of Neurology, Royal Prince Alfred Hospital, Camperdown, Australia, 5School of Biomedical Engineering, The University of Sydney, Sydney, Australia, 6Sydney Imaging, The University of Sydney, Sydney, Australia
Synopsis
Diffusion MRI has previously been used to quantify peripheral nerves; however, traditional post-processing techniques have several limitations. Here, we demonstrate the feasibility of using state-of-the-art diffusion analysis tools to reconstruct and quantify the ulnar nerve of the forearm. Constrained-spherical deconvolution was combined with probabilistic fibre-tracking to compute several track-weighted measurements in the ulnar nerve. The results suggest that a sample size of 22 would be sufficient to detect a 10% difference in any of the measured track-weighted metrics, and a sample size of 20 would be large enough to detect within-subject differences as small as 3%.
Introduction
In vivo quantification of nerve properties is of clinical interest as it could assist in assessing nerve damage, response to therapy and monitoring progressive neurodegeneration. Diffusion MRI has been used to quantify peripheral nerves1. Typically, peripheral nerves are reconstructed from tensors using deterministic fibre tracking algorithms1, which suffer from several shortcomings, including sensitivity to noise and difficulties reconstructing complete pathways in regions with crossing fibres2. Advances in neuroimaging post-processing have overcome many of the limitations faced by tensor-based reconstructions; although to the best of our knowledge, have not been applied to investigate peripheral nerves. Here, we demonstrate the feasibility of using state-of-the-art diffusion analysis tools to reconstruct and quantify the ulnar nerve. Additionally, we calculate the single-session between-subject variability, and the inter-session within-subject variability of track-weighted (TW) measurements3. Variability measurements in this study will provide important missing power size information to inform future clinical studies.Materials and Methods
Subject characteristicsEight healthy adult subjects were included in this study. Approval was obtained from the local human research ethics committee.
Image acquisition
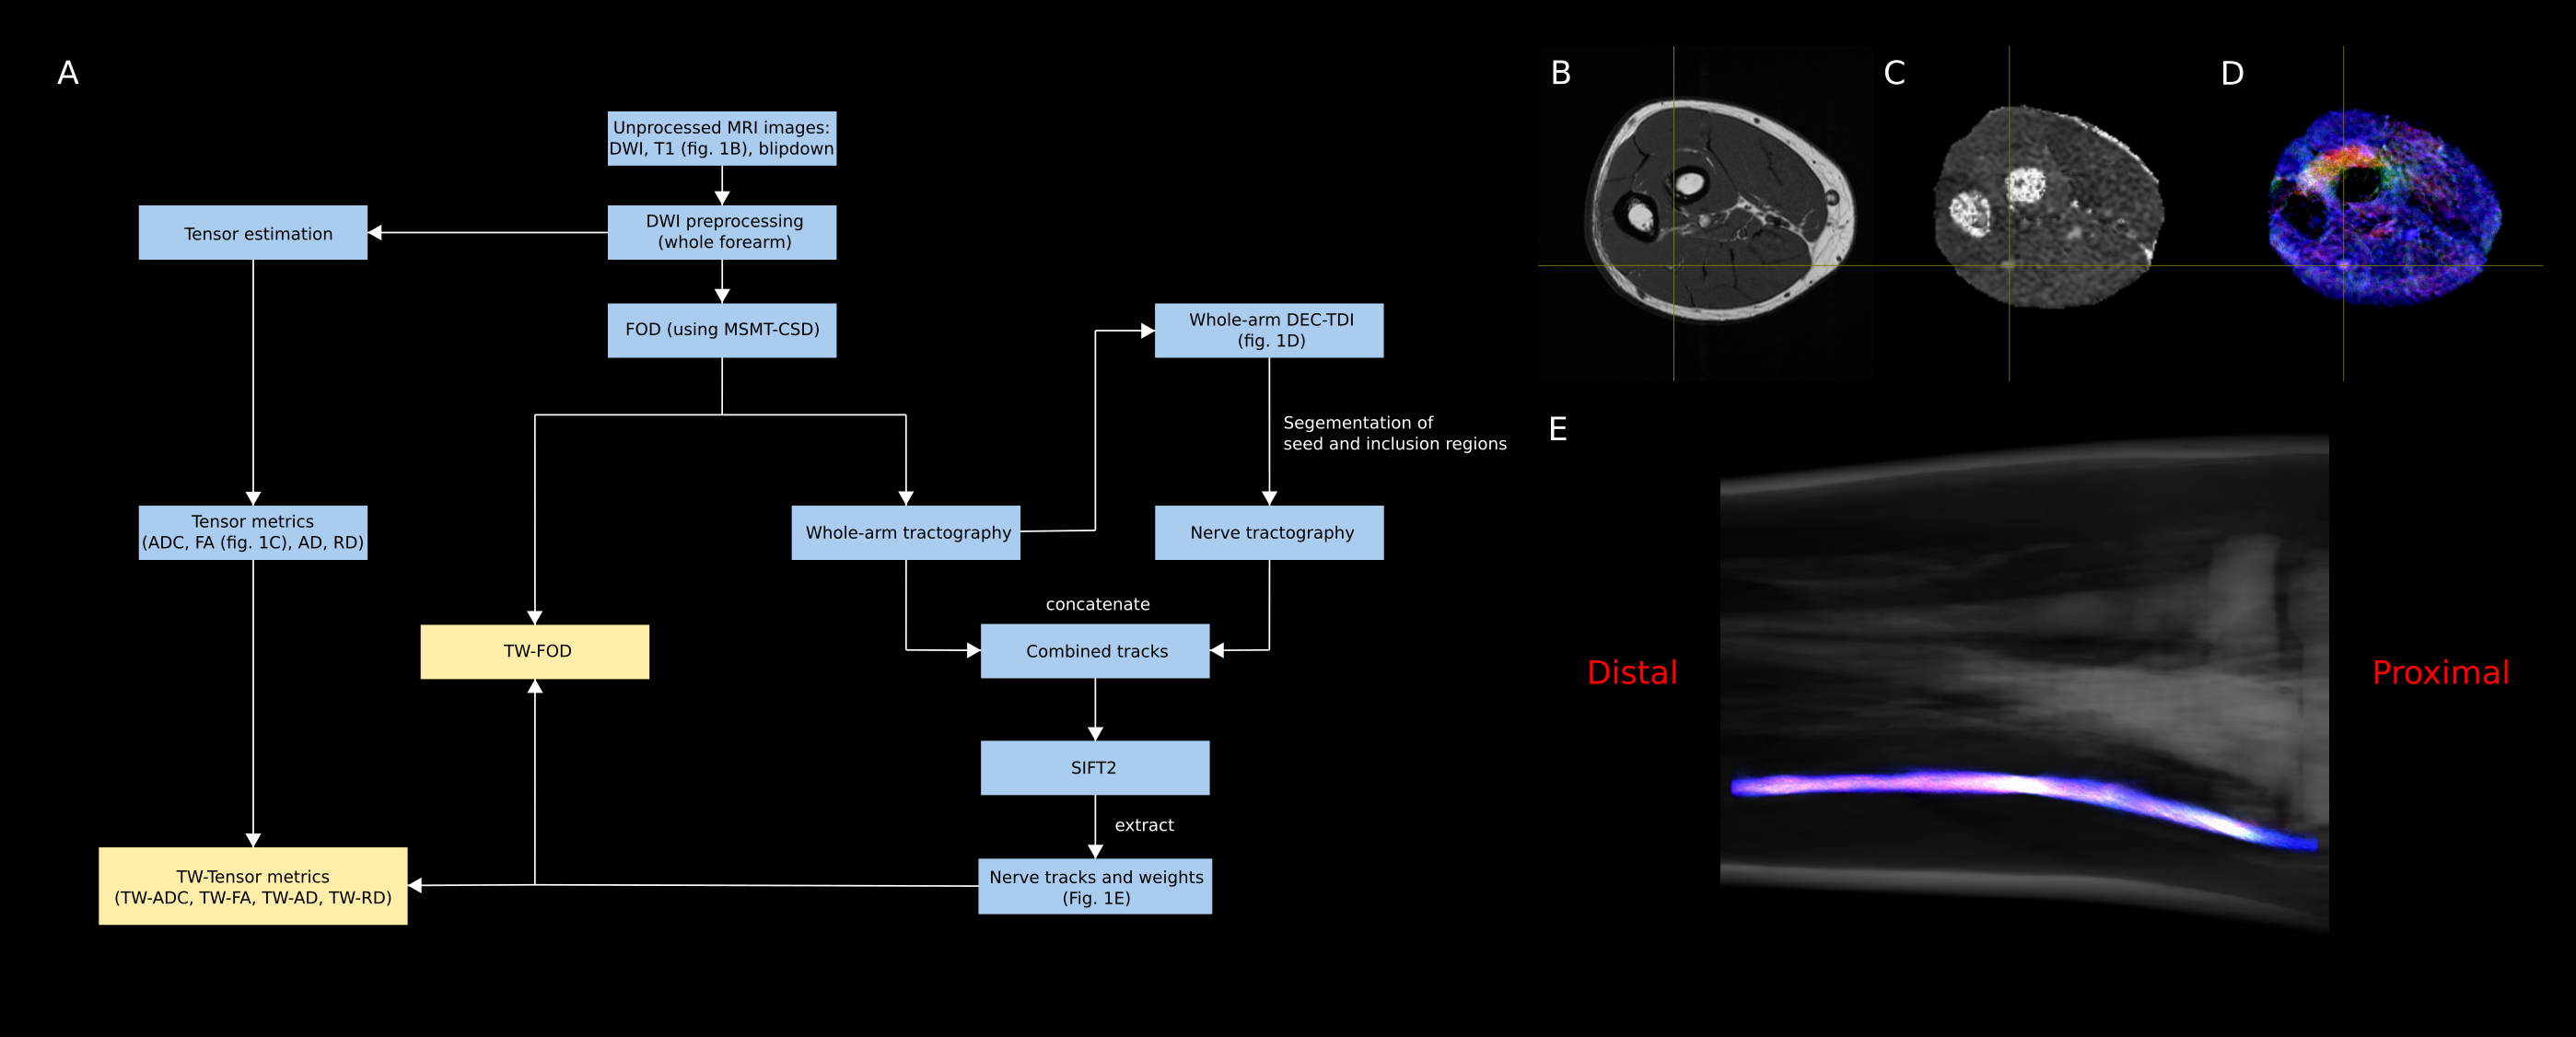
A 3-Tesla GE MRI scanner was used to obtain anatomical (Figure 1B) and diffusion images (with b values 0, 300, 450, 600, 750 and 900 s/mm2, 24 directions in each shell, slice thickness 3 mm, FOV 16 cm) of the right forearm. Each subject was scanned on two occasions.
Image processing
The image processing pipeline (see Figure 1) and was conducted using MRtrix4,5. Test and re-test nerve measurements were calculated for each TWI map (i.e., track-weighted fibre orientation distribution (TW-FOD), track-weighted apparent diffusion coefficient (TW-ADC), track-weighted fractional anisotropy (TW-FA), track-weighted axial diffusivity (TW-AD) and track-weighted radial diffusivity (TW-RD))3.
Statistical analysis
Variability analysis
Single-session between-subject variance (σBS2) and coefficient of variation (CVBS) were computed from the TWI map from the test scans. Inter-session within-subject variability (σWS2) and coefficient of variation (CVWS) were computed for each TWI map using test and re-test scans6.
Power analysis
The number of subjects per group required to detect a pre-specified percentage change (PC) was calculated using Equation 17:
Equation 1
$$N=\frac{(Z_{1−\frac{α}{2}} +Z_{1−β})^2 CV^2_{BS} (1 +(1−PC)^2)} {2PC^2}$$
where $$$Z_{1−\frac{α}{2}} \approx1.96$$$ when α = 0.05, and $$$Z_{1−β} \approx0.84$$$ when β =0.2. Here we considered the specific case of PC = 10%. The minimum detectable percentage change for a sample size of 20 was approximated using Equation 28:
Equation 2
$$PC\approx\frac{(Z_{1−\frac{α}{2}} +Z_{1−β}) CV} {\sqrt{N}}$$
where N=20 and PC was obtained using the corresponding CV.
Results
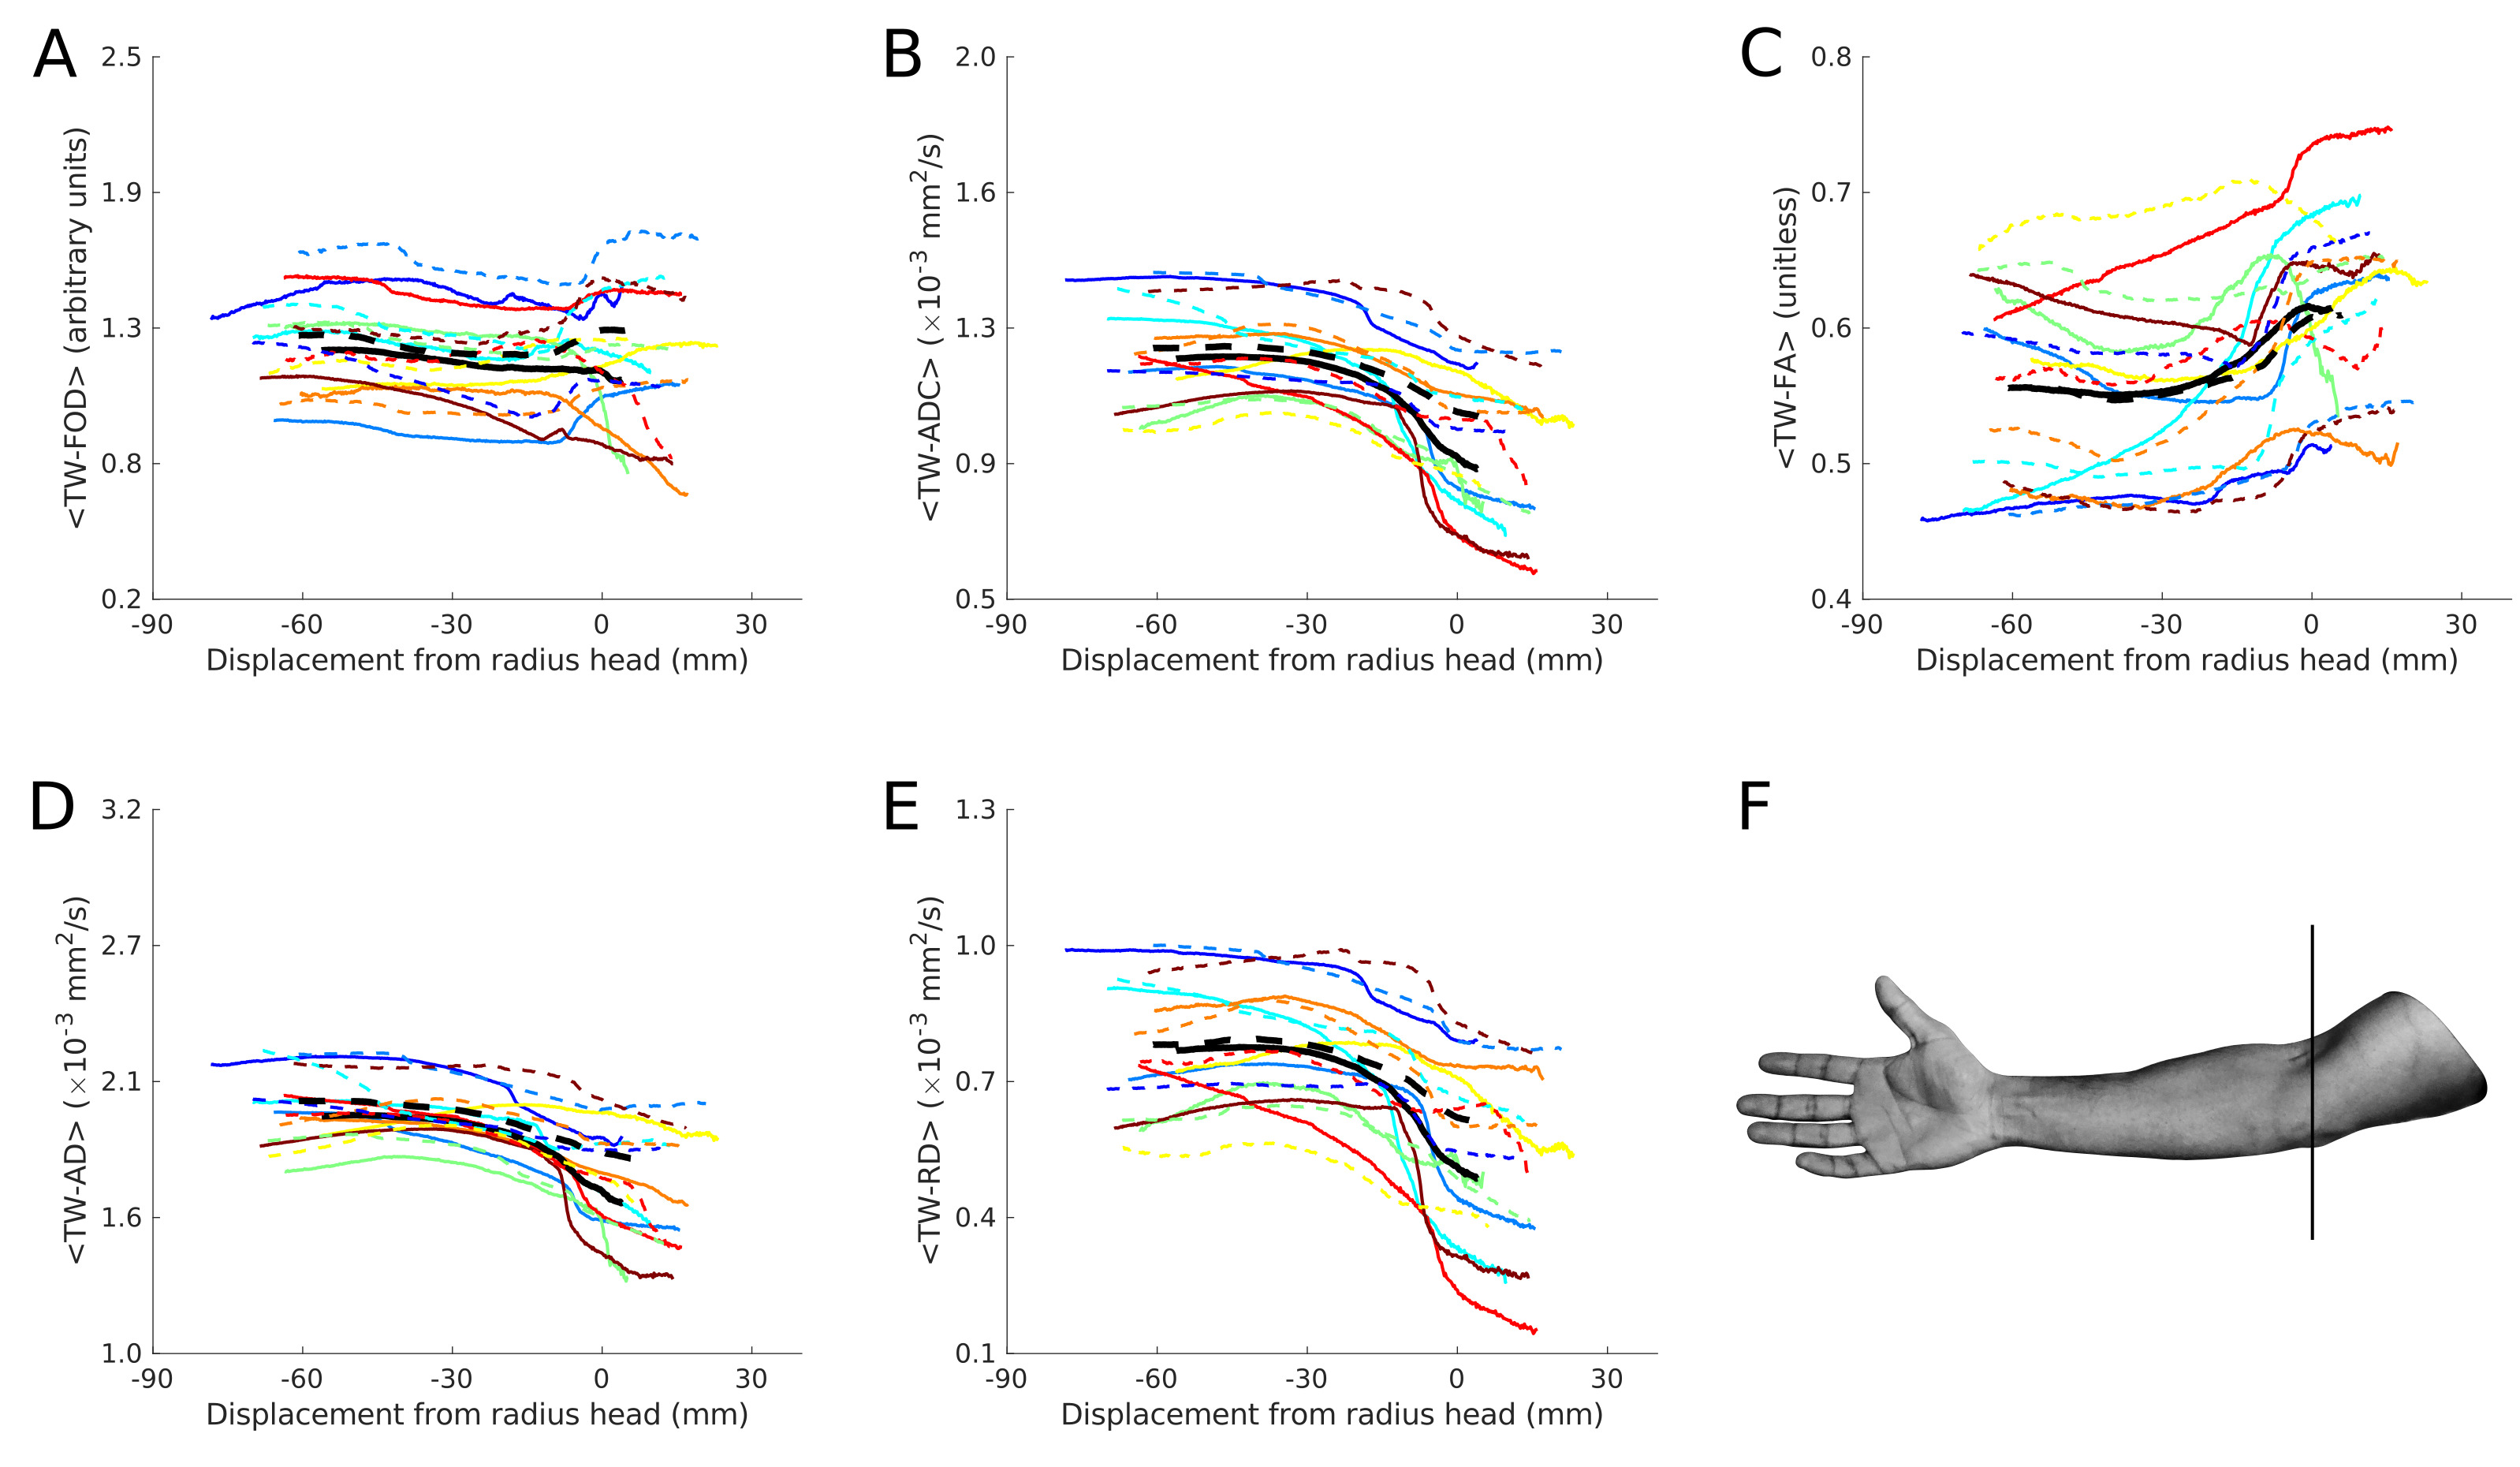
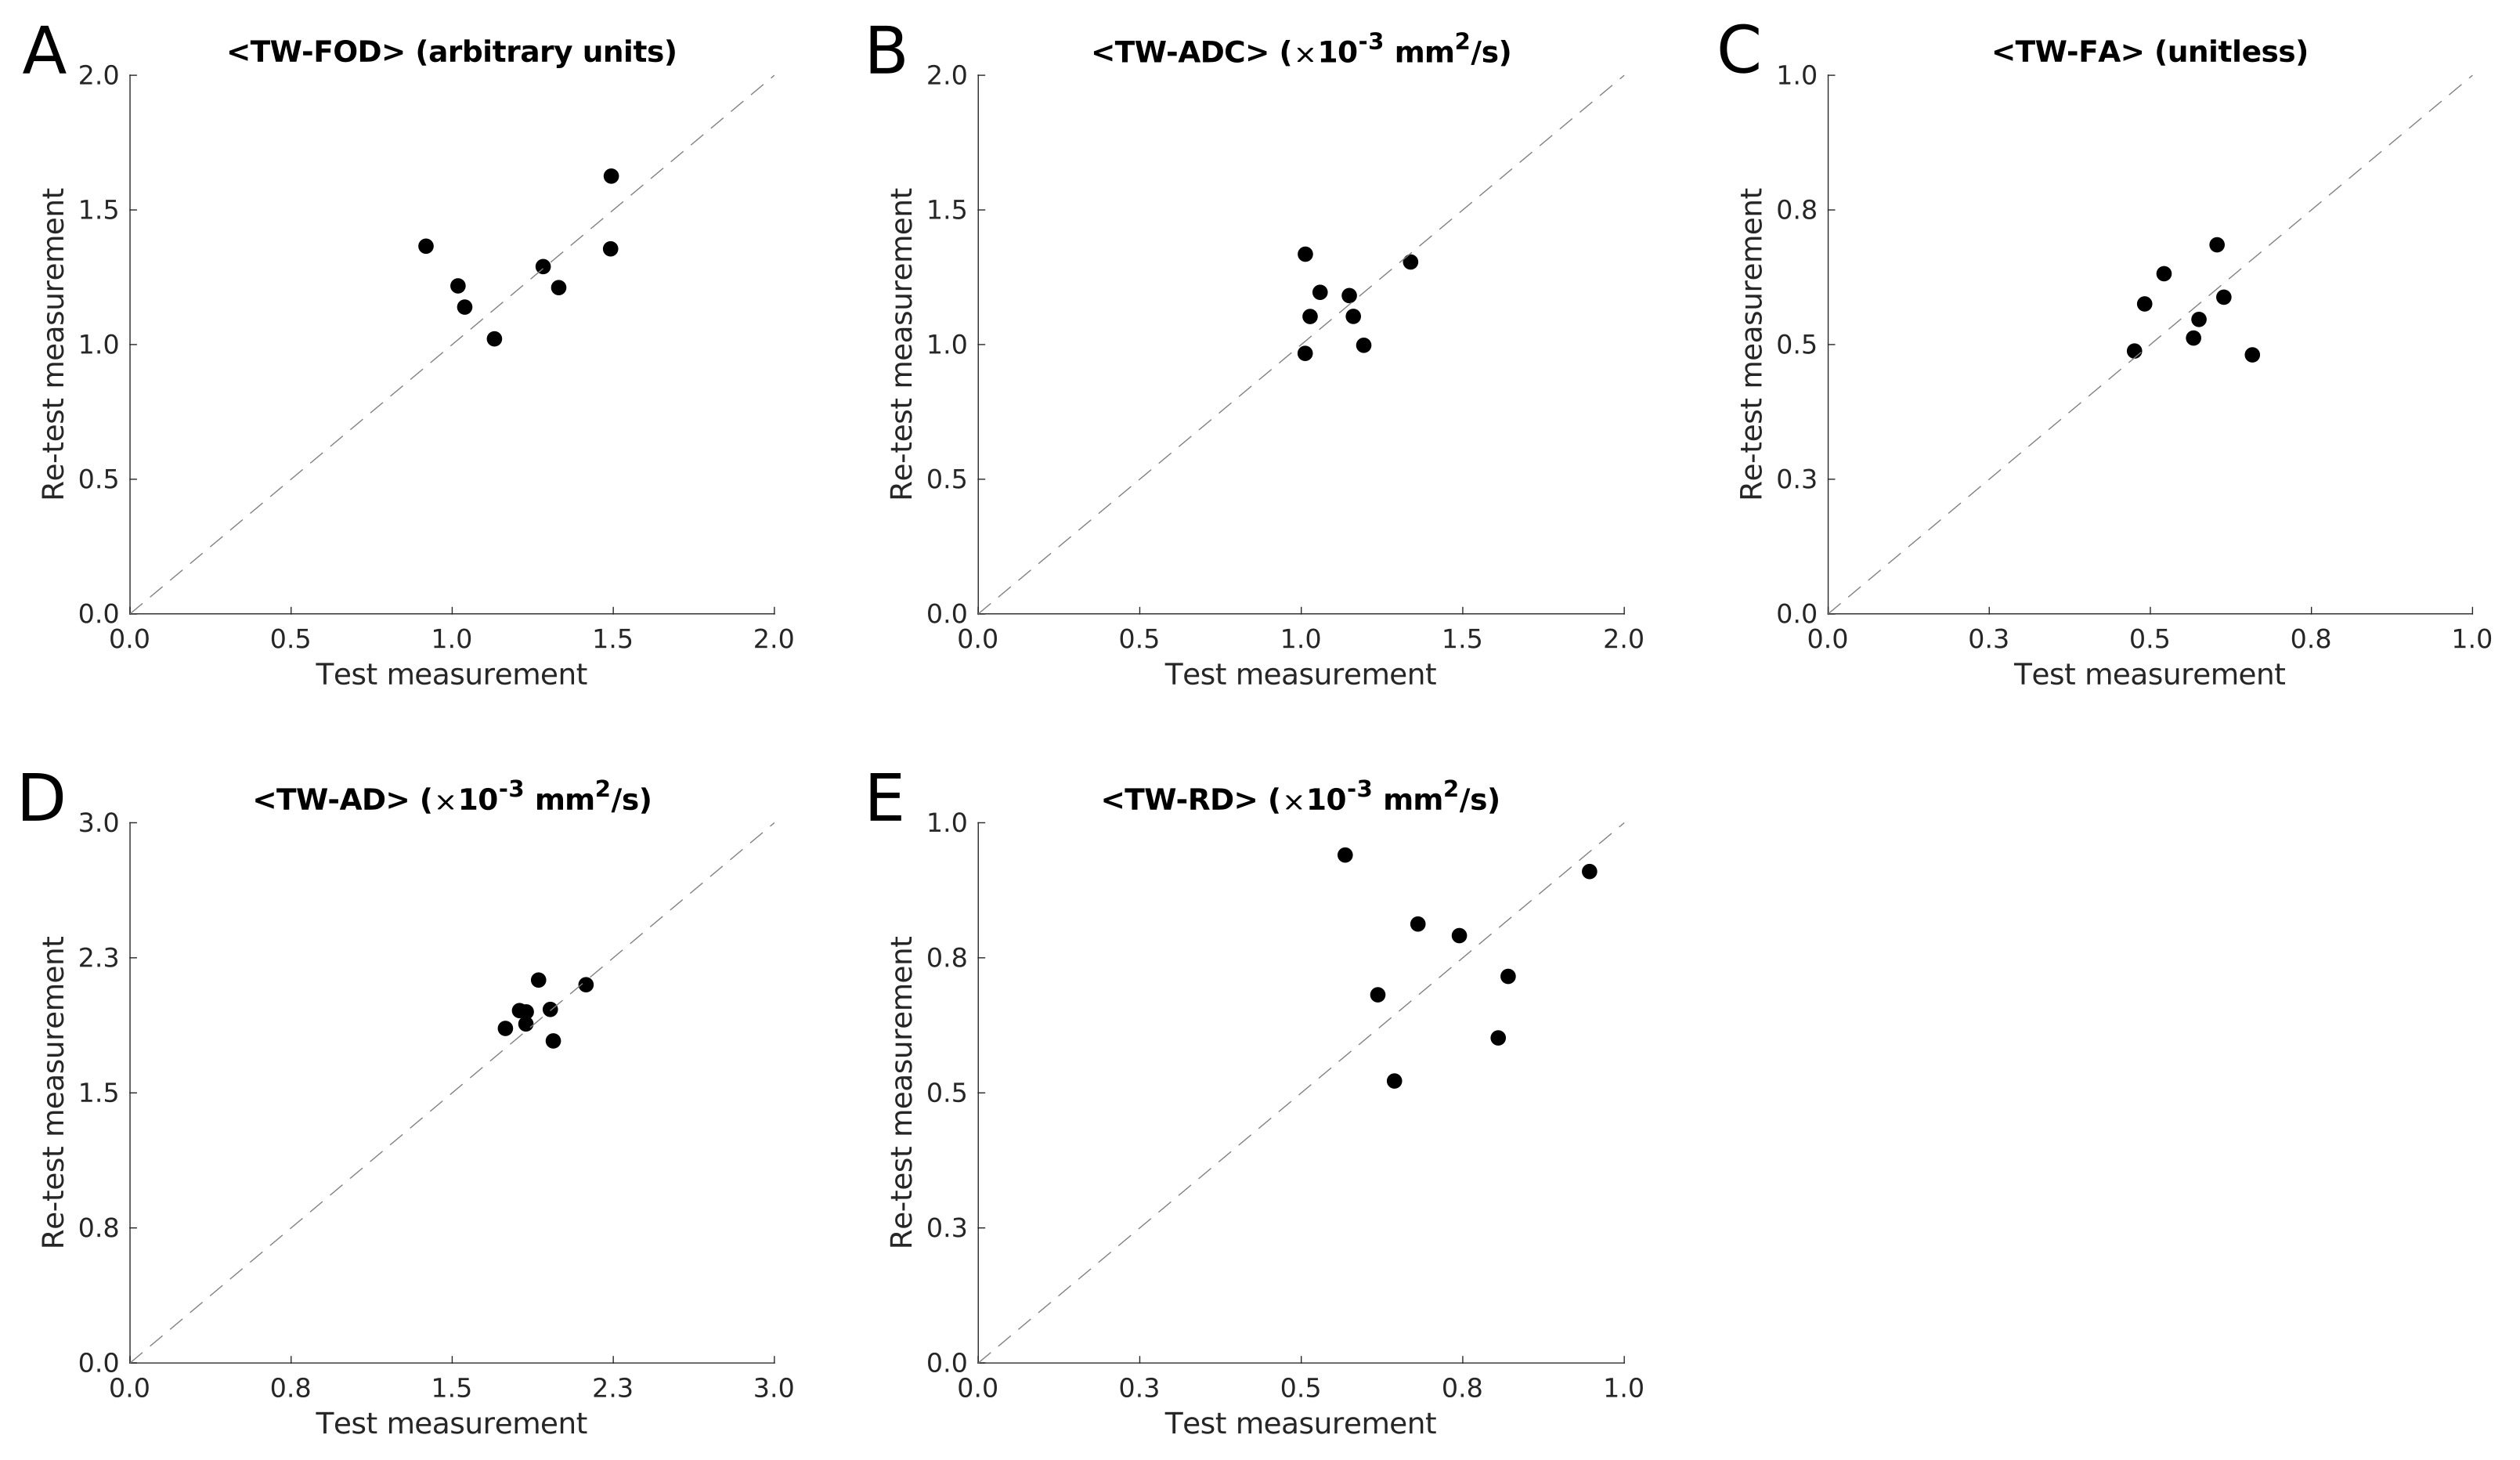
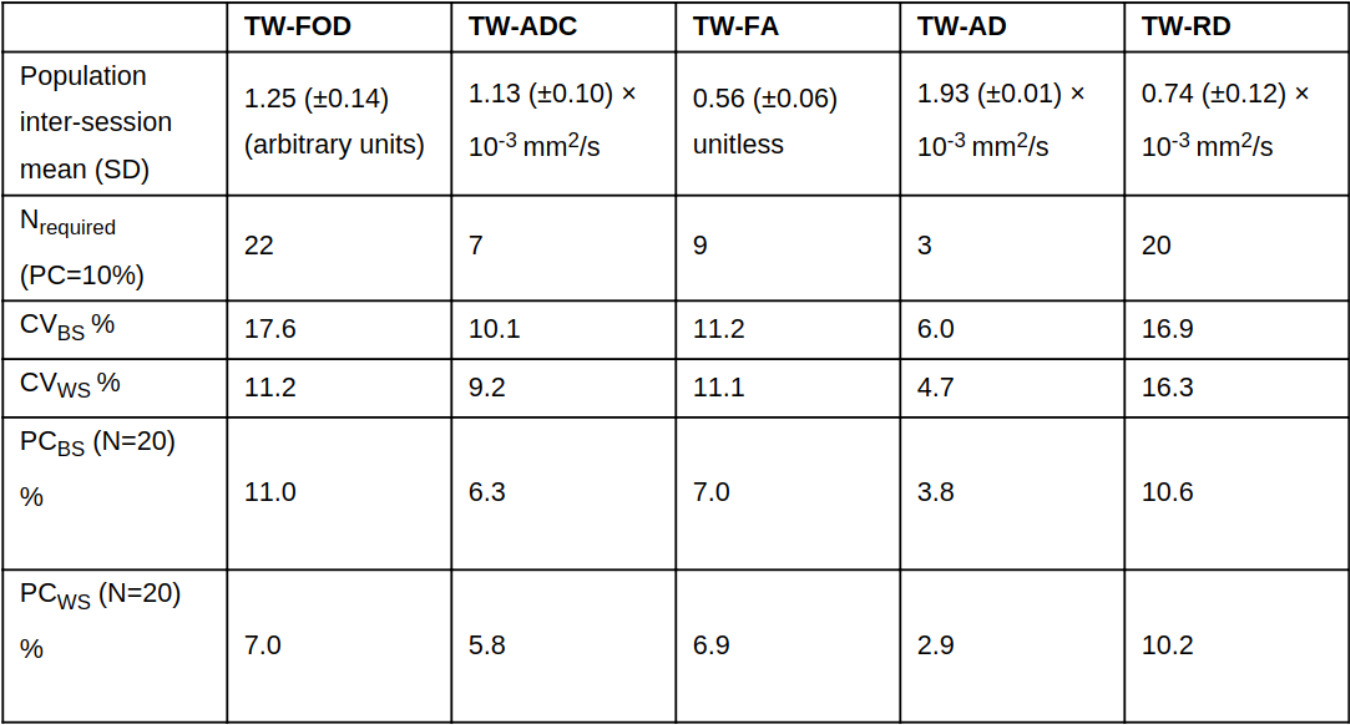
TW-measurementsTWI profiles are shown in Figure 2. Test-retest nerve measurements are shown in Figure 3. Average TWI metrics are provided in Table 1.
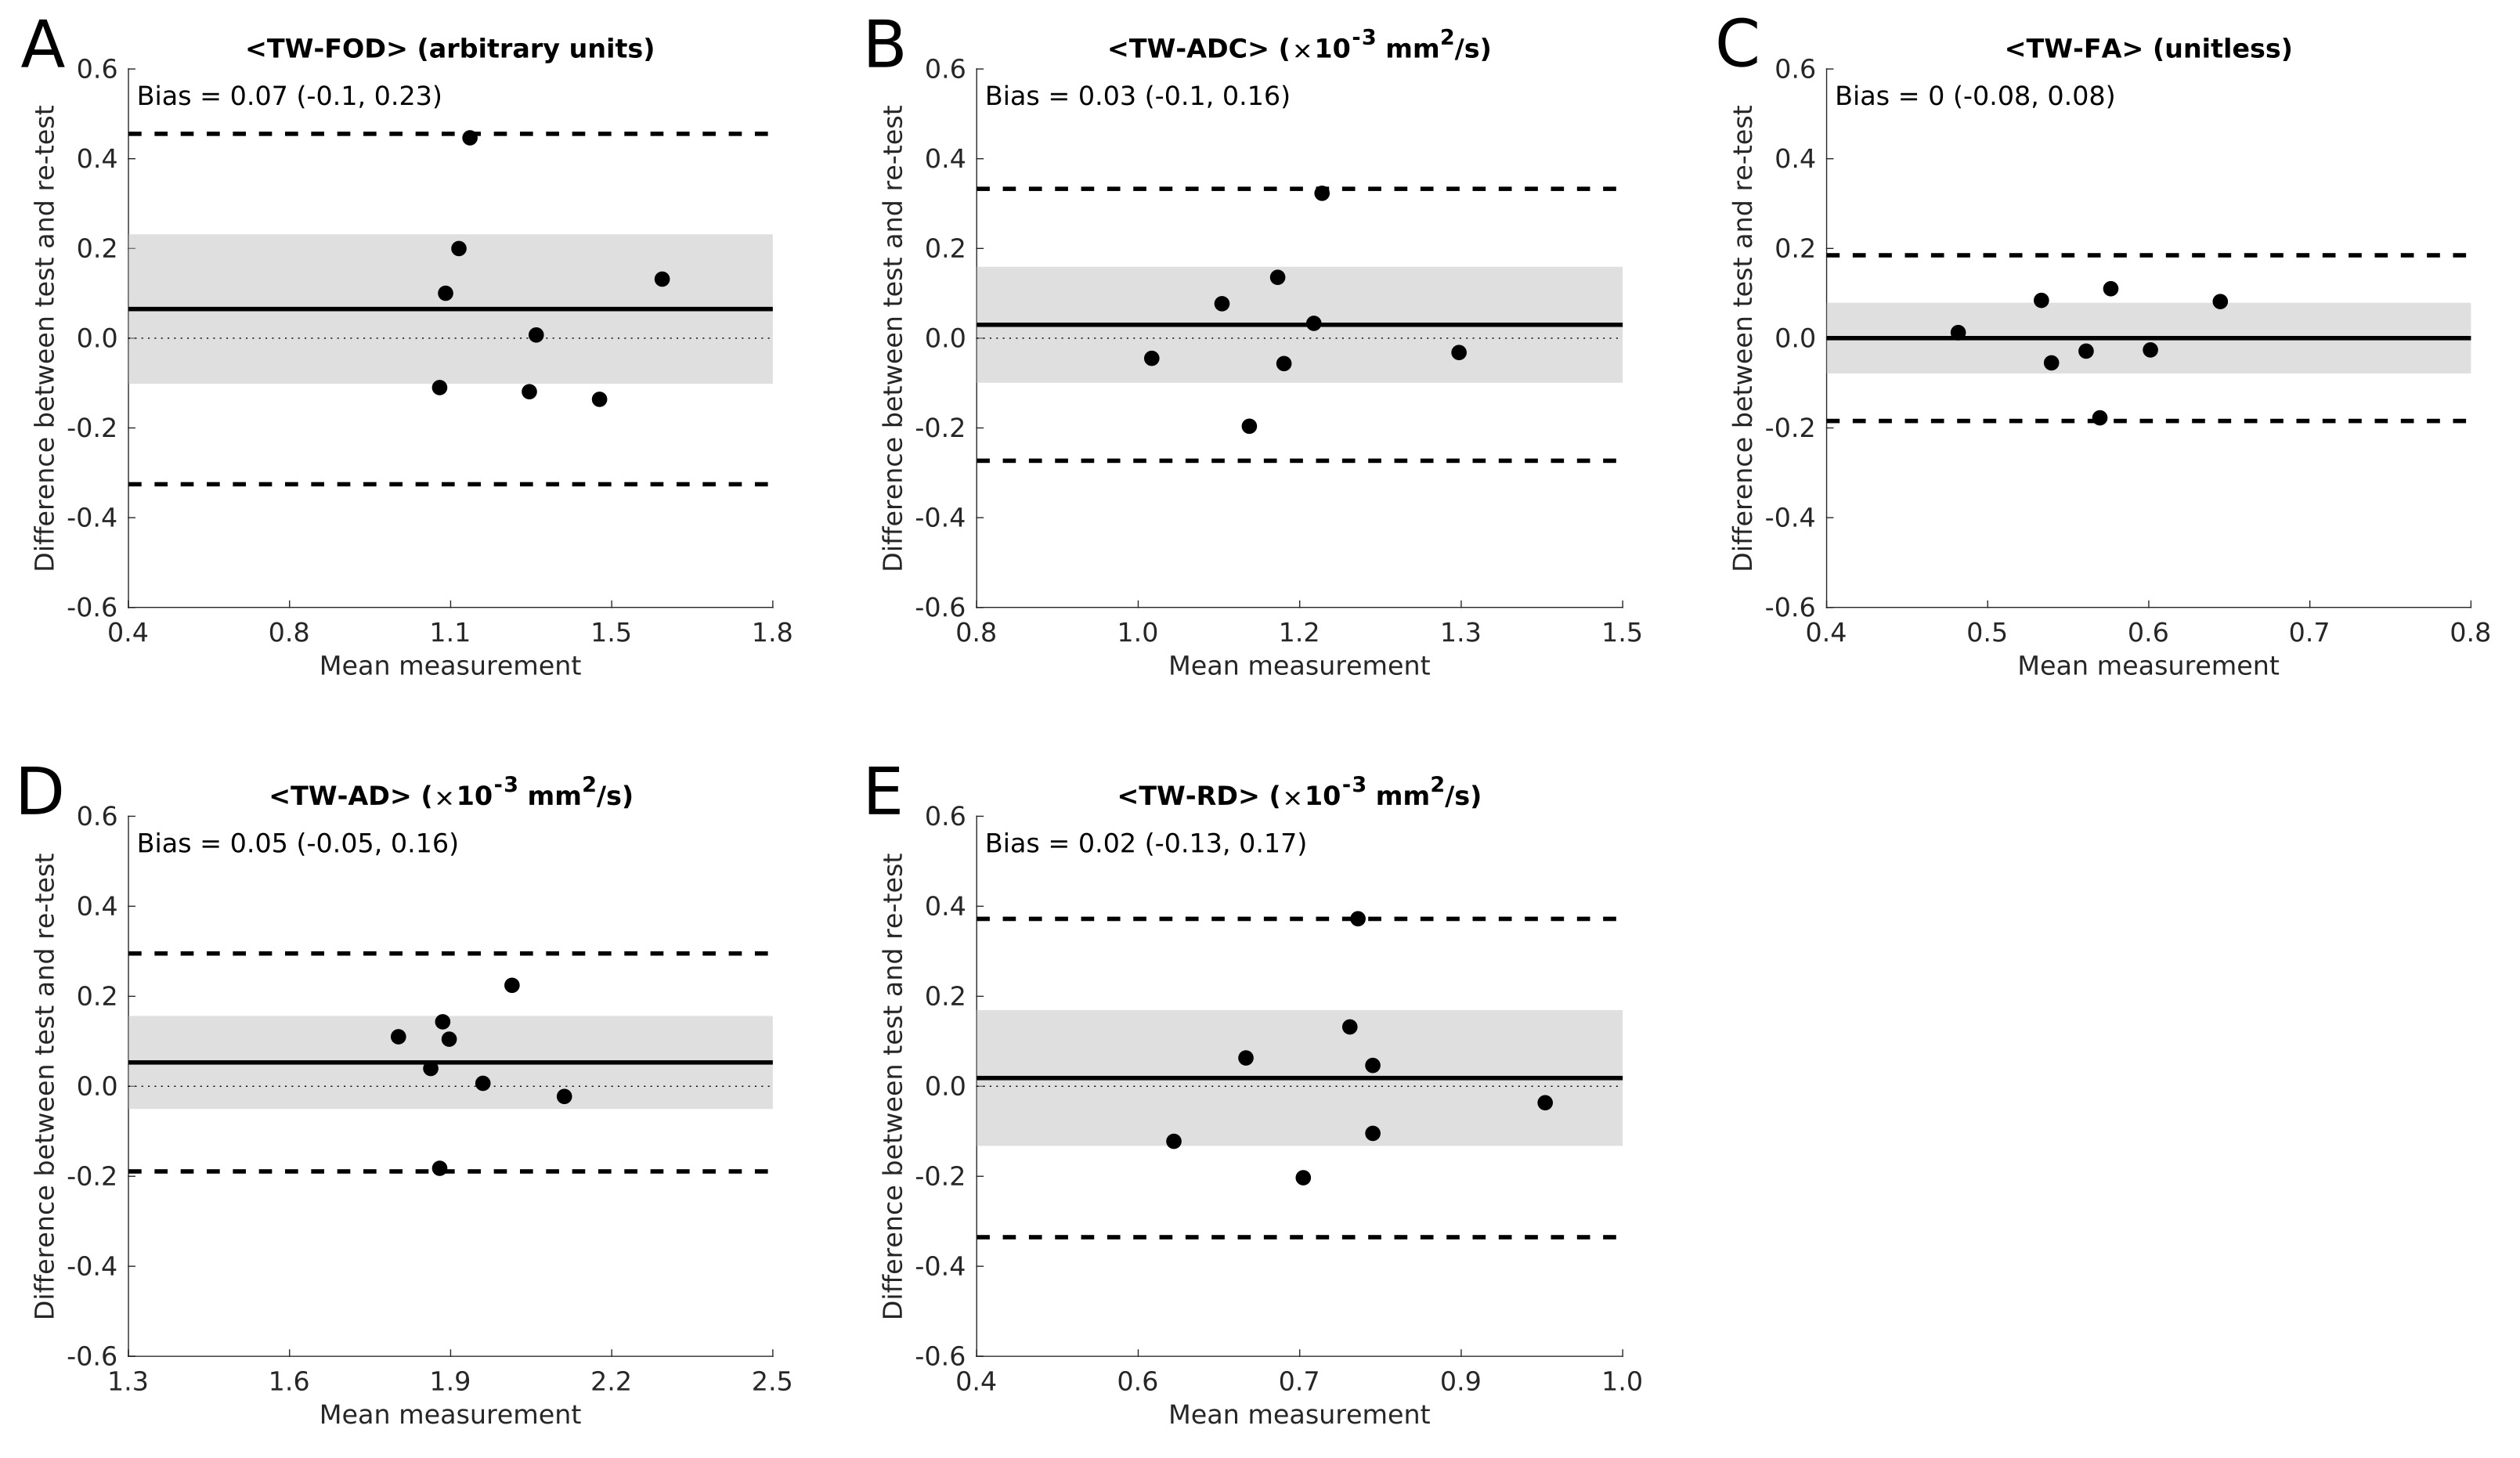
Test and re-test measurements
There was no significant bias between test and re-test measurements (Figure 4). Variability analysis CVBS and CVWS were similar for each tensor-based track-weighted measurement (Table 1), although TW-AD had lower CVBS and CVWS values (~5%). For TW-FOD, CVBS was larger than CVWS (Table 1).
Number of subjects per group
A sample size of 22 would be sufficient to detect a 10% difference between groups for all track-weighted measurements (Table 1).
Minimum detectable percentage changes
For a sample size of 20, it would be possible to detect group differences as small as ~4% (Table 1), and it would be possible to detect differences between test and re-test measurements as small as ~3% (Table 1).
Discussion
Here we present a processing pipeline for diffusion MRI data that exploits the benefits of state-of-the-art analysis methods. This included modelling local fibre architecture using FODs9, accounting for partial volume effect between different components in the tissue10, a probabilistic fibre-tracking algorithm11, assigning weights to each streamline to make the tractogram quantitative12, computing metrics from super-resolution TWI3, and assessing both the along-nerve and nerve-averaged metrics. These methods were used to reconstruct and measure the following metrics in the ulnar nerve: TW-FOD, TW-ADC, TW-FA, TW-AD and TW-RD.While standard tensor metrics were also quantified in the proposed framework (Figure 1A), we do not report standalone tensor metrics, and instead report track-weighted metrics, which were shown to have improved reproducibility6. Here we also provide measurements of TW-FOD, which, to the best of our knowledge, is a novel diffusion metric in the context of peripheral nerve imaging. The FOD is related to the intracellular volume13, and TW-FOD can therefore provide a useful complementary marker. When an observed change is greater than PC (Table 1), the observation is not likely to be due to acquisition and/or postprocessing errors. It follows that the framework herein can be used to distinguish nerve adaptation provided that the adaptation is accompanied by a change in the track-weighted measurement at least comparable to that shown in Table 1. Such tables should therefore provide useful information for prospective planning of studies to be well powered. While not shown, the framework has also been successfully implemented to study the median nerve.
Conclusion
State-of-the-art diffusion analysis tools were used to reconstruct and quantify the ulnar nerve of the forearm and provide quantitative data to guide power calculations of future studies. The proposed framework may have high clinical value given that it could be used to monitor the progression of neurodegeneration with an unprecedented level of detail.Acknowledgements
No acknowledgement found.References
1.Jeon T, Fung MM, Koch KM, Tan ET, Sneag DB. Peripheral nerve diffusion tensor imaging: Overview, pitfalls, and future directions. J Magn Reson Imaging. 2018;47(5):1171-1189.
2.Calamante F. The Seven Deadly Sins of Measuring Brain Structural Connectivity Using Diffusion MRI Streamlines Fibre-Tracking. Diagnostics (Basel, Switzerland). 2019;9(3):115.
3.Calamante F. Track-weighted imaging methods: extracting information from a streamlines tractogram. Magnetic Resonance Materials in Physics, Biology and Medicine. 2017;30(4):317-335.
4.Tournier J-D, Smith R, Raffelt D, et al. MRtrix3: A fast, flexible and open software framework for medical image processing and visualisation. NeuroImage. 2019;202:116137.
5.Tournier J-D, Calamante F, Connelly A. MRtrix: Diffusion tractography in crossing fiber regions. International Journal of Imaging Systems and Technology. 2012;22(1):53-66.
6.Willats L, Raffelt D, Smith RE, Tournier JD, Connelly A, Calamante F. Quantification of track-weighted imaging (TWI): Characterisation of within-subject reproducibility and between-subject variability. NeuroImage. 2014;87:18-31.
7.Van Belle G, Martin DC. Sample Size as a Function of Coefficient of Variation and Ratio of Means. The American Statistician. 1993;47(3):165-167.
8.Van Belle G. In: Statistical Rules of Thumb. John Wiley and Sons Inc., ; 1998:27-51.
9.Tournier JD, Calamante F, Connelly A. Robust determination of the fibre orientation distribution in diffusion MRI: non-negativity constrained super-resolved spherical deconvolution. NeuroImage. 2007;35(4):1459-1472.
10.Jeurissen B, Tournier J-D, Dhollander T, Connelly A, Sijbers J. Multi-tissue constrained spherical deconvolution for improved analysis of multi-shell diffusion MRI data. NeuroImage. 2014;103:411-426.
11.Tournier JD, Calamante F, Connelly A. Improved probabilistic streamlines tractography by 2nd order integration over fibre orientation distributions. Paper presented at: Proceedings of the international society for magnetic resonance in medicine2010.
12.Smith RE, Tournier J-D, Calamante F, Connelly A. SIFT2: Enabling dense quantitative assessment of brain white matter connectivity using streamlines tractography. NeuroImage. 2015;119:338-351.
13.Raffelt D, Tournier JD, Rose S, et al. Apparent Fibre Density: a novel measure for the analysis of diffusion-weighted magnetic resonance images. NeuroImage. 2012;59(4):3976-3994.
Figures