3462
Spinal cord perfusion mapping using Intra-Voxel Incoherent Motion at 3T in healthy individuals and Degenerative Cervical Myelopathy patients1CRMBM, Aix-Marseille University, CNRS, Marseille, France, 2CEMEREM, APHM, Hopital Universitaire Timone, Marseille, France, 3iLab-Spine International Research Laboratory, Marseille-Montreal, France, 4Spinal Cord Injury Center, University Hospital Balgrist, University of Zurich, Zurich, Switzerland, 5Max Planck Institute for Human Cognitive and Brain Sciences, Leipzig, Germany, 6Wellcome Trust Centre for Neuroimaging, UCL Institute of Neurology, London, United Kingdom
Synopsis
In the search for a technique to assess spinal cord perfusion, the Intra-Voxel Incoherent Motion technique, previously implemented at 7T, was adapted to 3T. B-values were optimized based on phantom acquisitions. The final protocol was applied within 11 healthy volunteers and 2 Degenerative Cervical Myelopathy patients. The technique demonstrated sensitivity to perfusion in healthy volunteers and to capillary network orientations, with a clear depiction of the gray matter perfusion and inter-slice reproducibility. No significant difference could be shown between healthy volunteers and patients given the small sample size but more patients will be included in the near future.
Introduction
Spinal cord (SC) perfusion assessment techniques are critically lacking compared to methods available for brain exams. Yet, there is a pressing need as early detection of hypoperfusion would be a driving factor in the prevention of tissue neurodegeneration in SC injuries1–5.Intra-Voxel Incoherent Motion (IVIM) at 7T has recently shown potential to map perfusion on a group-averaged basis6. Nevertheless, SC imaging at 3T benefits from more matured equipment such as coils with anterior and posterior elements and inner field-of-view sequences, both essential to mitigate artifacts in Echo-Planar Imaging. Moreover, field inhomogeneities and physiological noise are significantly reduced, T1 is shorter7,8 and T2* longer9. The application of IVIM at 3T would have great potential given the larger availability of such systems in clinics compared to 7T. This work aims to assess the sensitivity to perfusion that can be obtained at 3T in healthy controls (HCs) and in Degenerative Cervical Myelopathy (DCM) patients.
Methods
Acquisition optimization.The protocol was adapted on a Prisma 3T system employing the 2D-RF spin-echo EPI sequence ZoomIt (Siemens Healthcare, Germany) with 0.9×0.9mm2 in-plane resolution and 34×108 matrix.The highest b-value $$$b_{max}$$$ to include in the protocol was determined such that the diffusion and perfusion contributions could be disentangled from each other while preserving a sufficient Signal-to-Noise ratio (SNR) to reliably estimate the diffusion coefficient D. Repeated acquisitions (Nrepetitions=20) were performed in an ultrasound gel phantom in three orthogonal directions: anteroposterior (A-P), right-left (R-L) and inferosuperior (I-S). D was estimated independently based on each b-value and the two previous ones, for every repetition. The Coefficient-Of-Variation across repetitions ($$$COV=\frac{standard-deviation(D)_{repetitions}}{mean(D)_{repetitions}}$$$) was used as a measure of reliability of the estimation. The threshold COV≤50% was chosen to define $$$b_{max}$$$ (Fig.1). Additionally, simulations with expected IVIM values6 were used to verify that the distance between $$$b_{max}$$$ and the threshold b-value where the perfusion-related signal represents less than 1% of the total signal was large enough to allow the diffusion effect to be disentangled from the perfusion effect.
In-vivo acquisitions.Based on these optimizations, the b-value distribution was defined from 0 to 650s/mm2 with increment 50s/mm2 (lowest b-value allowed by the sequence) with 20 repetitions/b-value to maximize SNR while limiting acquisition time to 30min, including the 3 diffusion-encoding directions, divided into forward (posterior>anterior) and reversed (anterior>posterior) phase-encoded acquisitions to further correct for distortions. B-values were acquired in a repeating series to mitigate potential B0 drift effects along the acquisition.
The protocol was applied to 11 HCs (27.6±2.6 y/o) and 2 DCM patients (65.5±3.5 y/o). Compared to the 7T protocol6, nine slices with 0.5mm-gap could be acquired covering C1 to C3 levels for all subjects.
Data processing.A similar pipeline as in reference6 was used:
- Denoising10 and Gibbs artifact removal11,12 (DIPY13)
- Motion correction (ANTs14)
- Distortion correction (FSL Topup15)
- Voxel-wise fitting (IVIM-toolbox, https://github.com/slevyrosetti/ivim-toolbox) of the IVIM model: $$$Signal=Signal_{b=0}e^{-bD}(f_{IVIM}e^{-bD^*}+1-f_{IVIM})$$$, with fIVIM the microvascular volume fraction, D* the perfusion-related coefficient16
- Template17/atlas18 registration (SpinalCordToolbox_v.4.319) based on the transversal anatomic image (MEDIC) for GM segmentation20
- Parameter values extraction within regions of interest, excluding voxels at the cord periphery corrupted by partial voluming with cerebrospinal fluid.
Results & Discussion
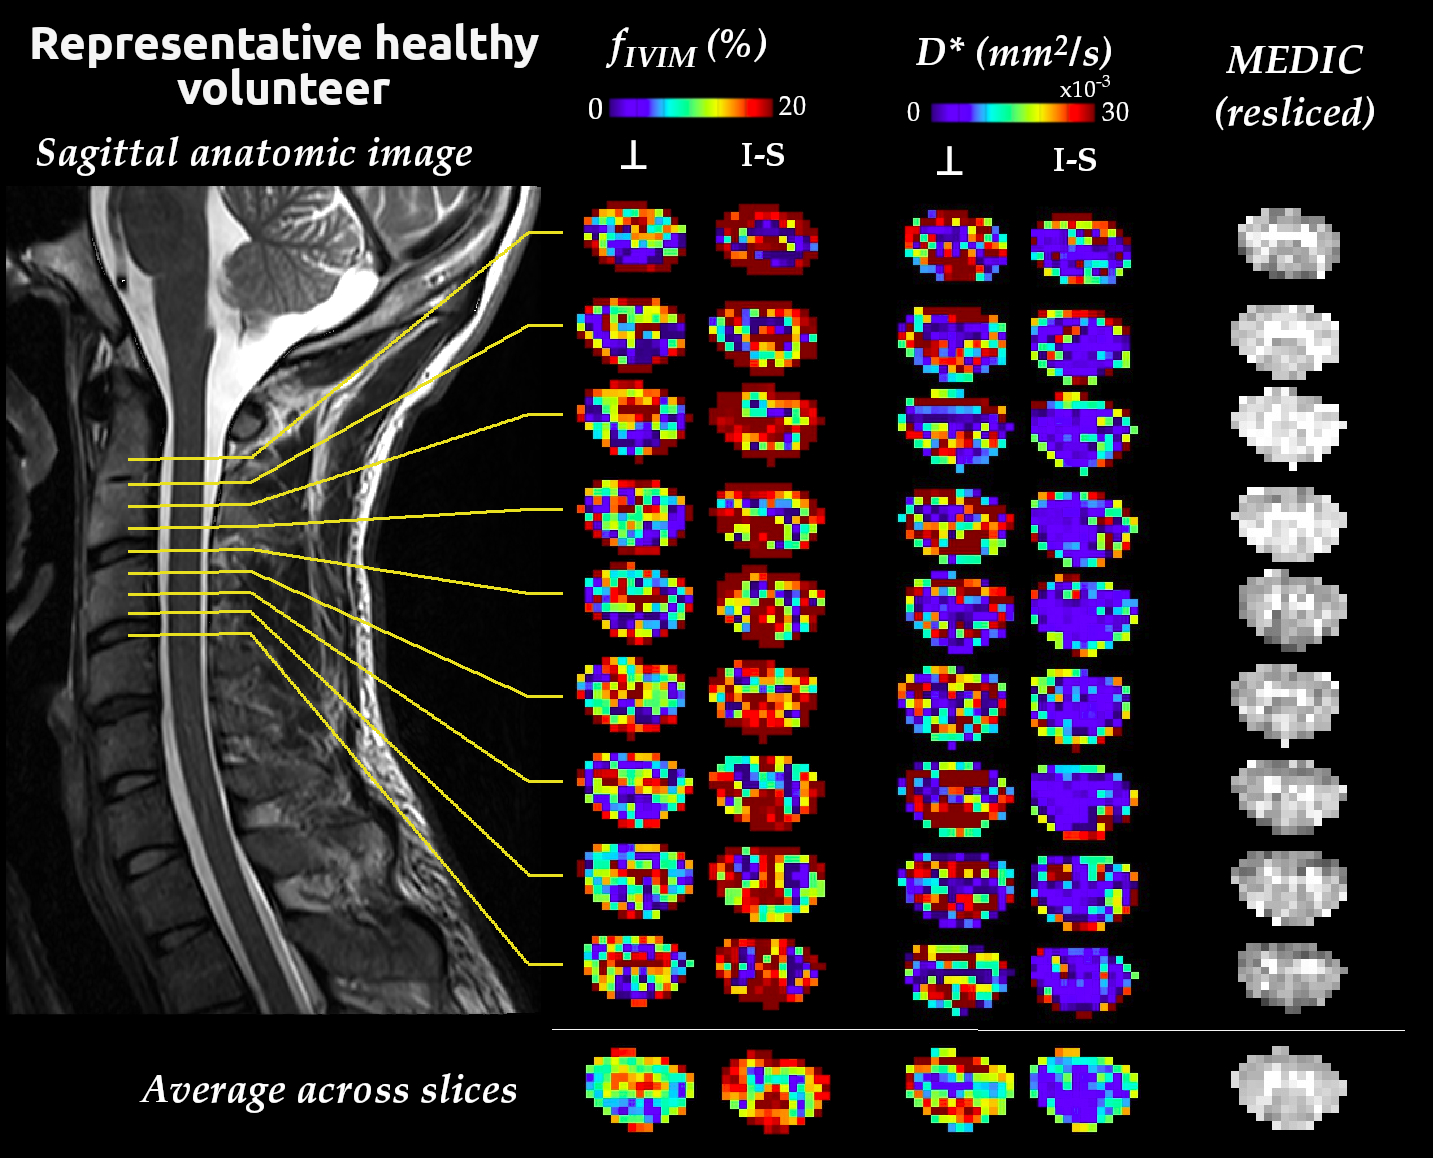
The Coefficient-Of-Variation exceeded 50% for b-values>650s/mm2 and perfusion contribution to the signal dropped below 1% from b-values≥300s/mm2 (Fig.1). In addition to the determination of $$$b_{max}$$$, phantom data showed no artificial IVIM effects that could have been introduced by the sequence (fIVIM=0).Average IVIM maps in HCs clearly identified the higher perfusion of GM compared to WM (Fig.2), consistently with literature21,22 and previous findings6,23. Different distributions were obtained depending on the diffusion-encoding direction, showing a sensitivity to the capillary network orientation. The blood would flow faster (D*) in regions with smaller microvascular volume (fIVIM), such as WM, and conversely. However, for I-S diffusion encoding, estimated fIVIM values in WM were much higher than expected according to available microangiography data21. This could be explained by the high diffusivity in WM along the SC, which results in signal near the noise floor limit at high b-values and biases the estimation24. Taking into account the relaxation rates differences between blood and tissue in the model25 would help reduce this overestimation.
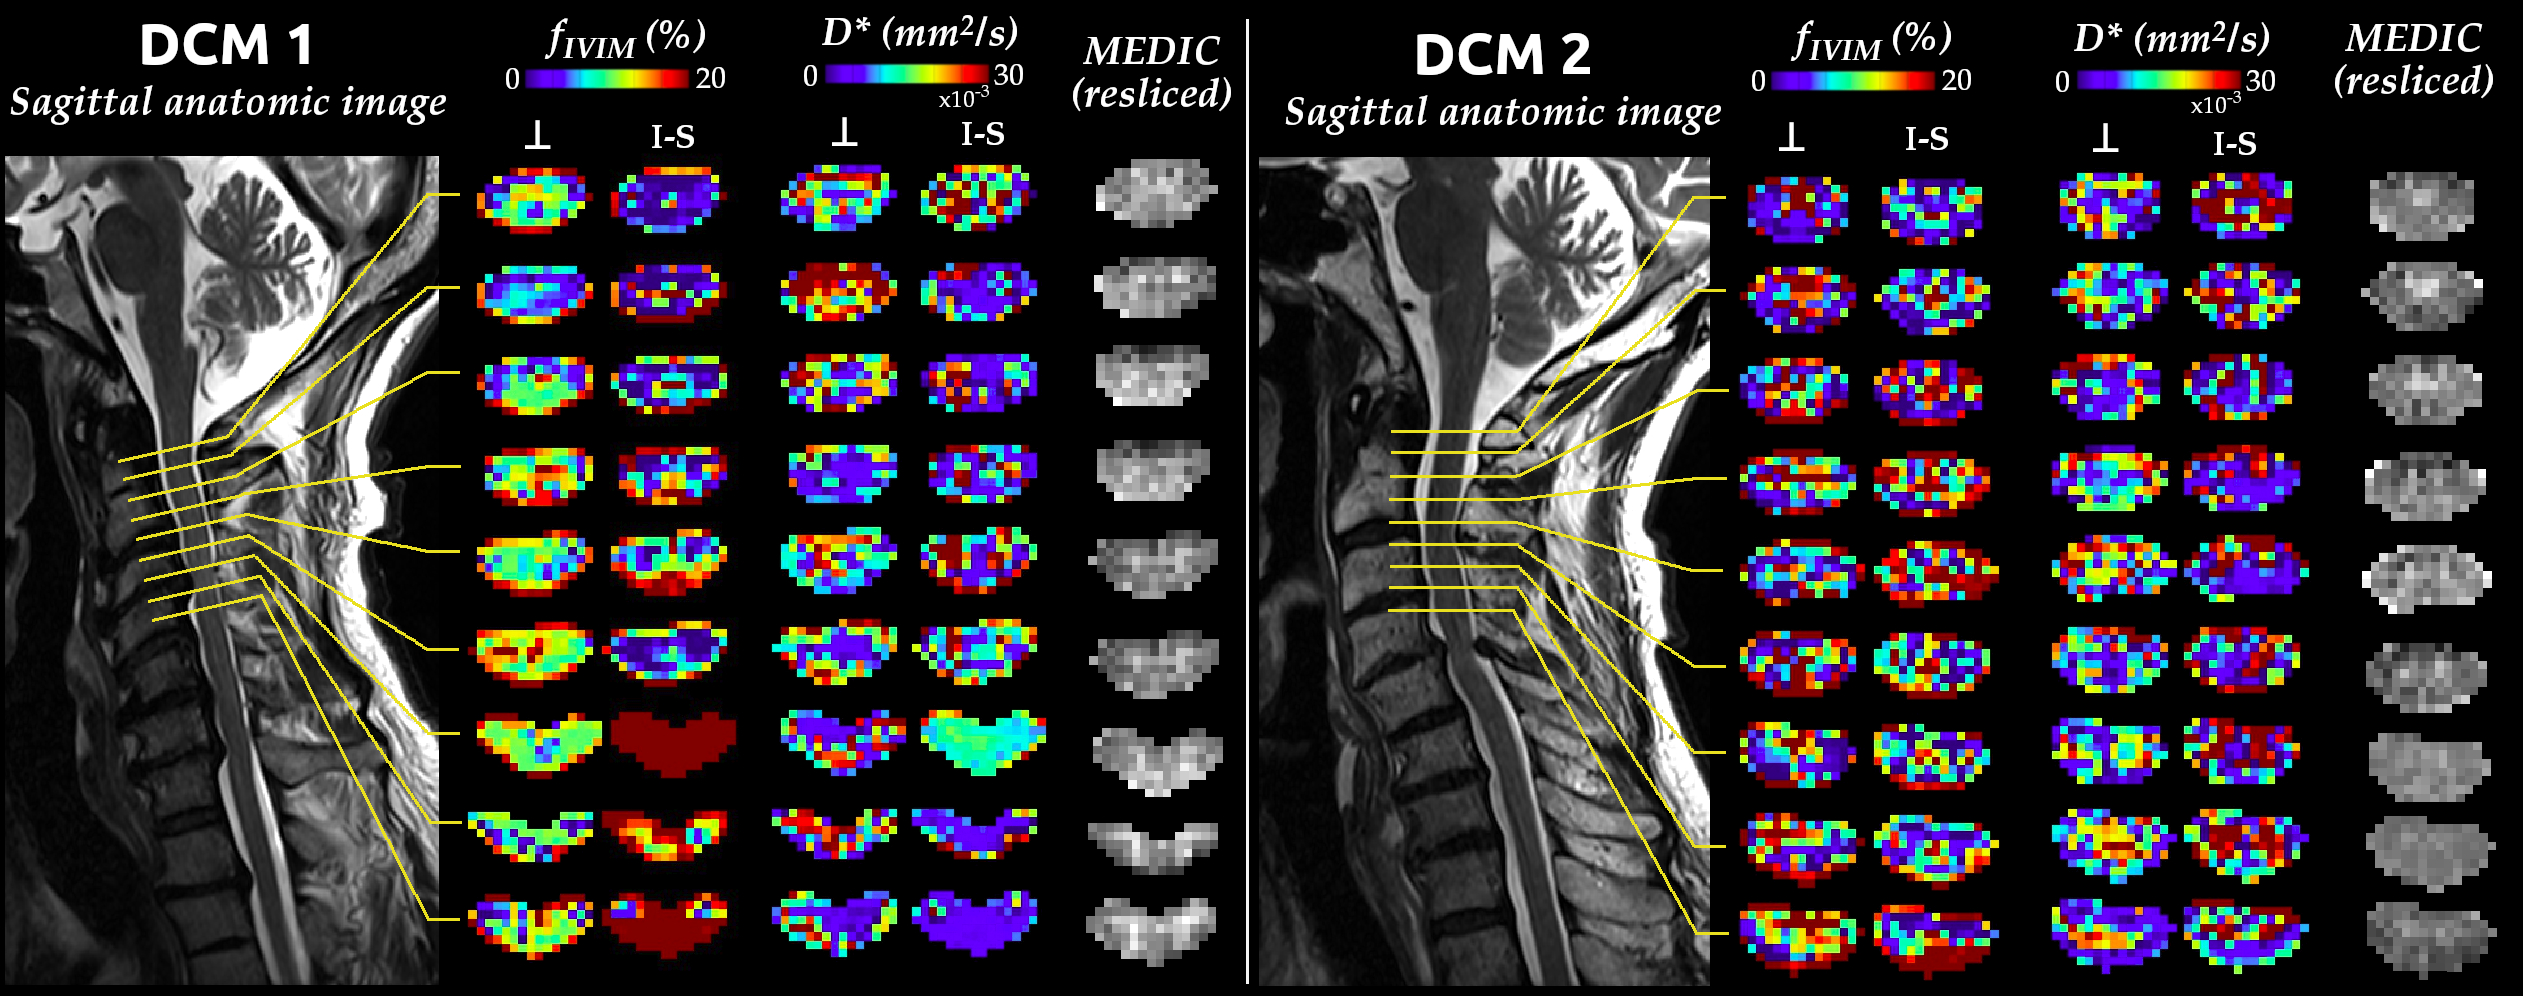
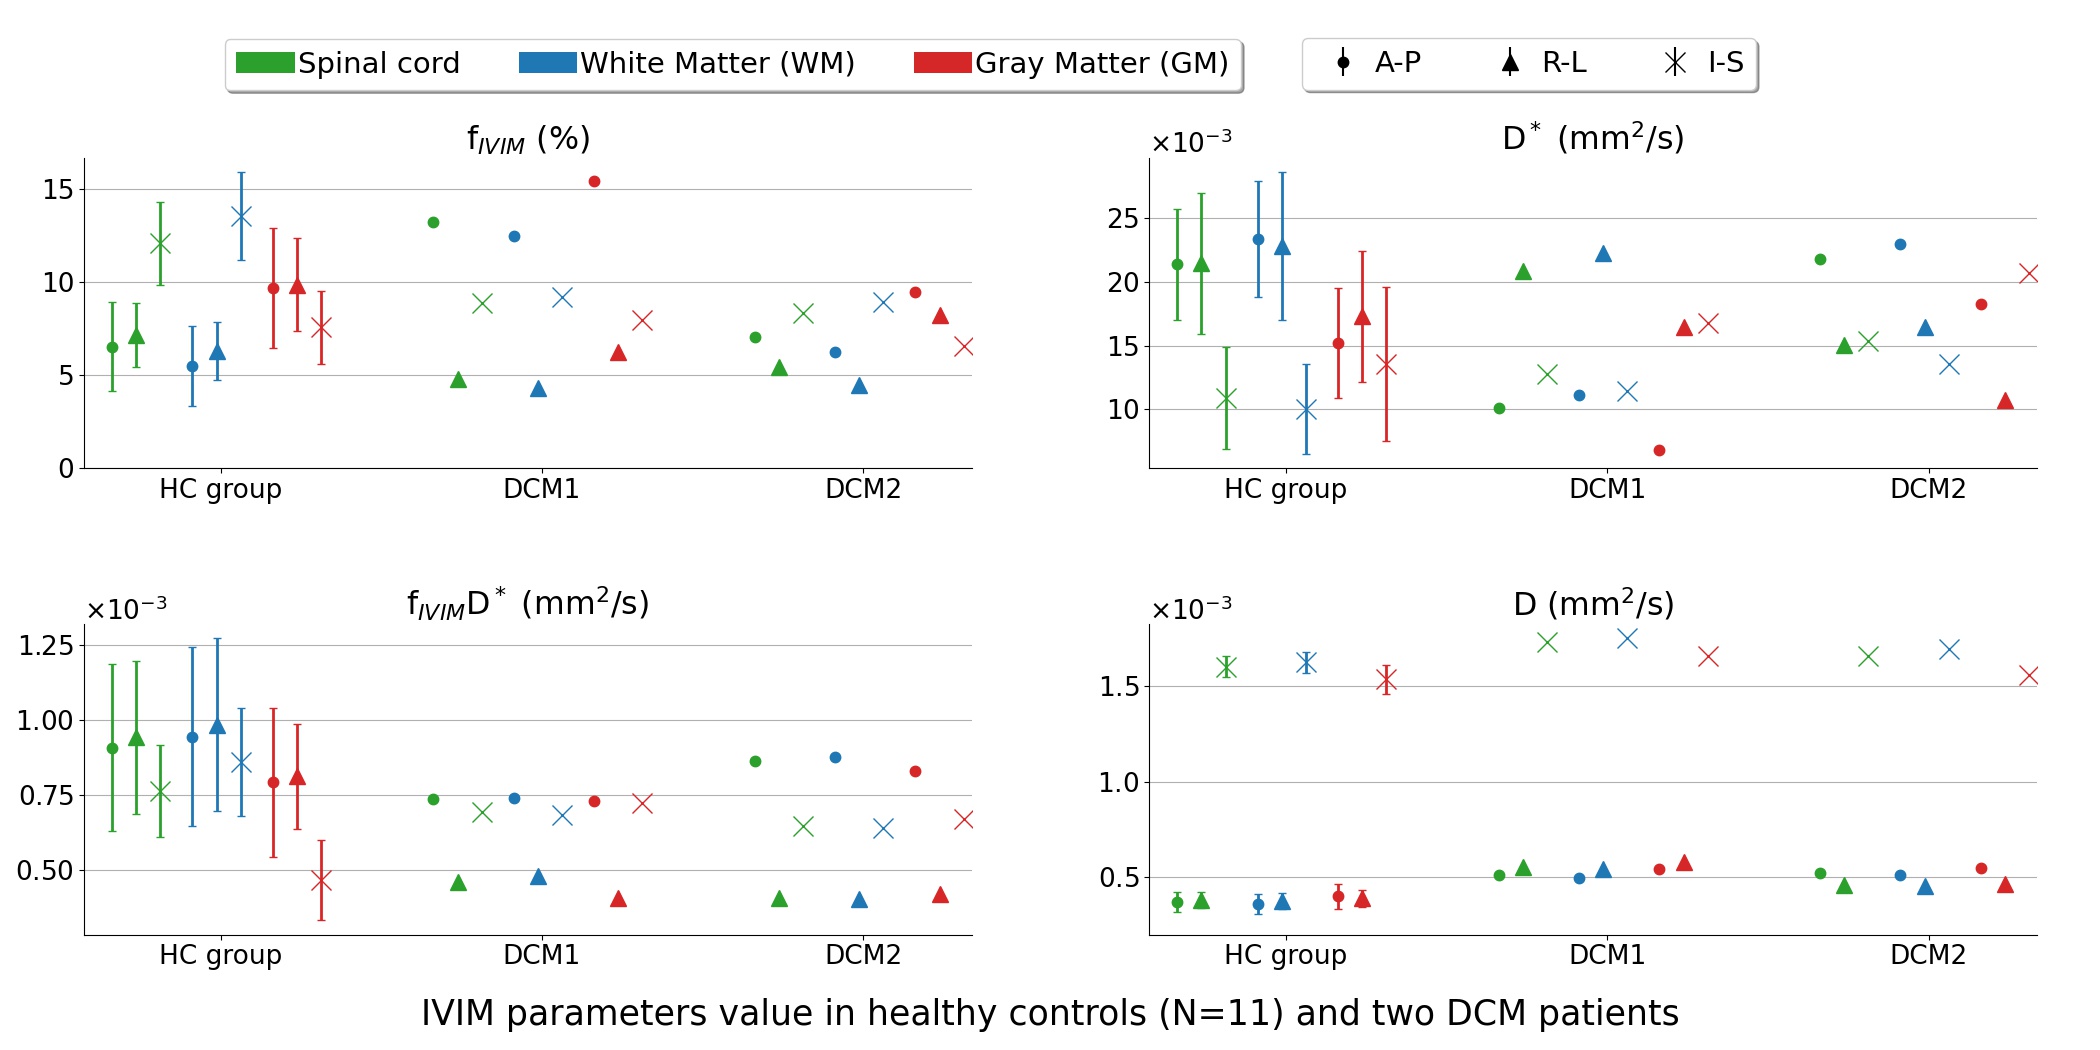
fIVIM maps showed sufficient slice-wise reliability and inter-slice reproducibility to discriminate between WM and GM perfusion on a single-subject basis (Fig.3). D* reliability was more limited, as commonly observed26. In DCM patients (Fig.4), maps near compression sites suggested a larger blood volume (fIVIM,⊥, fIVIM,I-S in DCM1 and fIVIM,I-S in DCM2) but slower blood speed in the transverse plane (D*⊥ in DCM1). Further validation is warranted as the cerebrospinal fluid pulsatility and increased pressure at compression sites could bias the parameters estimation. Finally, the large standard-deviation across HCs and small sample size so far did not allow any significant difference to be shown between HCs and patients (Fig.5).
Conclusion & Perspectives
Sensitivity to GM/WM perfusion and SC capillary network orientations were obtained with a better reliability than previous work at 7T6 , especially on the single-subject and single-slice basis. However, IVIM parameters estimation along the spine is compromised by the high diffusivity. Finally, more patients data are needed to conclude on the reliability of the technique in pathological cases.Acknowledgements
The authors would like to sincerely thank all the participants of this study.References
1. Schubert M. Natural Course of Disease of Spinal Cord Injury. In: Weidner N, Rupp R, Tansey KE, eds. Neurological Aspects of Spinal Cord Injury. Springer International Publishing; 2017:77-105. doi:10.1007/978-3-319-46293-6_4
2. Gilmor ML, Rouse S, Heilman CJ, Nash N, Levey A. Receptor fusion proteins and analysis. In: Ariano M, ed. Receptor Localization. Vol 19. WILEY; 1998:75-90.
3. Kalsi-Ryan S, Karadimas SK, Fehlings MG. Cervical Spondylotic Myelopathy: The Clinical Phenomenon and the Current Pathobiology of an Increasingly Prevalent and Devastating Disorder. The Neuroscientist. 2012;19(4):409-421. doi:10.1177/1073858412467377
4. Beattie MS, Farooqui AA, Bresnahan JC. Review of Current Evidence for Apoptosis After Spinal Cord Injury. J Neurotrauma. 2000;17(10):915-925. doi:10.1089/neu.2000.17.915
5. Shuman SL, Bresnahan JC, Beattie MS. Apoptosis of microglia and oligodendrocytes after spinal cord contusion in rats. J Neurosci Res. 1997;50:798-808.
6. Lévy S, Rapacchi S, Massire A, et al. Intravoxel Incoherent Motion at 7 Tesla to quantify human spinal cord perfusion: Limitations and promises. Magn Reson Med. Published online February 14, 2020:mrm.28195. doi:10.1002/mrm.28195
7. Smith SA, Edden RAE, Farrell JAD, Barker PB, Van Zijl PCM. Measurement of T1 and T2 in the cervical spinal cord at 3 tesla. Magn Reson Med. 2008;60(1):213-219. doi:10.1002/mrm.21596
8. Massire A, Taso M, Besson P, Guye M, Ranjeva J-P, Callot V. High-resolution multi-parametric quantitative magnetic resonance imaging of the human cervical spinal cord at 7T. NeuroImage. 2016;143:58-69. doi:10.1016/j.neuroimage.2016.08.055
9. Peters AM, Brookes MJ, Hoogenraad FG, et al. T2* measurements in human brain at 1.5, 3 and 7 T. Magn Reson Imaging. 2007;25(6):748-753. doi:10.1016/j.mri.2007.02.014
10. Manjón JV, Coupé P, Concha L, Buades A, Collins DL, Robles M. Diffusion Weighted Image Denoising Using Overcomplete Local PCA. PLOS ONE. 2013;8(9):e73021. doi:10.1371/journal.pone.0073021
11. Kellner E, Dhital B, Kiselev VG, Reisert M. Gibbs-ringing artifact removal based on local subvoxel-shifts. Magn Reson Med. 2016;76(5):1574-1581. doi:10.1002/mrm.26054
12. Perrone D, Aelterman J, Pižurica A, Jeurissen B, Philips W, Leemans A. The effect of Gibbs ringing artifacts on measures derived from diffusion MRI. NeuroImage. 2015;120:441-455. doi:10.1016/j.neuroimage.2015.06.068
13. Garyfallidis E, Brett M, Amirbekian B, et al. Dipy, a library for the analysis of diffusion MRI data. Front Neuroinformatics. 2014;8. doi:10.3389/fninf.2014.00008
14. Avants BB, Tustison NJ, Song G, Cook PA, Klein A, Gee JC. A reproducible evaluation of ANTs similarity metric performance in brain image registration. NeuroImage. 2011;54:2033-2044. doi:http://dx.doi.org/10.1016/j.neuroimage.2010.09.025
15. Andersson JLR, Skare S, Ashburner J. How to correct susceptibility distortions in spin-echo echo-planar images: application to diffusion tensor imaging. NeuroImage. 2003;20(2):870-888. doi:10.1016/S1053-8119(03)00336-7
16. Le Bihan D, Breton E, Lallemand D, Aubin ML, Vignaud J, Laval-Jeantet M. Separation of diffusion and perfusion in intravoxel incoherent motion MR imaging. Radiology. 1988;168(2):497-505. doi:10.1148/radiology.168.2.3393671
17. De Leener B, Fonov VS, Collins DL, Callot V, Stikov N, Cohen-Adad J. PAM50: Unbiased multimodal template of the brainstem and spinal cord aligned with the ICBM152 space. NeuroImage. 2018;165:170-179. doi:10.1016/j.neuroimage.2017.10.041
18. Lévy S, Benhamou M, Naaman C, Rainville P, Callot V, Cohen-Adad J. White matter atlas of the human spinal cord with estimation of partial volume effect. NeuroImage. 2015;119:262-271. doi:10.1016/j.neuroimage.2015.06.040
19. De Leener B, Lévy S, Dupont SM, et al. SCT: Spinal Cord Toolbox, an open-source software for processing spinal cord MRI data. NeuroImage. 2017;145:24-43. doi:10.1016/j.neuroimage.2016.10.009
20. Perone CS, Calabrese E, Cohen-Adad J. Spinal cord gray matter segmentation using deep dilated convolutions. Sci Rep. 2018;8(1):5966. doi:10.1038/s41598-018-24304-3
21. Hassler O. Blood supply to human spinal cord: a microangiographic study. Arch Neurol. 1966;15(3):302-307.
22. Duhamel G, Callot V, Cozzone PJ, Kober F. Spinal cord blood flow measurement by arterial spin labeling. Magn Reson Med. 2008;59:846-854. doi:10.1002/mrm.21567
23. Lévy S, Roche P-H, Guye M, Callot V. Feasibility of human spinal cord perfusion mapping using dynamic susceptibility contrast imaging at 7T: Preliminary results and identified guidelines. Magn Reson Med. 2021;85(3):1183-1194. doi:10.1002/mrm.28559
24. Iima M, Yano K, Kataoka M, et al. Quantitative Non-Gaussian Diffusion and Intravoxel Incoherent Motion Magnetic Resonance Imaging: Differentiation of Malignant and Benign Breast Lesions. Invest Radiol. 2015;50(4):205-211. doi:10.1097/RLI.0000000000000094
25. Lemke A, Laun FB, Simon D, Stieltjes B, Schad LR. An in vivo verification of the intravoxel incoherent motion effect in diffusion-weighted imaging of the abdomen. Magn Reson Med. 2010;64(6):1580-1585. doi:10.1002/mrm.22565
26. Federau C. Intravoxel incoherent motion MRI as a means to measure in vivo perfusion: A review of the evidence. NMR Biomed. 2017;30(11):e3780. doi:10.1002/nbm.3780
Figures
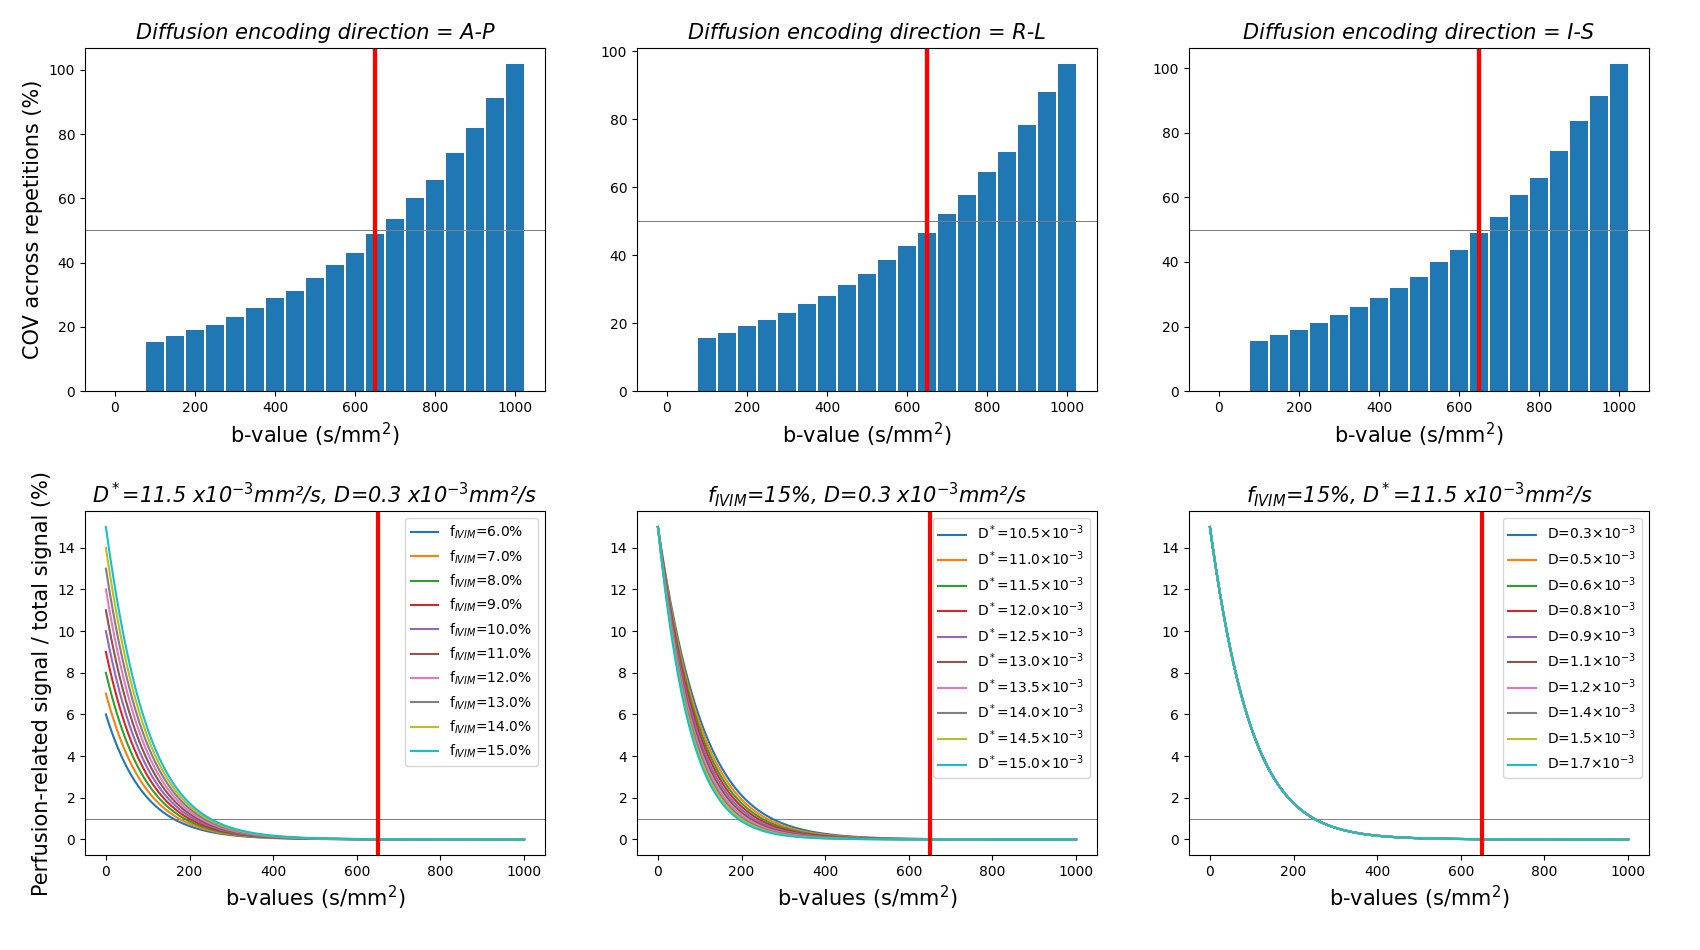
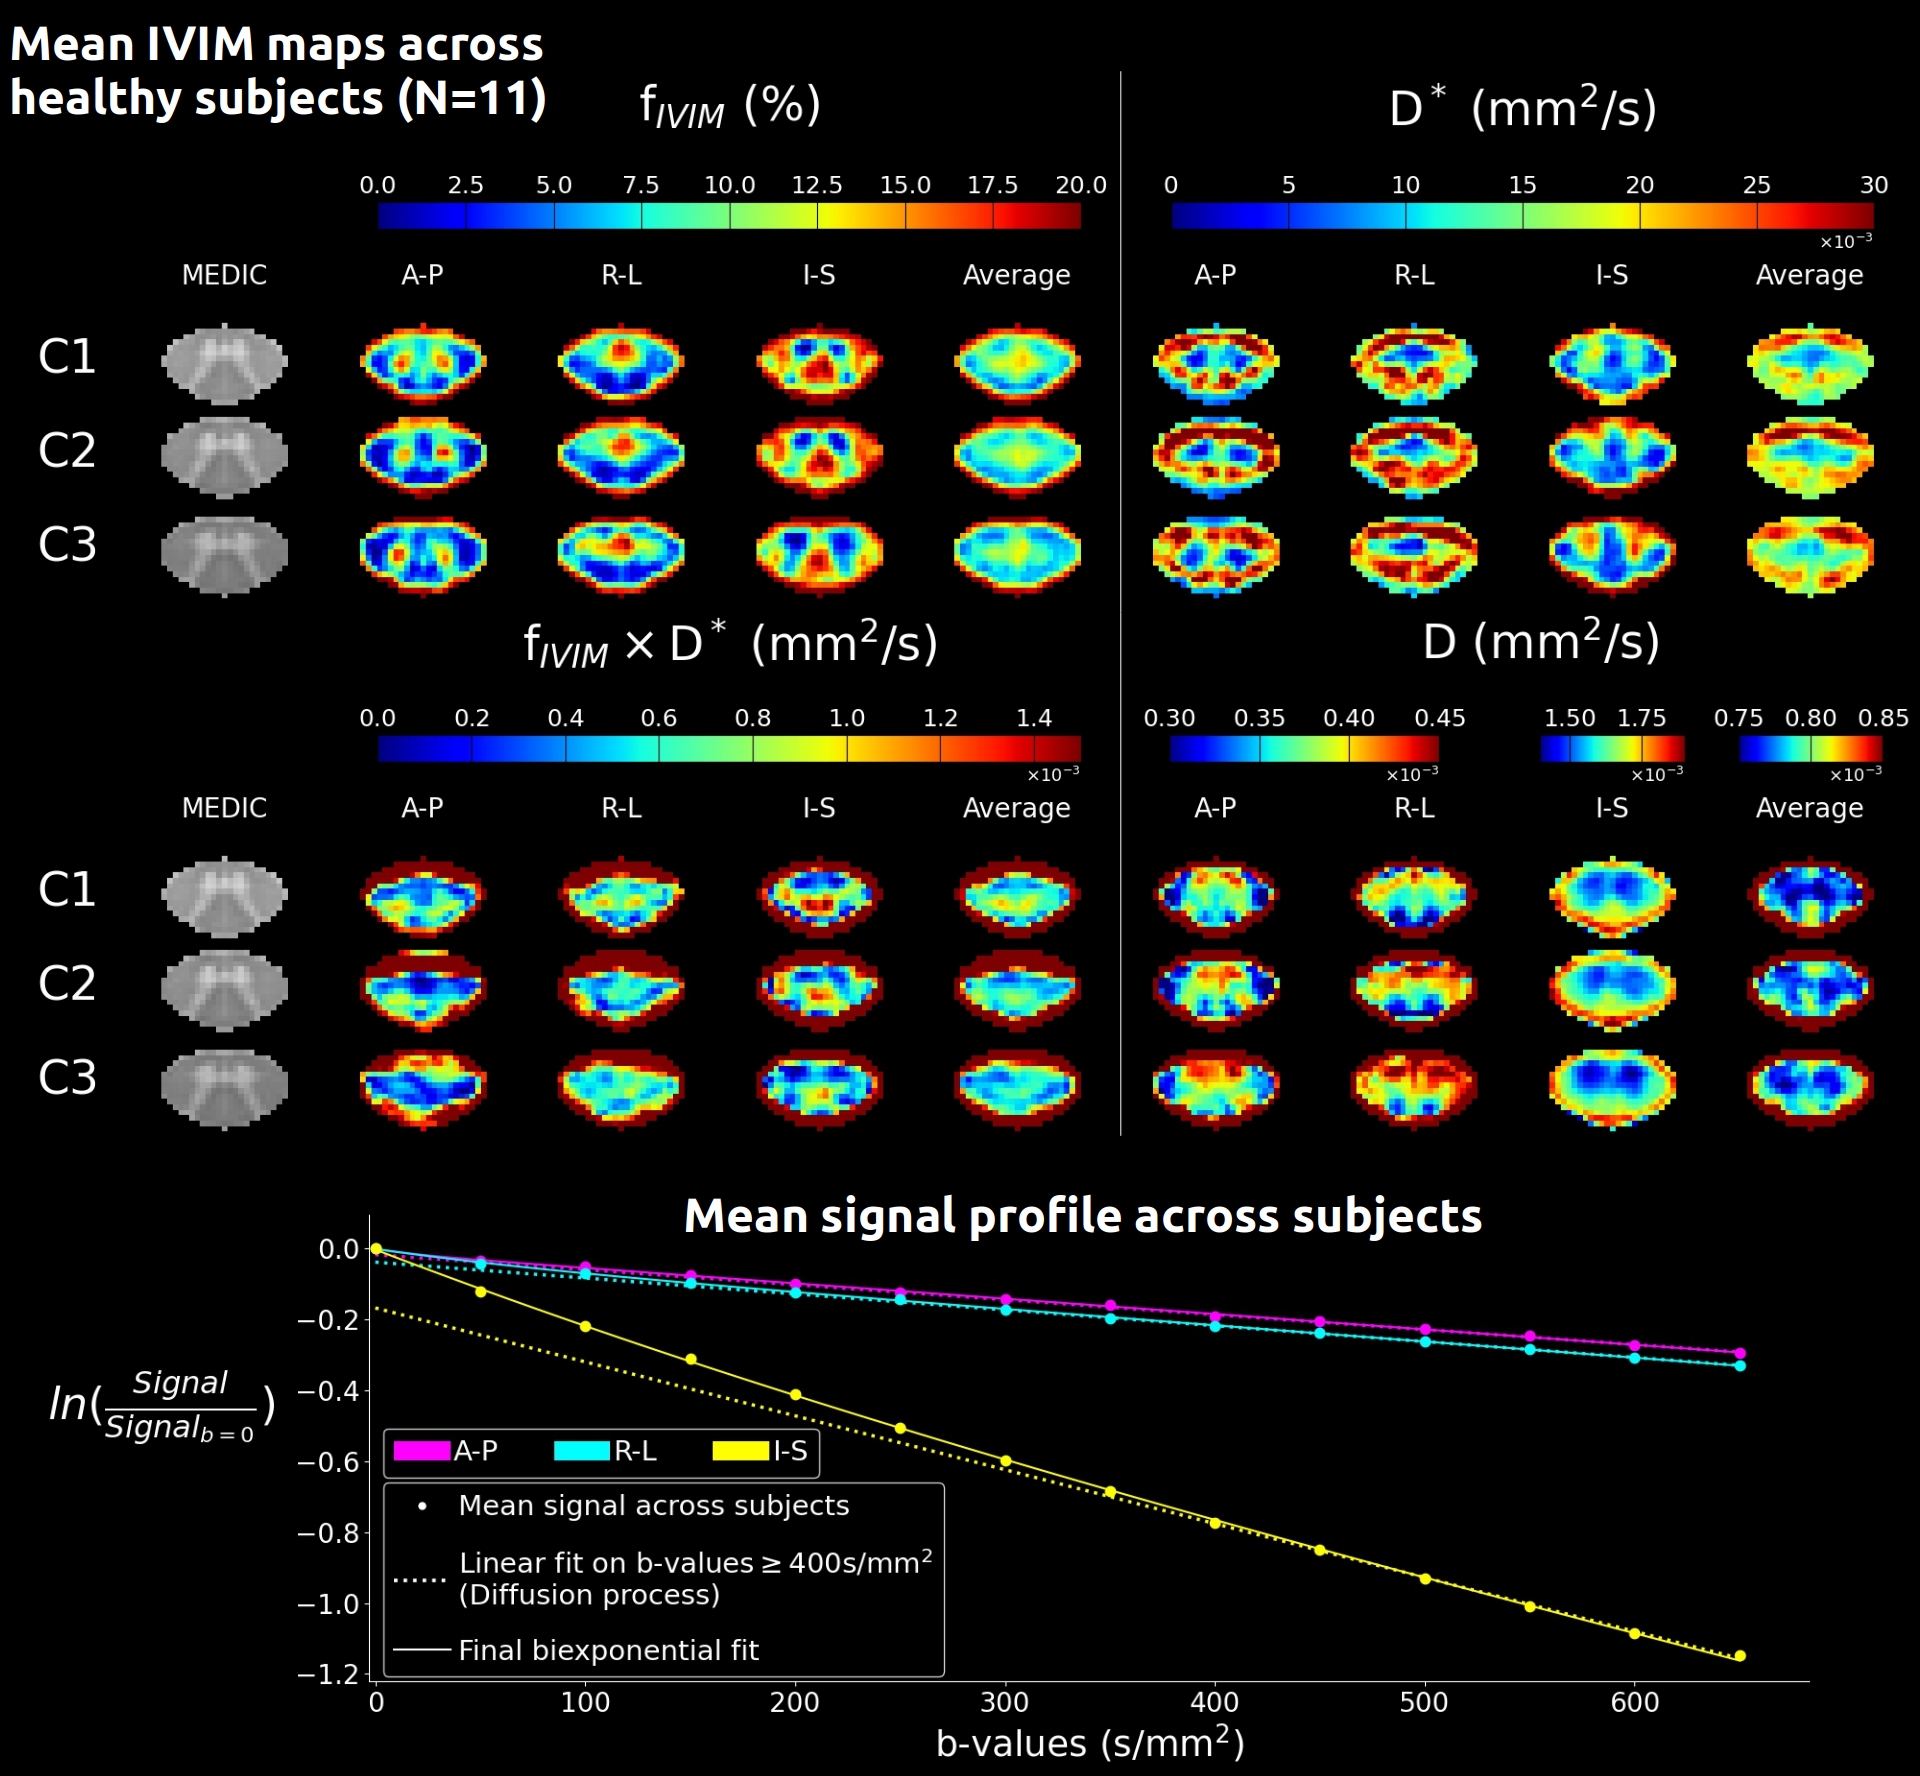
Fig. 2: Mean IVIM parameters maps across HCs (N=11) at mid C1, C2, C3 levels in the template space (0.5mm isotropic, average of 15 slices) for each diffusion-encoding direction (A-P: anteroposterior, R-L: right-left, I-S: inferosuperior) and averaged across directions. The mean MEDIC image across subjects helps visualize GM and evaluate the quality of the template registration. Below, the mean signal profile is shown for each direction. The linear fit on high b-values helps visualize the deviation from the diffusion-only signal decay, illustrating the challenge along the I-S axis.