3459
Clinical Feasibility Study of Accelerated 2D Magnetic Resonance Spinal Imaging Using Compressed Sensing Algorithm1Peking University First Hospital, Beijing, China, 2Philips Healthcare, Beijing, China, Beijing, China
Synopsis
Compressed sensing algorithm (CS-MRI) could accelerate 3D MRI scanning time. In this study, we investigate the feasibility of CS-MRI in 2D spinal MRI. Totally 78 consecutive patients (29, 11 and 38 patients were examined by cervical vertebral, thoracic vertebral, thoracic vertebral MRI protocol respectively) were enrolled for both conventional MRI and CS-MRI. Both qualitative and quantitative analyses were conducted to compare the image quality and lesion diagnosis on conventional MRI and CS-MRI. And our results revealed that CS-MRI was valuable for improving the overall workflow of spinal MRI with scanning time saved and image quality improved.
Backgrounds and Purpose
To evaluate the clinical feasibility of 2D spinal magnetic resonance imaging (MRI) using compressed sensing algorithm (CS-MRI) in comparison with conventional 2D-MRI (Con-MRI).Materials and Methods
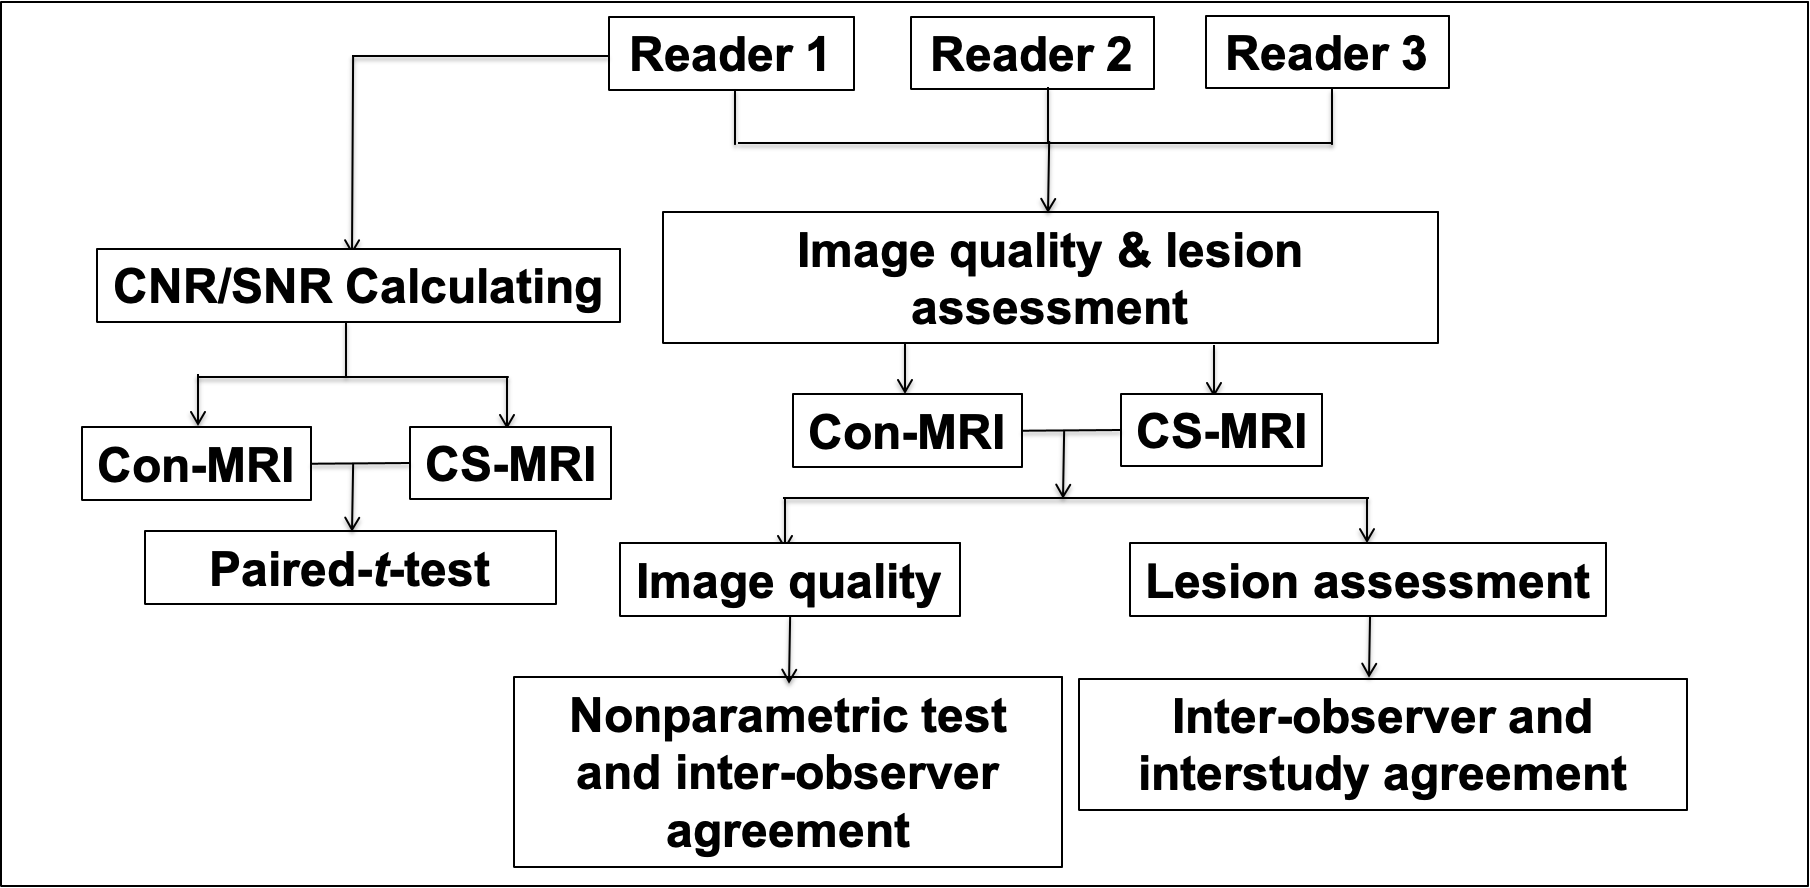
This prospective study was approved by local ethics committee. From August 2020 to November 2020, 78 consecutive patients (42 males, 36 females, mean age: 52±18, age range: 30-81 years) with suspected disease on spinal vertebrae were enrolled. Among them, 29, 11 and 38 patients were examined by cervical vertebral, thoracic vertebral, thoracic vertebral MRI protocol respectively, which included both Con-MRI (Turbo Spin Echo (TSE) for all: Sagittal T1 weighted imaging (T1WI), Sagittal T2 weighted imaging (T2WI) and Axial T2WI) and CS-MRI (with 2.5 factor for acceleration: Sagittal T1WI, Sagittal T2WI and Axial T2WI) for each patient. All MR images were acquired with a 3T MR scanner (Ingenia; Philips, Best, the Netherlands). Three radiologists (21, 13 and 7 years of experience in orthopedic radiology, respectively) independently assessed the image quality with blind to the information of patients’ data. Image quality was rated according to a 5-point Likert scale according to the criteria as following:1) Non-diagnostic image quality due to severe artifacts, image distortion, or poor signal intensity.2) Poor diagnostic image quality and diagnostic confidence of the readers due to severe artifacts, image distortion pronounced, or relatively poor signal intensity.3) Moderate image quality and confidence of the readers due to moderate artifacts, moderate image distortion.4) Good diagnostic image quality: few artifacts, slight image distortion, the main structures were well displayed.5) Excellent image quality: almost no artifacts or imaging distortion; the main structures were perfectly displayed.Both signal-to-noise ratio (SNR) and contrast-to-noise ratio (CNR) for vertebrae, intervertebral discs, spinal code and surrounding soft tissue were assessed for both CS-MRI and Con-MRI. Signal intensity (SI) was measured as following: For cervical MRI, round-shaped regions of interest (ROIs) were placed on the 3rd and 7th vertebral bodies, the intervertebral discs of C3/C4 and C6/C7, cervical enlargement. For thoracic MRI, ROIs were placed on the 4th and 12th vertebral bodies, the intervertebral disc of T8/T9, thoracic cord. For lumbar MRI, ROIs were placed on the 1st and 5th vertebral bodies, the intervertebral discs of L1/L2 and L4/L5, lumbar enlargement. Another round-shaped ROI was placed on the air far away from the spine, to calculate the standard deviation of air as background noise.Three readers assessed them separately in a blinded and randomized fashion. The interobserver and interstudy agreement were assessed for evaluation of lesions with reader 1 as reference, who has more diagnostic experience. The flowchart was seen in Figure 1.Statistical analysis was performed by using statistical software (SPSS, v. 24.0; Chicago, IL). A Kendall W test was performed to assess the interobserver agreement of scores of image quality and lesion diagnosis between readers. A nonparametric test (Wilcoxon test) was performed to compare the image quality between Con-MRI and CS-MRI. For lesion diagnosis, the interobserver agreement betweenreaders and interstudy agreement between Con-MRI and CS-MRI for each observer were evaluated by kappa analysis. Paired t-tests for SNR and CNR calculation were conducted to compare Con- MRI and CS- MRI.Results
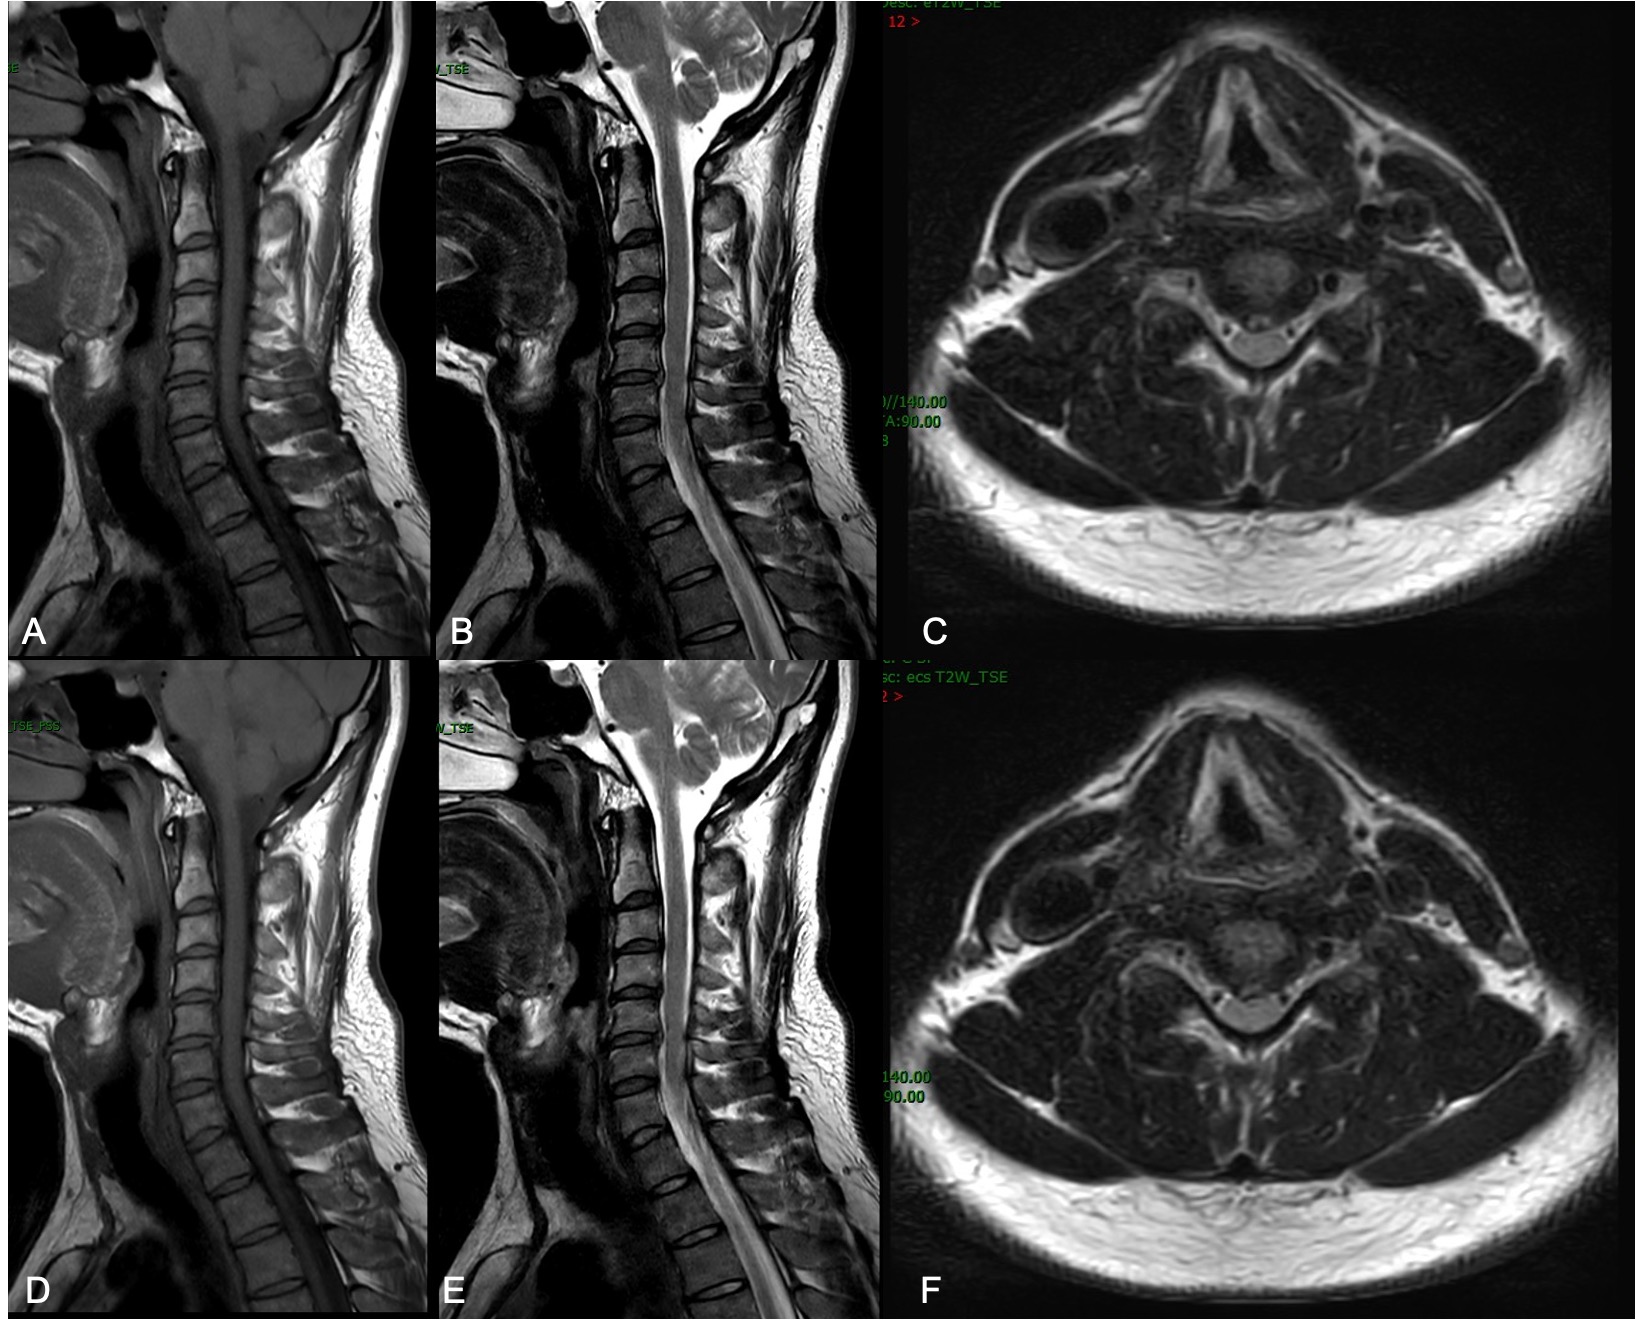
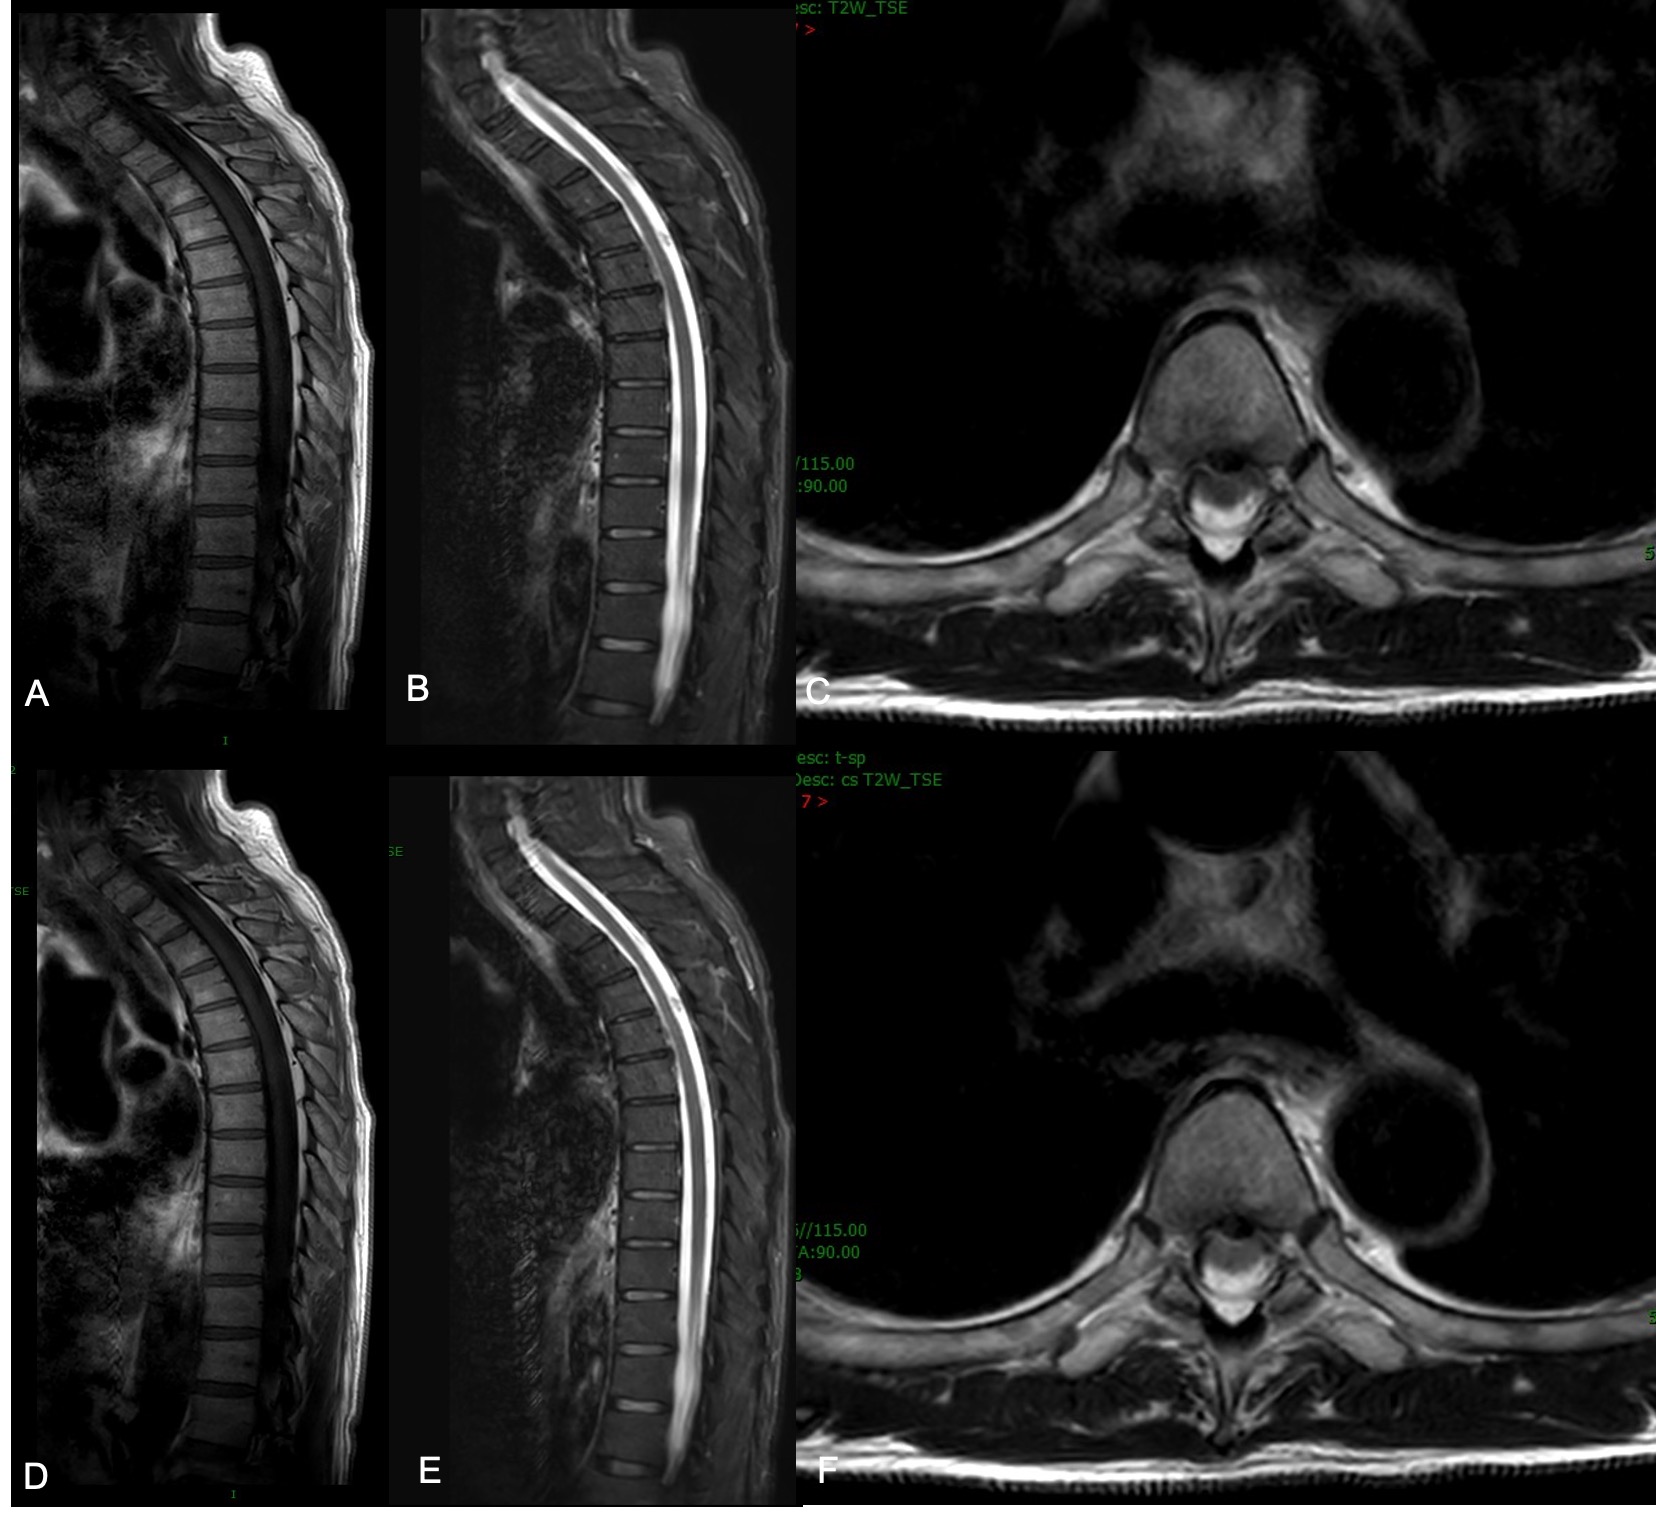
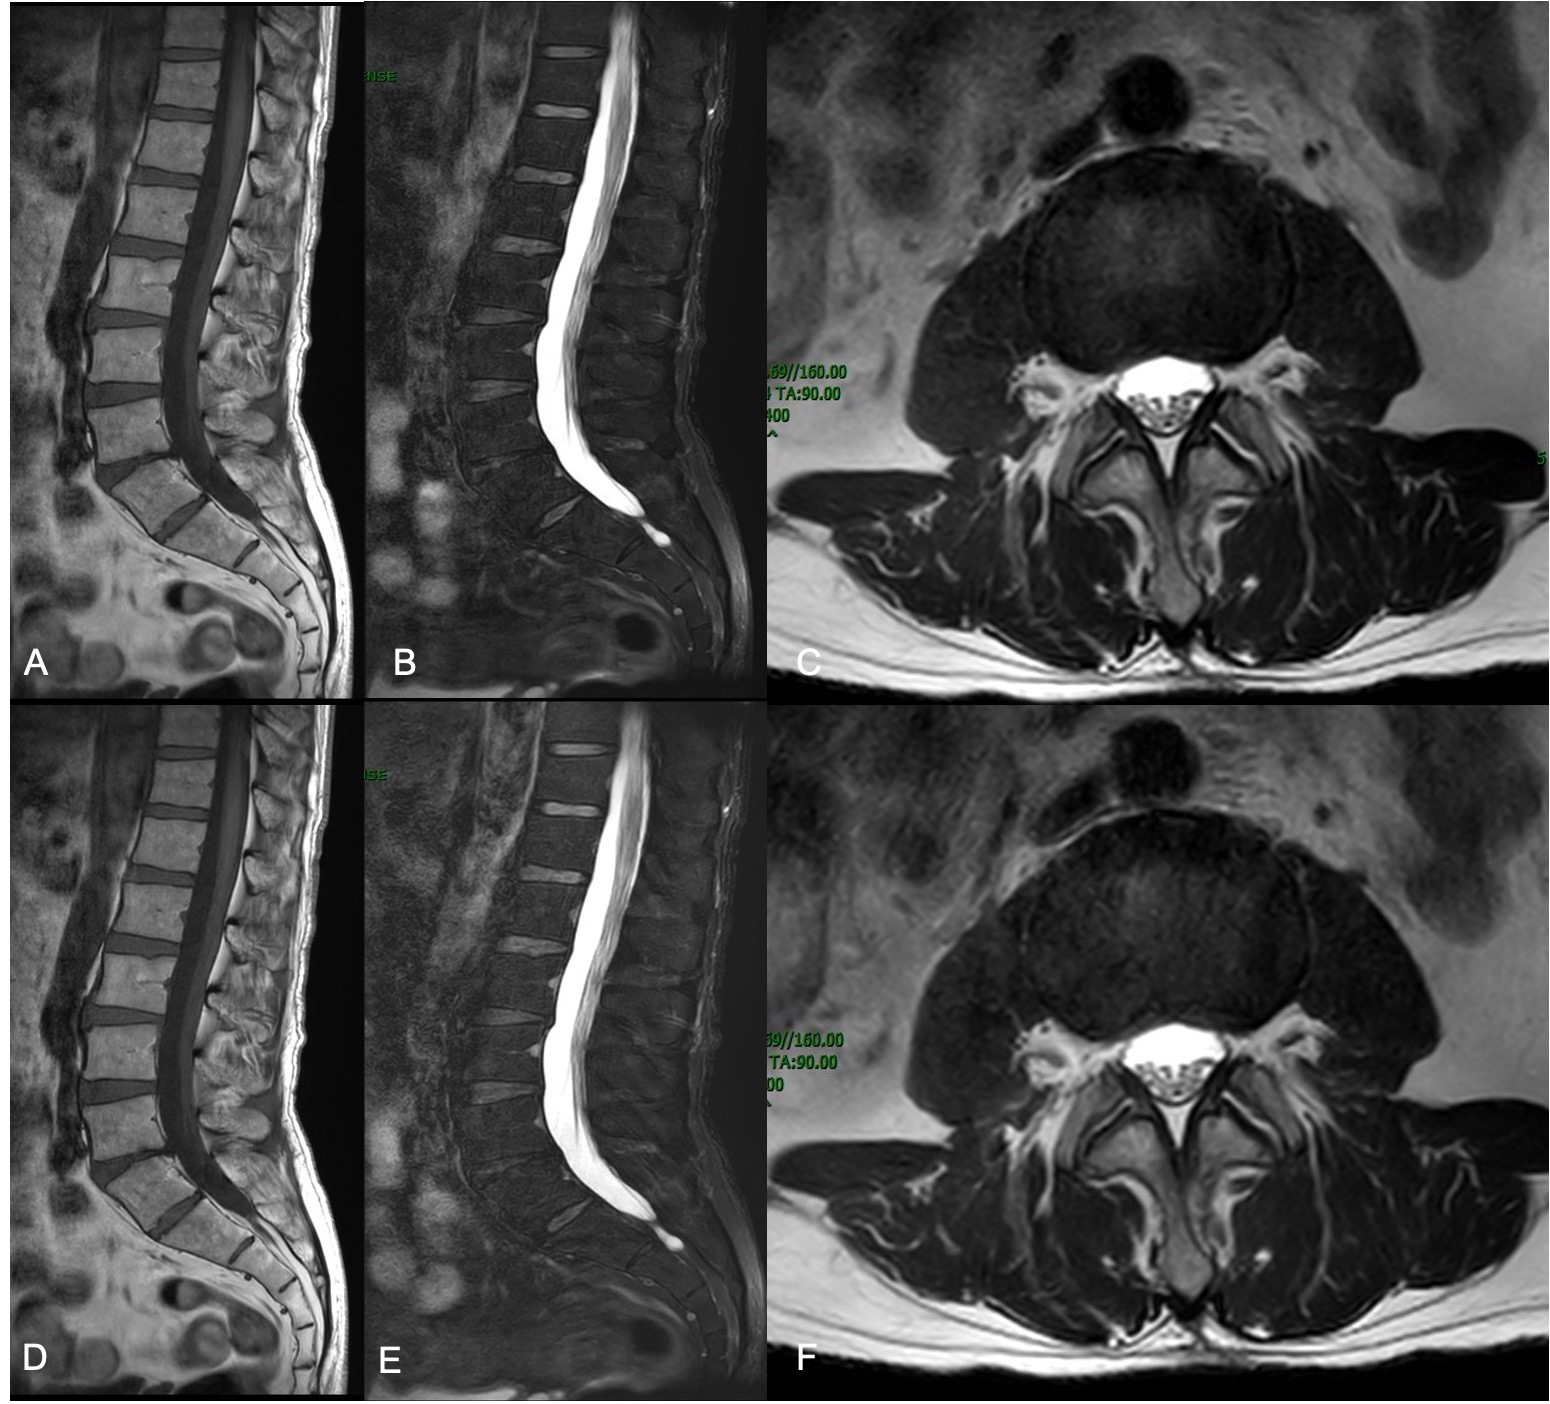
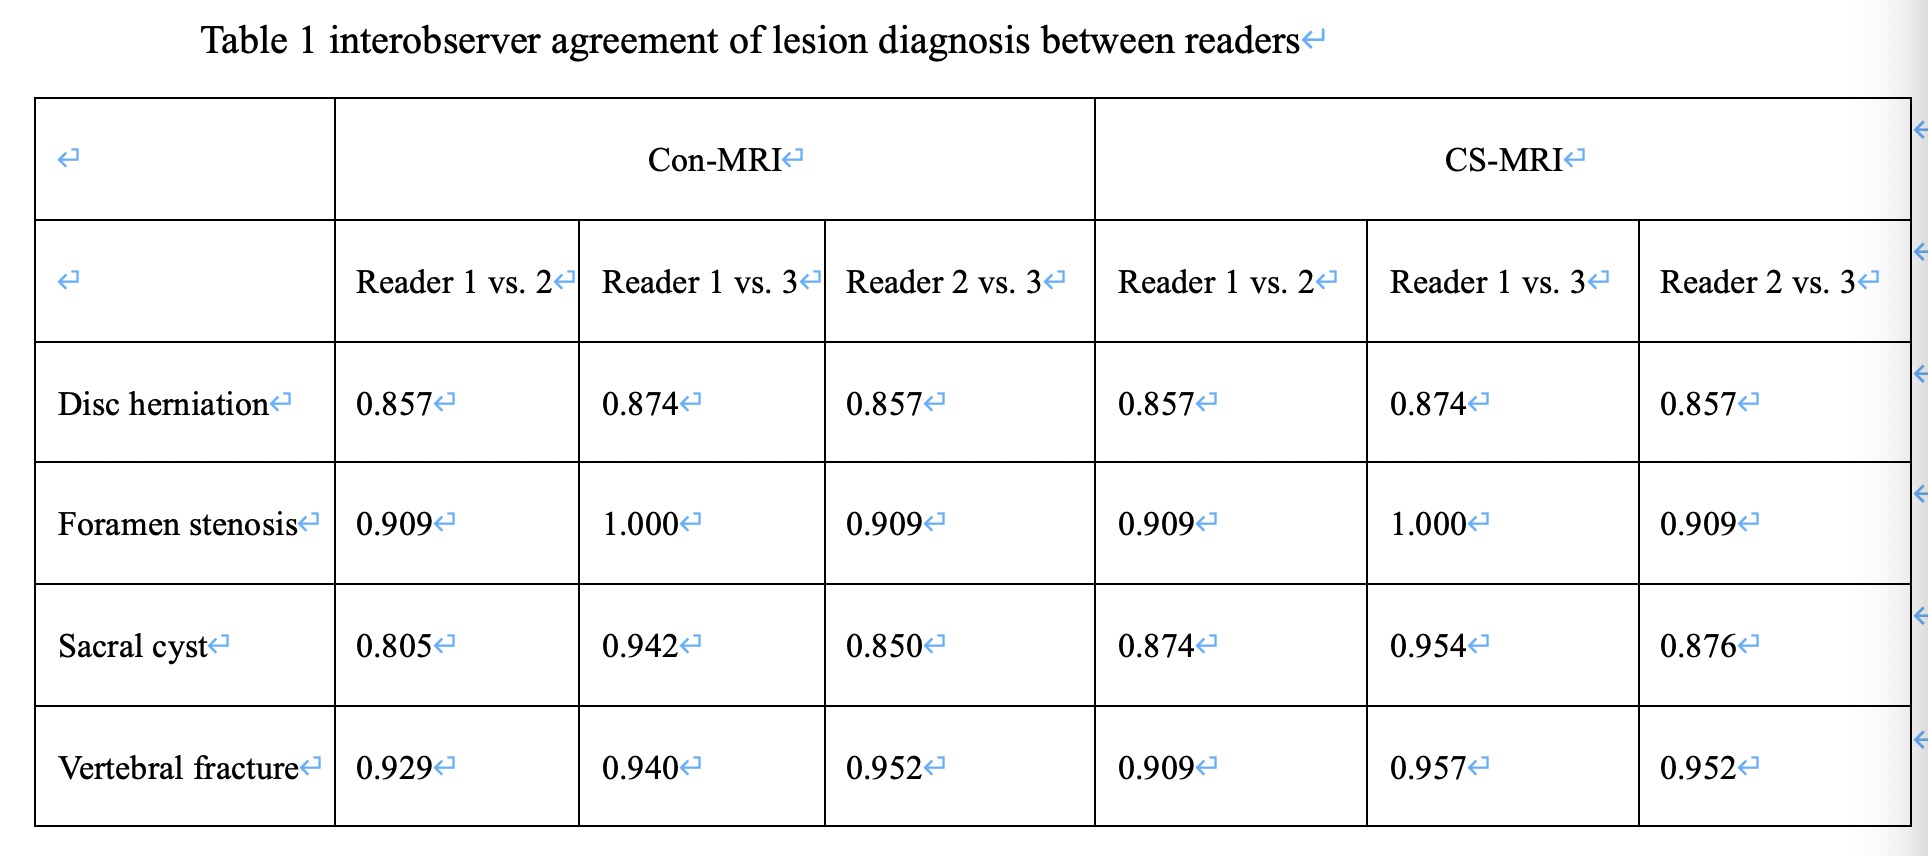
Compared with Con-MRI, we had achieved average 2min14sec, 3min12sec and 2min50sec scan time decrease for cervical vertebra, thoracic vertebra and lumbar vertebra examinations by using CS protocols. Excellent Interobserver agreement was found for image quality on CS-MRI (Kendall W value of 0.879, P < 0.001) and Con-MRI (Kendall W value of 0.926, P < 0.001). The image quality showed no statistical significance between CS-MRI and Con-MRI (the mean scores for CS-MRI of readers 1, 2, and 3 were 4.82±0.44, 4.86 ±0.35, and 4.78±0.47, respectively; for Con-MRI were 4.81 ± 0.53, 4.87 ± 0.58, and 4.76 ± 0.62, respectively) (Z = 3.710, with P = 0.58). Table 1 shows the number of lesions which were diagnosed by readers on the Con-MRI and CS-MRI. There was excellent interobserver agreement in the diagnosis for Con-MRI (Kendall W value of 0.903, P < 0.001) and CS-MRI (Kendall W value of 0.916, P < 0.001). Figures 2-4 display the examples of clear imaging both on Con-MRI and CS-MRI.The paired t-test showed significant variance results between Con-MRI and CS-MRI on sagittal T2W images. The SNRs of vertebrae comparison were: (413.78 ± 70.17) of Con-MRI and (443.71 ± 71.9) of CS-MRI (t = –5.264, P < 0.001). The SNRs of inter-vertebral discs comparison were: (215.15 ± 88.85) of Con-MRI and (250.69 ± 86.35) of CS-MRI (t = –5.395, P < 0.001). The CNRs of vertebrae comparison were: (152.54 ± 54.16) of Con-MRI and (178.64 ± 59.59) of CS-MRI (t = –5.544, P < 0.001). The CNRs of inter-vertebral discs were: (253.17 ± 71.97) of Con-MRI and (285.43 ± 72.61) of CS-MRI (t = –5.658, P < 0.001). There were no significant differences in SNR and CNR on sagittal T1W images and AX T2W images.Conclusion
We demonstrated that compared with Con-MRI, CS-MRI could save scan time significantly without loss of image quality in the routine clinical spinal examinations. In conclusion, our results suggested that CS-MRI was valuable for improving the overall workflow of spinal MRI.Acknowledgements
No acknowledgement found.References
1. Seo, N., Park, M.-S., Han, K.et al. Feasibility of 3D navigator-triggered magnetic resonance cholangiopancreatography with combined parallel imaging and compressed sensing reconstruction at 3T. Journal of Magnetic Resonance Imaging, 46(5), 1289–1297.
2. Yoon, J. H., Lee, S. M., Kang, H.-J., et al. Clinical Feasibility of 3-Dimensional Magnetic Resonance Cholangiopancreatography Using Compressed Sensing. Investigative Radiology, 52(10), 612–619.
3. Taron, J., Weiss, J., Notohamiprodjo, M., et al. Acceleration of Magnetic Resonance Cholangiopancreatography Using Compressed Sensing at 1.5 and 3 T. Investigative Radiology, 53(11), 681–688.
4. Lohöfer, F. K., Kaissis, G. A., Rasper, M., et al. Magnetic resonance cholangiopancreatography at 3 Tesla: Image quality comparison between 3D compressed sensing and 2D single-shot acquisitions. European Journal of Radiology, 115, 53–58.
5. Zhu, L., Wu, X., Sun, Z., et al. Compressed-Sensing Accelerated 3-Dimensional Magnetic Resonance Cholangiopancreatography. Investigative Radiology, 53(3), 150–157.
6. Lin, Z., Zhang, X., Guo, L.,et al. Clinical feasibility study of 3D intracranial magnetic resonance angiography using compressed sensing. Journal of Magnetic Resonance Imaging, 50(6), 1843–1851.
Figures