3457
Impact of manual segmentation on the non-linear registration of a spinal cord atlas to functional space1Physical Therapy and Human Movement Sciences, Northwestern University, Chicago, IL, United States, 2Biomedical Engineering, Northwestern University, Evanston, IL, United States, 3Neurosurgery, Oklahoma University, Oklahoma City, OK, United States, 4Anesthesiology, Perioperative and Pain Medicine, Stanford University, Palo Alto, CA, United States
Synopsis
Contouring the cervical spinal cord in functional MRI is a difficult but necessary task, that is typically performed manually. Differences between raters in drawing these masks could directly affect overall study results. This work compared the differences between spinal cord masks drawn by raters of varied experience with an expert rater on temporal mean fMRI images from 14 healthy participants; then the resultant warped atlas masks in functional space after non-linear registration using the Spinal Cord Toolbox. Performing non-linear registration increased overall agreement of the masks as a whole and along the edges where most disagreement occurs.
Introduction
Functional imaging of the spinal cord is becoming an increasingly common tool to understand neurovascular responses to sensory and motor stimuli.[1] Central to these studies is the co-registration of low-resolution fMRI images to high-resolution anatomical atlases of the cord. This allows a robust segmented spinal cord atlas to be transformed into the original functional space. However, this co-registration requires as input manually drawn masks of the spinal cord on functional images, which will vary across individual raters. It is not known how the warping of the atlas to functional space is impacted by the precise boundaries of the manually contoured mask. This work explores the agreement of manually contoured masks of the spinal cord from raters of different experience levels with an expert rater. Then, with these initial masks as input to non-linear co-registration, we compare agreement between the resulting warped atlas segmentations in functional space.[2]Methods
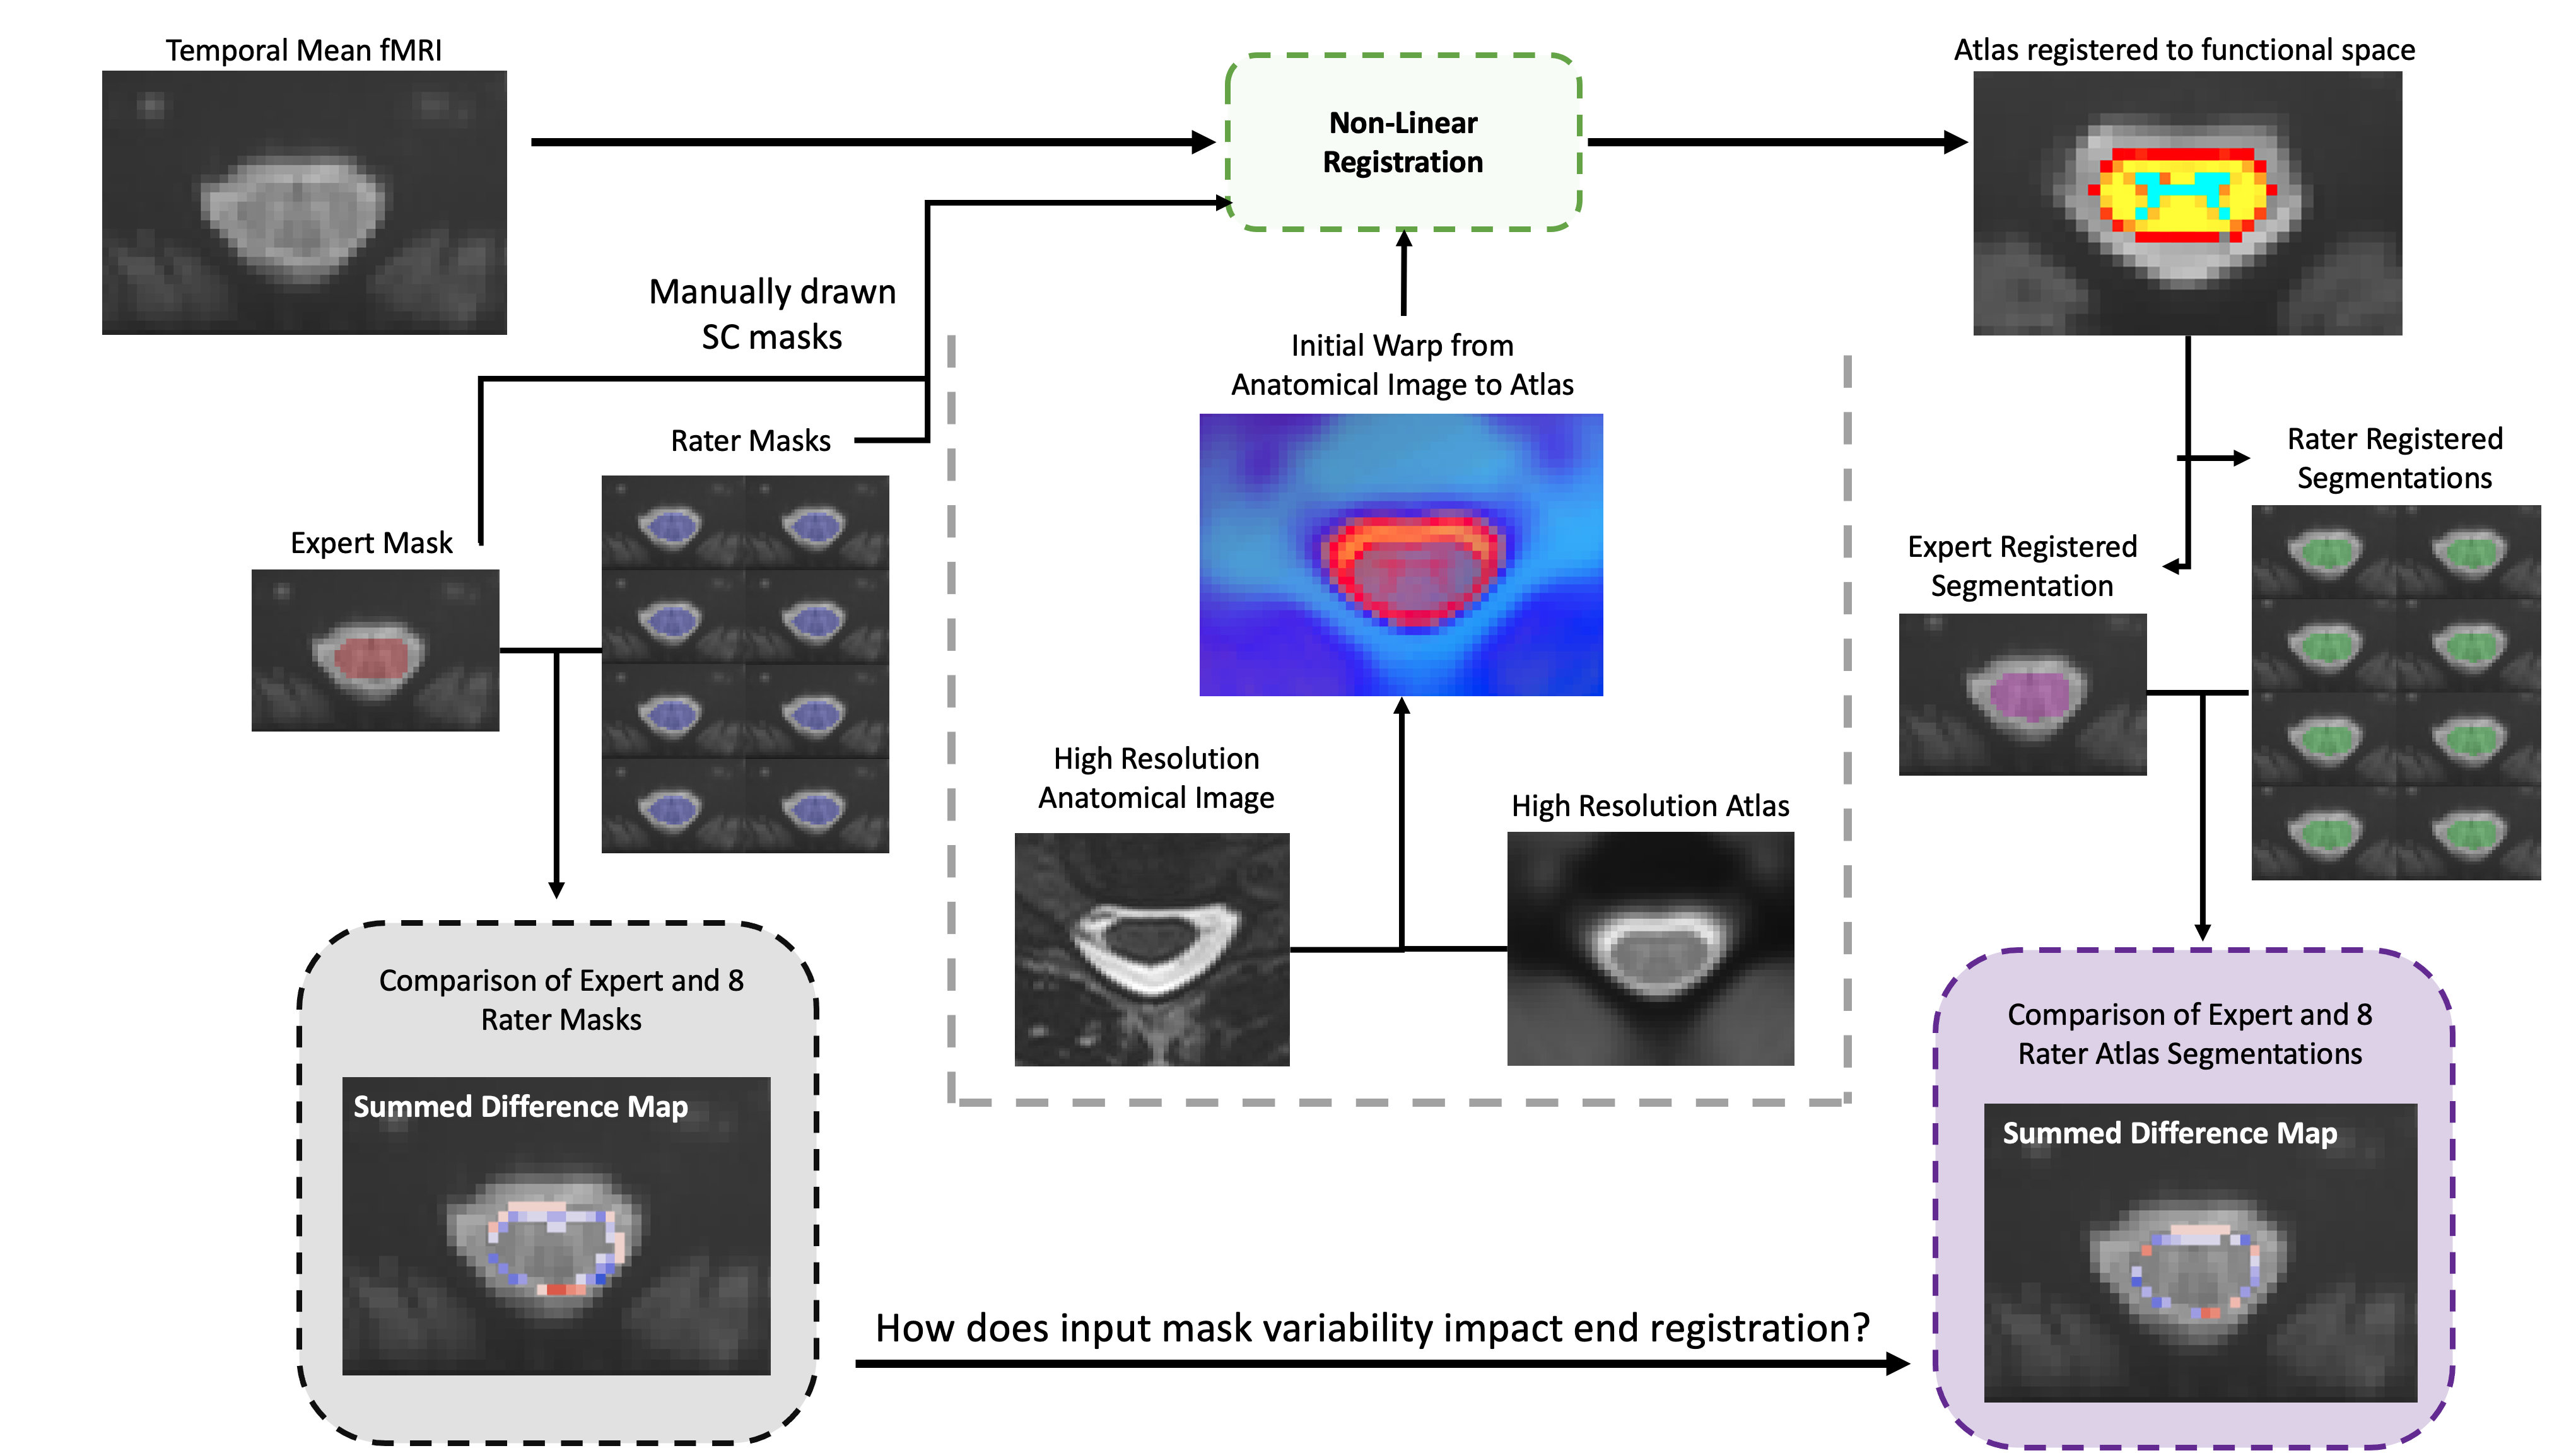
Anatomical and functional images from 14 participants were selected from a completed study of healthy participants.[3] Imaging was performed using a 3T Siemens Prisma scanner, utilizing a 64-channel head/neck and a SatPad™ cervical collar. A high-resolution T2-weighted anatomical image of the cervical spine was acquired using a single slab three-dimensional turbo spin echo sequence with a slab selective, variable excitation pulse.[6,7] For functional imaging, twenty-five transverse slices of the cervical spinal cord were acquired with a T2∗-weighted gradient-echo echo-planar-imaging sequence using ZOOMit selective field-of-view.[4,5] The imaged volume was centered on the spinal cord at the C5 vertebral level. Motion correction was performed using FMRIB’s Linear Image Registration Tool (FLIRT) for a rigid and non-rigid 3D alignment; then rigid 2D (axial slice) alignment.Outlined in Figure 1, the spinal cord was contoured on temporal mean functional images by an expert rater and 8 raters with varied levels of experience. Initial warp fields were generated by registration of anatomical T2w spinal cord masks, created with the sct_deepseg_sc function, to the PAM50 atlas.[2,8] Then the atlas was registered to functional space utilizing the Spinal Cord Toolbox sct_register_multimodal function, with a multistep centerline (linear) then b-spline (non-linear) method. Registered atlas segmentations in functional space for all 8 raters were then compared to that of the expert, across all participants.
Difference maps and Dice Similarity Coefficients (DSC) were measured between the original expert and 8 rater masks, and subsequent registered atlas segmentations for each participant dataset. Voxels along the edge of the contours (±2 pixel dilation/erosion of the expert mask) were examined to ascertain agreement or disagreement. Significance was tested using RMANOVA between the input mask and post-registration segmentation mask DSC values (all comparing rater results to the expert’s), with α = 0.01. Summary statistics were also calculated for the mask differences. Secondary analysis of individual raters was performed using Bonferroni-corrected post-hoc testing.
Results
Representative difference maps, and a summary of these differences, are shown in Figure 2. The number of pixels in agreement between the raters and the expert were greater in the registered atlas masks compared to the original manually-contoured masks, 71.7% versus 64.6% (p < 0.01).Across all participants and raters, post-registration atlas segmentations demonstrated small, but significant, improved DSC, increasing by an average of 0.018 (p < 0.001). Post-hoc analysis showed that 5 of the 8 raters demonstrated significant DSC improvements post-registration (p < 0.01). Box plots of the average DSC, by rater, are shown in Figure 4. A plot of registered atlas versus input mask DSC is shown in Figure 5, where 89.5% of the values lie above the unity line.
Discussion
Functional imaging in the spinal cord remains a technical challenge, often featuring poor contrast between neural tissue and the surrounding cerebrospinal fluid (CSF).[9] This work sought to evaluate the importance of rater variability of masking the spinal cord in fMRI on post-registration atlas segmentations of the cord. The main finding of this study was the improvement in overall agreement as a result of deformable registration utilizing high resolution anatomical images for initial warping fields.While DSC increased post-registration, this measure is skewed by voxels in the middle of the segmentations. Most disagreement between raters occurs at the junction of the spinal cord and CSF, due to low resolution and blurring from motion. Therefore, agreement and differences along the edge of the contours was examined, where, as shown in Figures 2 and 3, a larger magnitude of improvement was observed. However, a large number of edge voxels remained in disagreement after registration. Disagreement along the edge of registered spinal cord segmentations could alter interpretation of fMRI results.
Increasing agreement and consistency between raters should be a primary goal of future fMRI studies of the spinal cord. While differences remained post-registration, this study demonstrated the importance of acquiring a high-resolution anatomical image in conjunction with functional data to initialize registration warp fields. Furthermore, this work introduced an alternate method for characterizing differences in masks, examining agreement along the edges of a contour. Building on this work, the data collected for this study and new edge agreement metrics could be used to train convolutional neural networks for automated cord segmentation in fMRI.
Acknowledgements
Research supported by the Craig H. Neilsen Foundation (595499)References
1. De Leener B, Lévy S, Dupont SM, Fonov VS, Stikov N, Collins DL, Callot V, Cohen-Adad J. SCT: Spinal Cord Toolbox, an open-source software for processing spinal cord MRI data. Neuroimage. 2017 Jan 15;145:24-43.
2. Martin AR, Aleksanderek I, Cohen-Adad J, Tarmohamed Z, Tetreault L, Smith N, Cadotte DW, Crawley A, Ginsberg H, Mikulis DJ, Fehlings MG. Translating state-of-the-art spinal cord MRI techniques to clinical use: a systematic review of clinical studies utilizing DTI, MT, MWF, MRS, and fMRI. NeuroImage: Clinical. 2016 Jan 1;10:192-238.
3. Weber II KA, Chen Y, Paliwal M, Law CS, Hopkins BS, Mackey S, Dhaher Y, Parrish TB, Smith ZA. Assessing the spatial distribution of cervical spinal cord activity during tactile stimulation of the upper extremity in humans with functional magnetic resonance imaging. NeuroImage. 2020 May 6:116905.
4. Pfeuffer J, van de Moortele PF, Yacoub E, Shmuel A, Adriany G, Andersen P, Merkle H, Garwood M, Ugurbil K, Hu X. Zoomed functional imaging in the human brain at 7 Tesla with simultaneous high spatial and high temporal resolution. Neuroimage. 2002 Sep 1;17(1):272-86.
5. Rieseberg S, Frahm J, Finsterbusch J. Two‐dimensional spatially‐selective RF excitation pulses in echo‐planar imaging. Magnetic Resonance in Medicine: An Official Journal of the International Society for Magnetic Resonance in Medicine. 2002 Jun;47(6):1186-93.
6. Lichy MP, Wietek BM, Mugler III JP, Horger W, Menzel MI, Anastasiadis A, Siegmann K, Niemeyer T, Königsrainer A, Kiefer B, Schick F. Magnetic resonance imaging of the body trunk using a single-slab, 3-dimensional, T2-weighted turbo-spin-echo sequence with high sampling efficiency (SPACE) for high spatial resolution imaging: initial clinical experiences. Investigative radiology. 2005 Dec 1;40(12):754-60.
7. Mugler III JP, Bao S, Mulkern RV, Guttmann CR, Robertson RL, Jolesz FA, Brookeman JR. Optimized single-slab three-dimensional spin-echo MR imaging of the brain. Radiology. 2000 Sep;216(3):891-9.
8. De Leener B, Fonov VS, Collins DL, Callot V, Stikov N, Cohen-Adad J. PAM50: Unbiased multimodal template of the brainstem and spinal cord aligned with the ICBM152 space. Neuroimage. 2018 Jan 15;165:170-9.
9. Powers JM, Ioachim G, Stroman PW. Ten key insights into the use of spinal cord fMRI. Brain sciences. 2018 Sep;8(9):173.
Figures