3455
An optimized MP2RAGE sequence for studying both brain and cervical spinal cord1Aix-Marseille Univ, CNRS, CRMBM, Marseille, France, 2APHM, Hopital Universitaire Timone, CEMEREM, Marseille, France, 3Aix-Marseille Univ, Université Gustave Eiffel, LBA, Marseille, France, 4iLab-Spine International Associated Laboratory, Montreal, Canada, Marseille, France
Synopsis
Magnetization Prepared 2 Rapid Acquisition Gradient Echo (MP2RAGE) is a T1 mapping technique used broadly on brain and recently on spinal cord (SC).The growing interest for combined investigation of brain and SC brings about the need for optimization with regards to spatial coverage, high CNR, low B1+ sensitivity, short acquisition time and high robustness.This work proposes an optimized sub-millimetric protocol for simultaneous brain and cervical spinal cord (BCSC) MP2RAGE acquisition at 3T and subsequent post-processing pipeline. It shows excellent agreement with previously proposed brain or SC protocols, with good reproducibility, which opens up great perspectives for clinical applications.
Introduction
Magnetization Prepared 2 Rapid Acquisition Gradient Echo (MP2RAGE) is an IR-based technique that acquires two RAGE volumes that can be combined to create a so-called UNI image, which is then used to estimate the T1 of the tissues1. It has been used in brain at 3T and 7T to study pathologies like multiple sclerosis (MS) and has shown to be effective in investigating the progression of disease2-5. On spinal cord (SC), it was used for the first time at 7T6 and was optimized later on at 3T to study the whole cervical spinal cord7 and detect MS lesions15.In recent years, there has been a growing interest in studying the whole central nervous system (CNS), since it holds great potential in understanding pathophysiological changes in patients8-12. In the same vein, this work focused on MP2RAGE optimization at 3T to study both brain and spinal cord. We first optimized the protocol through computer simulation for a higher contrast-to-noise ratio while limiting B1+ insensitivity. Then we proposed an automatic and robust post-processing pipeline to quantify T1 maps on different regions of brain and SC and compare them with previously published reference values. Furthermore, the inter-session reproducibility of the technique was assessed for prospective clinical application on progressive degenerative studies.
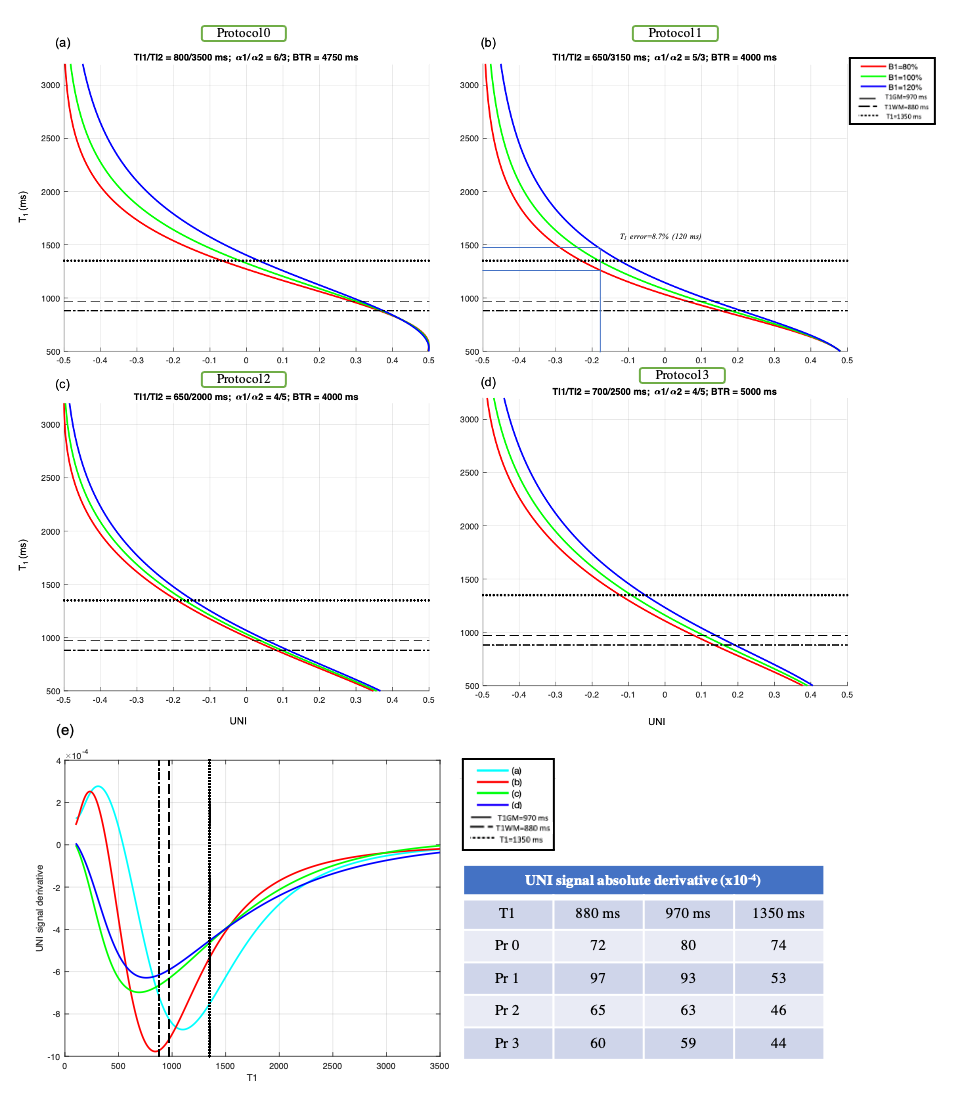
Simulation
For a given spatial resolution, 5 main parameters in the MP2RAGE sequence can be set to determine the unique relationship between the UNI image and T1 map: two inversion times (TI1/TI2), two RAGE flip angles (α1/α2), and MP2RAGE repetition time (BTR). In this work, the CNR, which was calculated based on the formula described in Marques et al.1, was maximized considering the CNR of WM/GM and WM/CSF on cervical spinal cord. Initial T1 values set for WM and GM were 880 and 970 ms according to reference 13 and 3000 ms for CSF, which is an upper value set based on previous data. These values cover a broad range of T1s also observed in brain (1350 ms for GM, 1250 ms for Nucleus caudate and 1130 ms for Putamen1).An average B1+ map calculated from 3 healthy volunteers datasets showed a ±20% B1+ variation in brain and CSC, a range that was considered in the simulation for assessing B1+ sensitivity. Protocols that showed non-bijectivity for T1s between 500-3000 ms were removed. Figure 1 shows the results of simulation for 4 different protocols (Pr0 and Pr1, derived from these simulations, and Pr2 and Pr3, from literature).
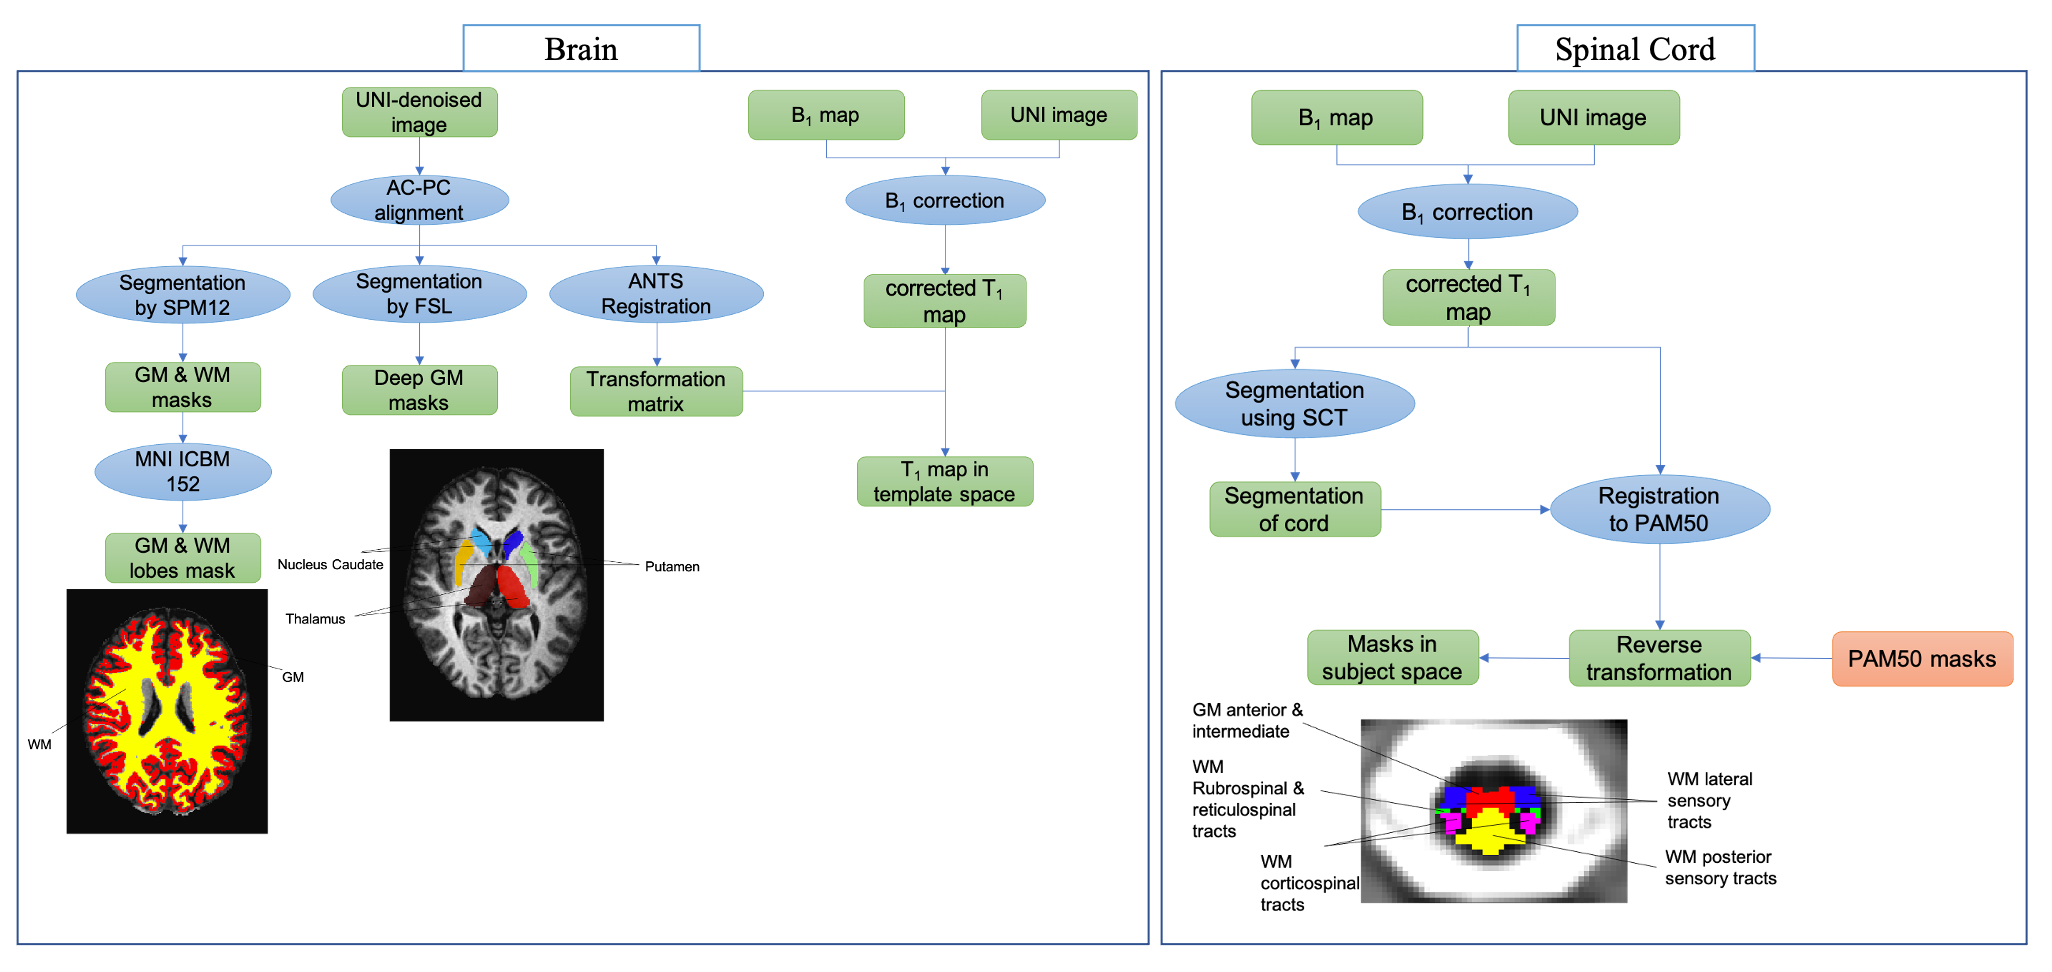
In-vivo experiment
Protocols 1,2 and 3 (shown in figure 1) were tested on healthy volunteers. The resolution and FOV used for Pr1 and Pr2 are 0.9 mm and 315 mm, and for Pr3 is 1 mm isotropic and 256 mm. A Parallel acquisition of PAT2 was used for Pr1 and 2 and PAT3 for Pr3. All the data were acquired on a 3T Siemens Verio scanner with a 12-channel head and 4-channel neck coils (Siemens Healthineers, Erlangen, Germany). Three healthy volunteers (27, 37, 45 years old, 1M/2F) were scanned in three separate sessions with each protocol to assess the inter-session reproducibility of each sequence. A B1+ map acquired using a preconditioning RF pulse with turboFLASH readout16 with a resolution of 5 mm isotropic was additionally used to correct T1 maps. The complete post-processing pipeline used to extract metrics in the different BCSC ROIs is shown in figure 2.Results & Conclusion
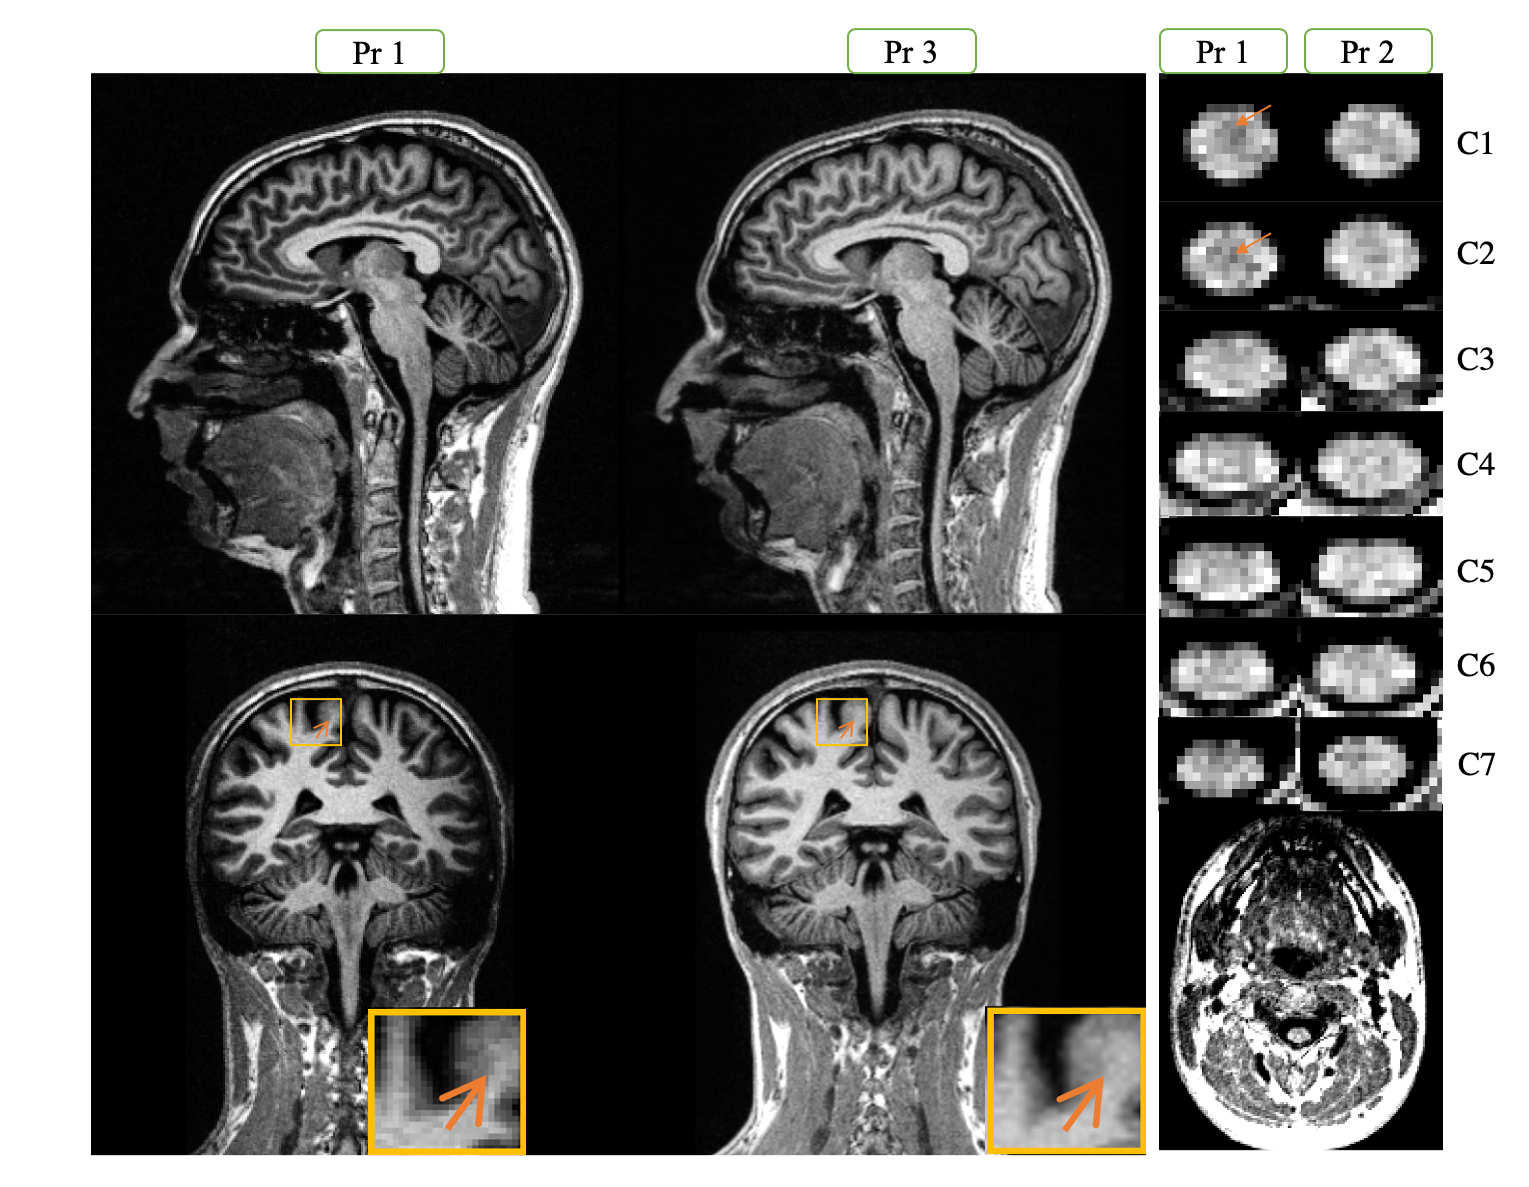
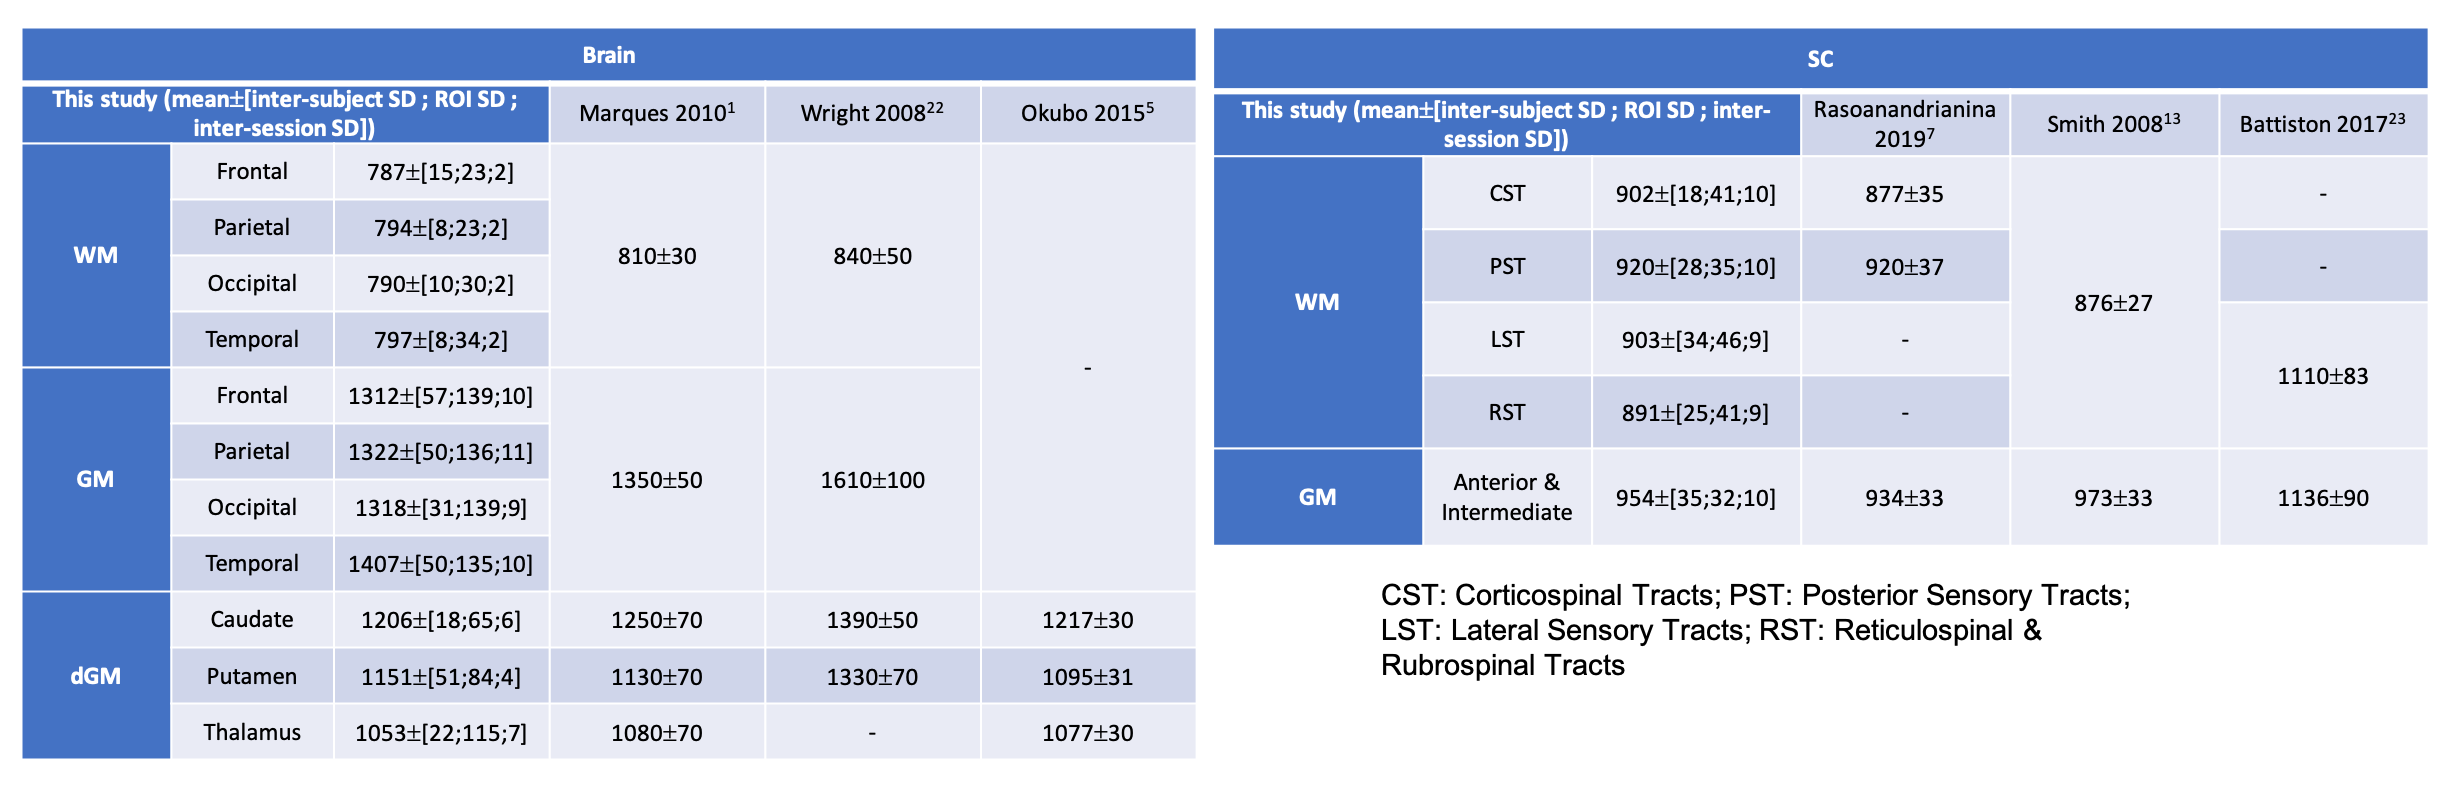
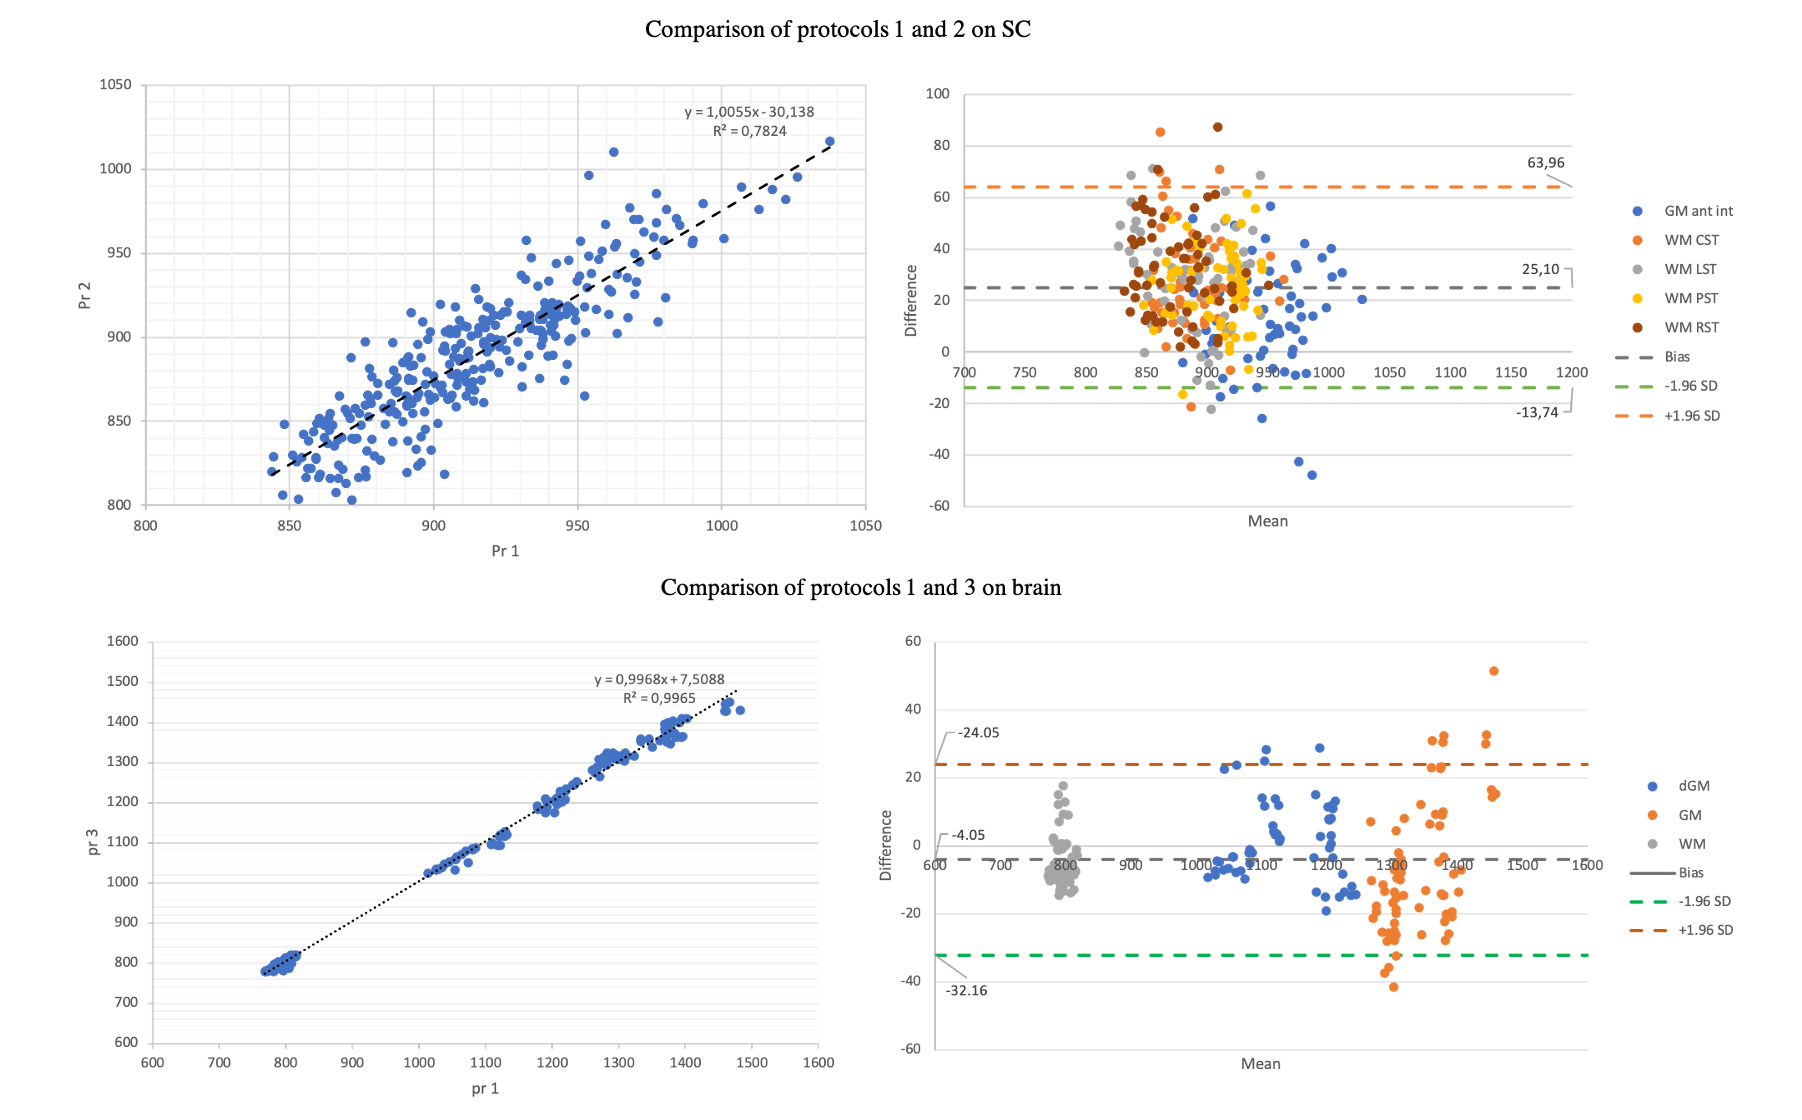
Figure 3 shows a representation of the UNI-denoised image for the 3 protocols. Table 1 summarizes the average values obtained in different ROIs of brain and CSC obtained by BCSC protocol (Pr1) and compares that to the values reported in the literature. The mean values observed in brain white, gray and deep gray matters were 792±27, 1339±139 and 1136±88 ms, and in spinal cord, for corticospinal (CST), posterior sensory (PST), lateral sensory (LST) and rubrospinal&reticulospinal sensory (RST) white matter tracts, and anterior&intermediate gray matter were 902±41, 920±35, 903±46, 891±41 and 954±32 ms, respectively.The optimized Pr1 was also compared to protocol 2 (used for SC only7) and protocol 3 (brain only2) in figure 4. An excellent agreement is seen on brain with a Pearson correlation coefficient of 0.99. On SC, this correlation was found equal to 0.88 with a bias of 25 ms, which is lower than the mean in-ROI SD observed in SC (around 39 ms).To assess the reproducibility of the protocols, the coefficient of variation (COV) was calculated as mean/SD for each ROI in each subject, throughout the 3 sessions. The global average COV on brain for Pr1 and Pr3 were 0.52±0.36 and 0.69±0.56 and on SC for Pr1 and Pr2 were 1.12±0.62 and 1.37±1.21 (%), respectively. The highest COV (lowest reproducibility) was lower than 3% (single ROI, single subject) and was observed at C7.
Discussion & Perspectives
The optimized BCSC MP2RAGE protocol is able to cover both brain and CSC in less than 8 minutes and provides a good contrast in different tissues, while showing great robustness and reproducibility and an excellent agreement with protocols previously used in different studies. It opens up a great perspective in studying global impairments in degenerative pathologies like MS and ALS.Acknowledgements
The authors would like to thank T. Kober from Siemens Healthcare for MP2RAGE sequence support. The work was supported by Carnot Star Institut and received funding from European Union’s Horizon 2020 research and innovation program under the Marie Skłodowska-Curie grant agreement No713750.References
[1] J. P. Marques et al., “NeuroImage MP2RAGE , a self bias- field corrected sequence for improved segmentation and T1-mapping at high field,” Neuroimage, vol. 49, no. 2, pp. 1271–1281, 2010.
[2] T. Kober et al., “MP2RAGE Multiple Sclerosis Magnetic Resonance Imaging at 3T,” vol. 47, no. 6, pp. 346–352, 2012.
[3] P. Marques et al., “New Developments and Applications of the MP2RAGE Sequence - Focusing the Contrast and High Spatial Resolution R1 Mapping,” vol. 8, no. 7, 2013.
[4] K. R. O. Brien et al., “Robust T1-Weighted Structural Brain Imaging and Morphometry at 7T Using MP2RAGE,” vol. 9, no. 6, 2014.
[5] G. Okubo et al., “MP2RAGE for Deep Gray Matter Measurement of the Brain : A Comparative Study with MPRAGE,” pp. 55–62, 2015.
[6] A. Massire et al., “High-resolution multi-parametric quantitative magnetic resonance imaging of the human cervical spinal cord at 7T,” Neuroimage, vol. 143, pp. 58–69, 2016.
[7] H. Rasoanandrianina et al., “Regional T1 mapping of the whole cervical spinal cord using an optimized MP2RAGE sequence,” NMR Biomed., vol. 32, no. 11, pp. 1–17, 2019.
[8] P. Freund et al., “Embodied neurology: An integrative framework for neurological disorders,” Brain, vol. 139, no. 6, pp. 1855–1861, 2016.
[9] J. Cohen-Adad et al., “BOLD signal responses to controlled hypercapnia in human spinal cord,” Neuroimage, vol. 50, no. 3, pp. 1074–1084, 2010.
[10] J. Finsterbusch et al., “Combined T2*-weighted measurements of the human brain and cervical spinal cord with a dynamic shim update,” Neuroimage, vol. 79, pp. 153–161, 2013.
[11] H. Islam et al., “Dynamic per slice shimming for simultaneous brain and spinal cord fMRI,” Magn. Reson. Med., vol. 81, no. 2, pp. 825–838, 2019.
[12] M. Azzarito et al., “Simultaneous voxel-wise analysis of brain and spinal cord morphometry and microstructure within the SPM framework,” Hum. Brain Mapp., no. January, pp. 1–13, 2020.
[13] S. A. Smith et al., “Measurement of T1 and T2 in the cervical spinal cord at 3 Tesla,” Magn. Reson. Med., vol. 60, no. 1, pp. 213–219, 2008.
[14] Simioni, Samanta, et al. "MP2RAGE provides new clinically-compatible correlates of mild cognitive deficits in relapsing-remitting multiple sclerosis." Journal of neurology" 261.8 (2014): 1606-1613.
[15] S. Demortière et al., “Improved cervical cord lesion detection with 3D-MP2RAGE sequence in patients with multiple sclerosis,” Am. J. Neuroradiol., vol. 41, no. 6, pp. 1131–1134, 2020.
[16] S. Chung et al., “Rapid B1+ mapping using a preconditioning RF pulse with turboFLASH readout,” Magn. Reson. Med., vol. 64, no. 2, pp. 439–446, 2010.
[17] M. F. Glasser et al., “The minimal preprocessing pipelines for the Human Connectome Project,” Neuroimage, vol. 80, pp. 105–124, 2013.
[18] BB. Avantset al., “Advanced normalization tools (ANTS),” Insight j 2, 2009.
[19] V. Fonov et al.,“Unbiased average age-appropriate atlases for pediatric studies,” Neuroimage, vol. 54, no. 1, pp. 313–327, 2011.
[20] B. De Leener et al., “SCT: Spinal Cord Toolbox, an open-source software for processing spinal cord MRI data,” Neuroimage, vol. 145, no. October 2016, pp. 24–43, 2017.
[21] B. De Leener et al., “PAM50: Unbiased multimodal template of the brainstem and spinal cord aligned with the ICBM152 space,” Neuroimage, vol. 165, no. July 2017, pp. 170–179, 2018.
[22] Wright, P. J., et al. "Water proton T 1 measurements in brain tissue at 7, 3, and 1.5 T using IR-EPI, IR-TSE, and MPRAGE: results and optimization." Magnetic Resonance Materials in Physics, Biology and Medicine" 21.1-2 (2008): 121
[23] Battiston, Marco, et al. "Fast and reproducible in vivo T1 mapping of the human cervical spinal cord." Magnetic resonance in medicine" 79.4 (2018): 2142-2148.
Figures