3452
Analysis of signal and contrast in a multi-echo gradient-echo sequence of the lumbosacral cord: recommendations for number of echoes and averages1Department of Neuro-Urology, Balgrist University Hospital, University of Zurich, Zurich, Switzerland, 2Spinal Cord Injury Center, Balgrist University Hospital Zurich, University of Zurich, Zurich, Switzerland, 3Department of Brain Repair and Rehabilitation, UCL Institute of Neurology, London, United Kingdom, 4Department of Neurophysics, , Max Planck Institute for Human Cognitive and Brain Sciences, Leipzig, Germany, 5Wellcome Trust Centre for Neuroimaging, UCL Institute of Neurology, London, United Kingdom
Synopsis
In this study, we aimed to provide recommendations on the number of echoes and averages when imaging the lumbosacral spinal cord using a multi-echo gradient-echo sequence. We found that while more echoes increase the white matter/cerebrospinal fluid contrast, the gray matter/white matter contrast plateaus at 3 echoes. Also, the signal and contrast-to-noise ratios increased only minimally after 6 averages. Overall, we recommend a minimum of 3 and maximum of 4 echoes as an optimal trade-off between segmentability and artifact level, and 6 signal averages (or measurements) for robust segmentations.
Introduction
Multi-echo gradient-echo sequences have been used in research settings to produce high-resolution axial images [1-4]. These sequences, such as the spoiled gradient-echo sequence (FLASH), yield a mixture of T1-, PD-, and T2*-weighting and provide good contrast between gray matter (GM), white matter (WM), and cerebrospinal fluid (CSF), facilitating volumetric measurements of these tissues. In recent years, the feasibility of spinal cord and gray matter segmentation was demonstrated in the lumbar enlargement [5] and the conus medullaris [6]. Clinically, such volumetric analyses can be used to detect GM and WM atrophy, which is highly relevant in a number of diseases affecting the lumbosacral cord [7]. However, unlike in the cervical cord [8], there is no consensus on the sequence parameters to be used in the lumbosacral cord. The number of echoes is important as it determines the contrast of the image: while in the early echoes T1- and PD- weighting dominate, benefitting GM/WM contrast, later echoes add more and more T2*-weighting, increasing WM/CSF and decreasing GM/WM contrast. Furthermore, later echoes introduce more off-resonance artifacts due to longer read-out times. In practice, multiple averages (or measurements) are acquired to increase signal-to-noise-ratio (SNR) and contrast-to-noise ratio (CNR). While SNR and CNR increase with the square root of the number of averages, the imaging time scales linearly with it, raising the issue of a practical maximum value. In this study, we aimed to find the number of echoes and averages providing optimal trade-off between SNR, GM/WM contrast, WM/CSF contrast, artifact level, and imaging time.Methods
10 subjects underwent MRI of the lumbosacral cord on a 3T Siemens Prisma using a spoiled 3D multi-echo gradient-echo sequence (Siemens FLASH). The 20 axial-oblique slices with 5 mm thickness (no gap) were set individually based on a sagittal T2-weighted image to encompass the lumbar enlargement and conus medullaris (Fig. 1A-B). Sequence parameters were: in-plane resolution 0.5x0.5 mm2, field of view 192x192 mm2, repetition time 38 ms, echo train length 5, first echo time 6.85 ms, echo spacing 4 ms, flip angle 8°, 8 measurements, GRAPPA 2x, no partial Fourier, bandwidth 260 Hz/pixel, acquisition time 17:56 min. Individual echoes and measurements were not combined within the scanner. A series of images were created by combining successive echoes via root-mean-squares and by averaging successive measurements. In total, each subject had a series of 40 images, each of them corresponding to a different number of combined echoes and different number of averages (Fig. 2).SC and GM were segmented manually on the second last image of the series (echo 1-4, meas 1-8) using sub-voxel segmentation in JIM 7.0 (Fig. 1C). Segmentations were binarized to obtain binary masks. WM mask was created by subtracting GM from the SC mask and was one-voxel eroded to reduce partial volume effects. CSF mask was created using an oval region of interest (30.6 square pixels). For each image, the SNR within GM and WM was computed according to: $$SNR = mean(S)/std(S)$$ where mean and std represent the mean and standard deviation of the voxel intensities (S) within the GM or WM mask. CNR between tissues 1-2 was computed as: $$CNR_{1-2} =\frac{|mean(S_{1})-mean(S_{2})|}{\sqrt{(S_{1})^{2}+(S_{2})^{2}}}$$ where 1-2 represent GM/WM and WM/CSF.
Results
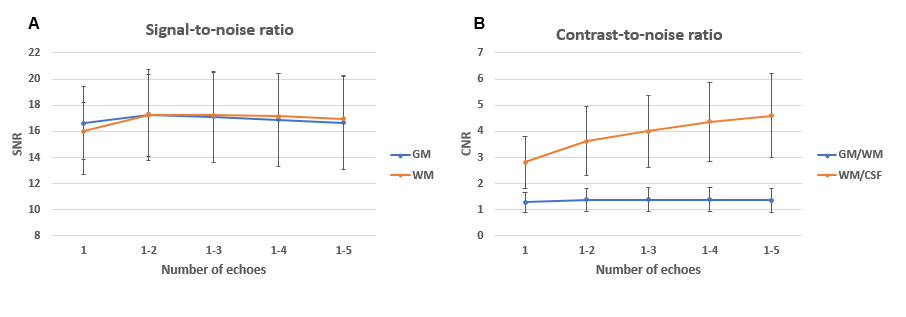
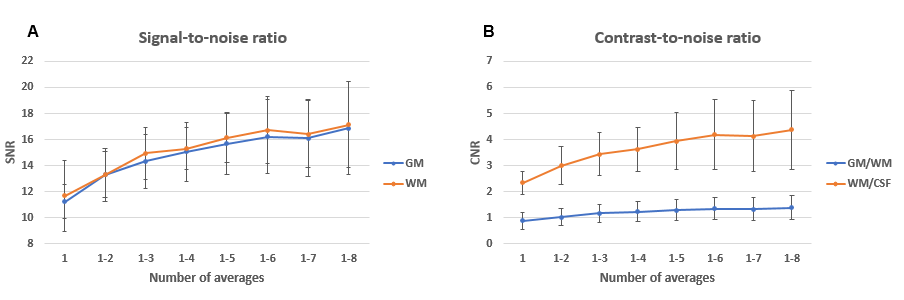
The SNR and CNR characteristics of each of the 40 images in the series can be qualitatively appreciated in an example subject (Fig. 2). Since the signal intensity decreases exponentially with increasing echo times (T2*-relaxation), combining more echoes results in lower overall signal levels. Additionally, later echoes are increasingly T2*-weighted; therefore, combining more echoes add more T2* contrast to the images.Quantitatively, the SNR of GM and WM have similar values of around 17 for all echo combinations with more than one echo. CNR between WM/CSF keeps increasing at an incrementally lower rate with each additional echo, reaching a value of 4.6 at 5 echoes. CNR between GM/WM is substantially lower for all echoes than between WM/CSF, and shows a flat peak value of around 1.4 at 3-4 echoes (Fig. 3). SNR of GM and WM run close together and initially follow an approximate square-root dependency on the number of averages, but with diminishing gains above 6 averages. CNR between WM/CSF and GM/WM also follow a similar dependency, increasing minimally above 6 averages (Fig. 4).
Discussion
We clearly observed that while acquiring the sequence with more averages (or measurements) always improves the signal and contrast, this is not the case when acquiring more and more echoes due to T2*-relaxation and the increased off-resonance artifacts. In terms of number of averages, we propose a practical optimum of 6 averages, above which the gain in SNR and CNR does not justify the increasing imaging time. The GM/WM and WM/CSF contrasts vary with the number of echoes, and we recommend 5 echoes for spinal cord and 3 echoes for gray matter segmentation. While we do not recommend more than 5 echoes as the increasing artifacts in later echoes deteriorate the image, we argue that 3-4 echoes provide a good trade-off between segmentability and artifact level. This research and proposed sequence parameters represent a step toward standardized protocols in the lumbosacral cord, which can be readily introduced into clinical practice and ultimately in clinical trials.Acknowledgements
The study was supported by the Investigator Initiated Clinical Trials (IICT) programme of the Swiss National Science Foundation (SNSF number: 33IC30_179644)References
1. Martin, N., et al., Comparison of MERGE and Axial T2-Weighted Fast Spin-Echo Sequences for Detection of Multiple Sclerosis Lesions in the Cervical Spinal Cord. American Journal of Roentgenology, 2012. 199(1): p. 157-162.
2. White, M.L., Y. Zhang, and K. Healey, Cervical spinal cord multiple sclerosis: evaluation with 2D multi-echo recombined gradient echo MR imaging. J Spinal Cord Med, 2011. 34(1): p. 93-8.
3. Huber, E., et al., Dorsal and ventral horn atrophy is associated with clinical outcome after spinal cord injury. Neurology, 2018. 90(17): p. e1510.
4. Grabher, P., et al., Voxel-based analysis of grey and white matter degeneration in cervical spondylotic myelopathy. Scientific Reports, 2016. 6(1): p. 24636.
5. Yiannakas, M.C., et al., The use of the lumbosacral enlargement as an intrinsic imaging biomarker: feasibility of grey matter and white matter cross-sectional area measurements using MRI at 3T. PLoS One, 2014. 9(8): p. e105544.
6. Yiannakas, M.C., et al., Gray vs. White Matter Segmentation of the Conus Medullaris: Reliability and Variability in Healthy Volunteers. J Neuroimaging, 2019. 29(3): p. 410-417.
7. David, G., et al., In vivo evidence of remote neural degeneration in the lumbar enlargement after cervical injury. Neurology, 2019. 92(12): p. e1367-e1377.
8. Samson, R., et al., Consensus acquisition protocol for quantitative MRI of the cervical spinal cord at 3T. 2018.
Figures