3451
Preoperative Spinal Cord Perfusion has the ability to predict the postoperative prognosis for Patients with Cervical Spondylotic Myelopathy1Center for Biomedical Imaging Research, School of Medicine, Tsinghua University, Beijing, China, 2Jishuitan hospital, Beijing, China
Synopsis
Cervical Spondylotic Myelopathy (CSM) is a chronic progressive disorder of spinal cord with a relatively ill-defined onset of pathogenesis. A series of state-of-art quantitative and functional MR imaging techniques has been proposed aiming to find out specific indicators in prediction and diagnosis of CSM at early phase, but lack of sufficient evidences. Spinal cord blood supply change was recognized as one of the crucial pathophysiological process in CSM. Thus, this study investigated the potential of pre-operative blood supply condition measured by DSC MRI with a non-parametric model in prediction of post-operative prognosis for patients with CSM.
Introduction
Cervical Spondylotic Myelopathy (CSM) is a chronic progressive disorder of spinal cord with a relatively ill-defined onset of pathogenesis compared with other spinal disorders[1]. In recent years, a series of state-of-art quantitative and functional MR imaging techniques were proposed aiming to find out specific indicators that contribute to prediction and diagnosis of early phase CSM prior to progressive myelopathy[1,3]. However, very low evidence exists for these metrics to serve as a biomarker in diagnosis and prognosis in a clinical context[3]. Spinal cord blood supply change was recognized as one of the crucial pathophysiological process in CSM[2]. Thus, this study investigated the potential of pre-operative blood supply condition measured by DSC MRI with a non-parametric model in prediction of post-operative prognosis for patients with CSM.Method and materials
Population and operation treatment39 CSM patients before operation (Age:61±7,M:23,F:16) were recruited following informed consent by Beijing Jishuitan hospital. All the study subjects were diagnosed with CSM and their smoke condition, all compressed segments and Modified Japanese Orthopaedic Association (mJOA) scores (pre-operation, post-operation,3 month follow up,6 month follow up) were investigated in follow-up table (Table 1). The current treatment for CSM is spinal cord decompression operation. According to the compress condition, one or more coral-made biosynthetic inlays will be deployed into the gaps of spinal canal after the splitting of spinal plate by wire saws, from anterior or posterior way. Most post-operative patients gained significant symptom relief and functional recovery. However, a certain proportion of patients after operation suffered the poor functional recovery, despite the compression has been released. All these (N=39) CSM patients of good or poor recovery were recruited in this study.
Image acquisition
All subjects were scanned before the decompression operation, on a Philips Ingenia 3.0CX with a 16-channel head-neck coil. Besides T1W and T2W images, DSC images were obtained axially with FOV covering all reported compressed segments using following parameters: technique: single-shot EPI, TE/TR=30/2000ms, voxel size=1.5*1.5*3mm3, 25 slices, FOV=160*160mm2, dyn number = 100 (include 4 pre-contrast scans), temp resolution=2.0s, scan time=200s.
Analysis
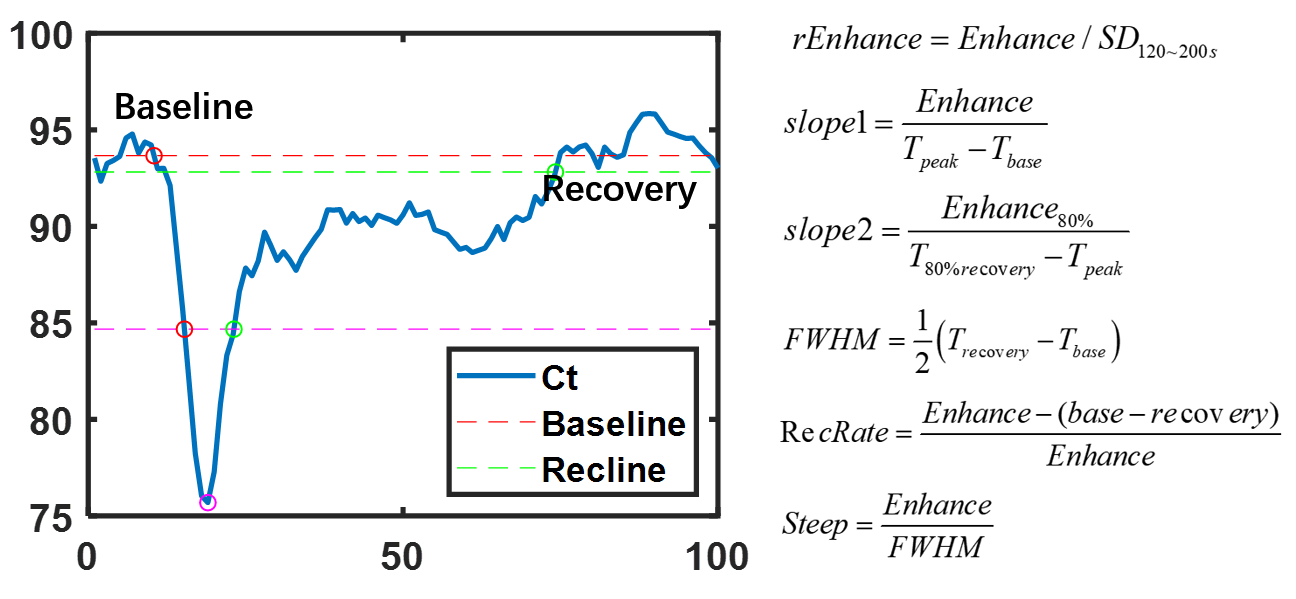
The ROIs of compressed spinal cord segments were depicted manually to calculate the dynamic intensity curves (Fig 1). Case-based analysis was conducted by averaging parameter results of all compressed segments for each case. Different from the classical perfusion model, we used a non-parametric model to quantify the spinal cord perfusion condition[6]. The principle of this model is based on the belief that pathological event is related with signal intensive (SI) pattern[6]. By recognizing the SI patterns using geometry parameter, related pathological events can be investigated. In this study, 5 model-parameters include Enhance, rEnhance, FWHM, Slope1 and Slope2, were calculated by the equations in Fig.2. All patients were divided into two groups based on good recovery (6 month mJOA>15) or poor recovery (6 month mJOA≤15). 5 t-test of different parameters between poor and good recovery groups were conducted. Combined with age and gender infomation, totally 7 factors were taken into account to investigate risk factors for 6-month poor recovery by univariate Logistic regression. After that, parameters with p value<0.05 in univariate Logistic regression would be fed to multivariate Logistic Regression to investigate their co-contributions to the poor recovery.
Results
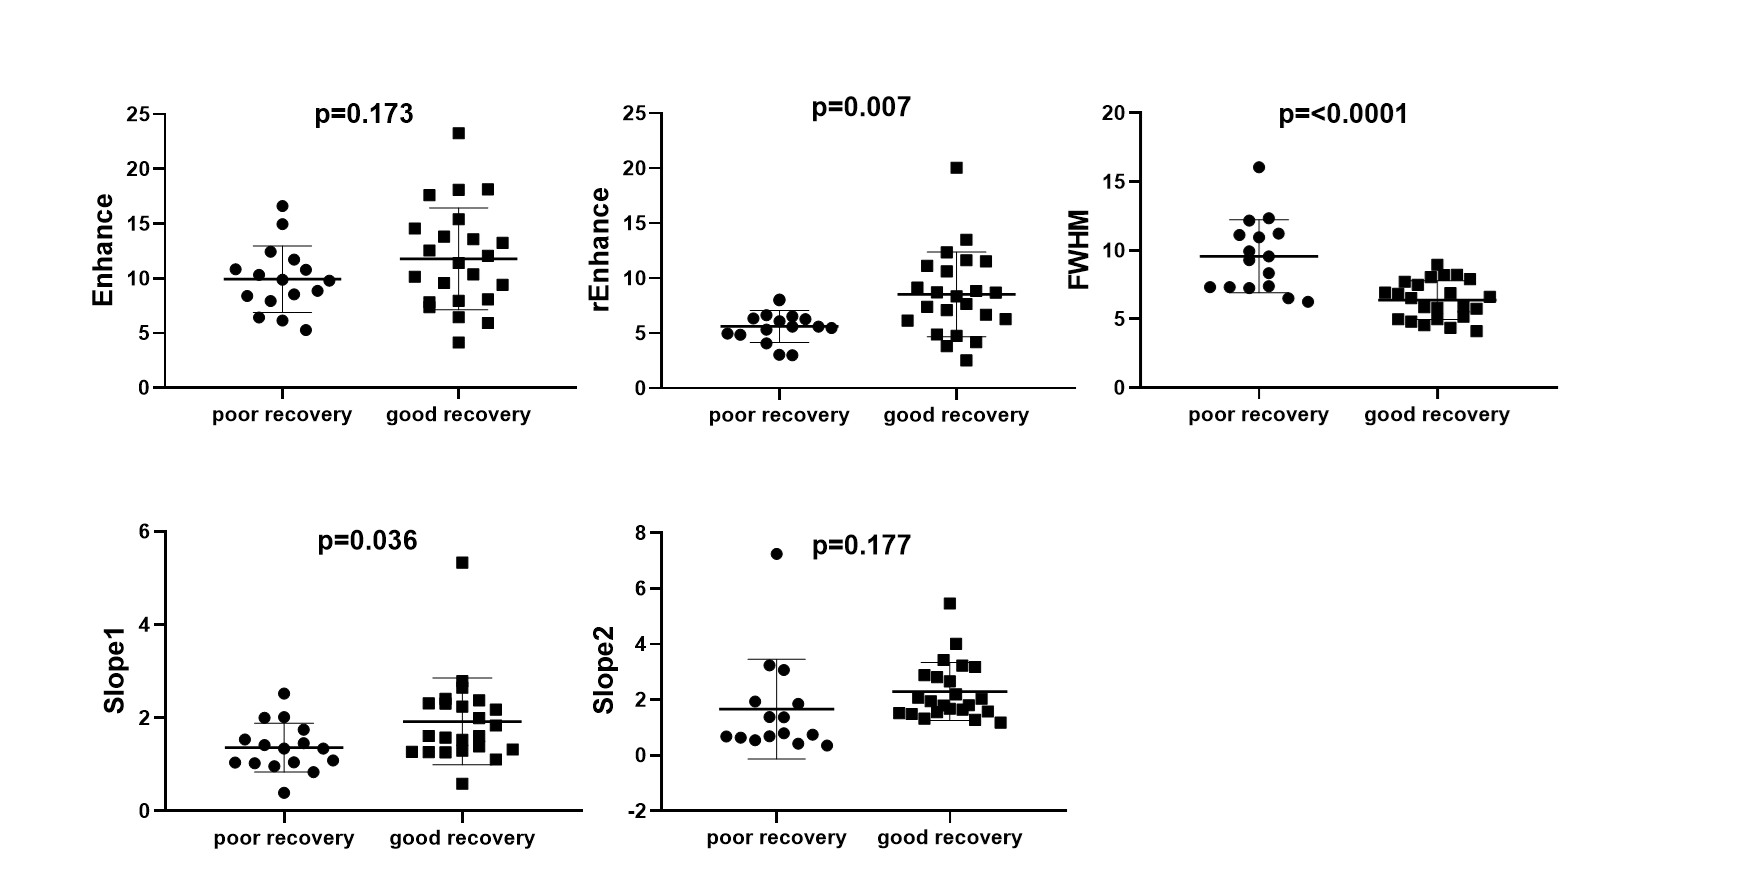
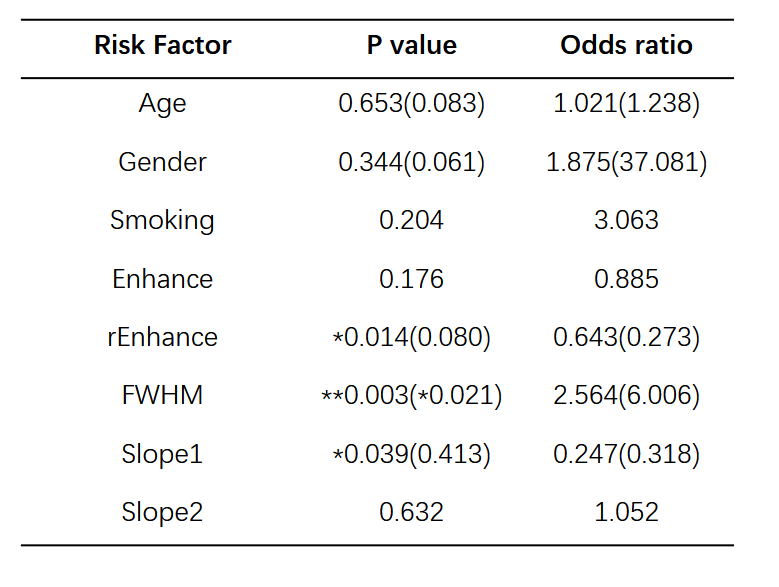
The results of t-test are shown as Fig 3. The results indicate that the rEnhance, slope1 of patients with poor recovery are significantly (p<0.05) lower than that of patients of good recovery. The FWHM of poor recovery patients are significant higher than that of patients of good recovery. The results of univariate logistic regression suggest that rEnhance, FWHM, slope1 are significant (p<0.05) impact factors to patient recovery. Decrease of rEnhance, slope1, and increase of FWHM are significant risk factors to poor prognosis recovery. The p and OR value of above significant factors were recalculated in multivariable logistic regression. Updated values have been added in the bracket. (Table 2).Discussion and conclusion
Bolus enhancement is the basic index to reflect microvascular perfusion and tissue blood flow transit condition. The decrease of enhancement can be induced by the aberrant vessels generation, vascular pooling and stasis, which not only smooth the peak of enhancement, but prevents the return of SI to baseline6. This pathological event explained the findings that the patients of poor recovery have lower rEnhance and slope1, but higher FWHM. Most of these events occur together with inflammatory reaction, which would induce adverse effect on patients’ functional recovery, hence resulting in a lower mJOA score. In this study, we successfully quantified the spinal cord blood supply condition by MRI DSC technique with non-parametric model, and find that the decrease of rEnhance, slope1 and the increase of FWHM are essential risk factors to patient poor recovery.Acknowledgements
No acknowledgement found.References
1. Ellingson B M, Salamon N, Holly L T. Advances in MR imaging for cervical spondylotic myelopathy[J]. European Spine Journal, 2015, 24(2):197-208.
2. Karadimas S K, Gatzounis G, Fehlings M G. Pathobiology of cervical spondylotic myelopathy[J]. European Spine Journal, 2015, 24(2):132-138.
3. Martin A R, Aleksanderek I, Cohen-Adad J, et al. Translating state-of-the-art spinal cord MRI techniques to clinical use: A systematic review of clinical studies utilizing DTI, MT, MWF, MRS, and fMRI[J]. Neuroimage Clinical, 2015, 10(C):192.
4. Smith A M, Grandin C B, Duprez T, et al. Whole brain quantitative CBF, CBV, and MTT measurements using MRI bolus tracking: Implementation and application to data acquired from hyperacute stroke patients[J]. Journal of Magnetic Resonance Imaging Jmri, 2000, 12(3):400.
5. De Leener B, Levy S, Dupont SM, et al. SCT: Spinal Cord Toolbox, an open-source software for processing spinal cord MRI data. NeuroImage 2017;145(Pt A):24-43.
6. Chinchure S , Thomas B , Wangju S , et al. Mean intensity curve on dynamic contrast-enhanced susceptibility-weighted perfusion MR imaging – review of a new parameter to differentiate intracranial tumors[J]. Journal of Neuroradiology, 2011, 38(4):199-206.
Figures