3450
Increased Dorsal Network Functional Connectivity is Associated with DTI Indices in the Cervical Spinal Cord in Relapsing-Remitting MS1Radiology & Radiological Sciences, Vanderbilt University Medical Center, Nashville, TN, United States, 2Vanderbilt University Institute of Imaging Science, Vanderbilt University Medical Center, Nashville, TN, United States, 3Biomedical Engineering, Vanderbilt University, Nashville, TN, United States, 4Neurology, Vanderbilt University Medical Center, Nashville, TN, United States
Synopsis
Tissue integrity and functional connectivity in the cervical spinal cord were assessed with diffusion tensor imaging and resting-state fMRI in a group of relapsing-remitting multiple sclerosis participants with low disability and healthy controls. Lower fractional anisotropy and higher radial diffusivity, markers of tissue damage, were associated with higher dorsal network connectivity in the patient group, but not in controls. These results suggest that increased connectivity may represent a compensatory mechanism in response to structural damage, in order to maintain relatively preserved clinical function in this group.
Introduction
Tissue damage to the cervical spinal cord is an important cause of disability in relapsing-remitting multiple sclerosis (RRMS), and a potential marker of disease progression. This damage encompasses both focal lesions and microscopic changes in the normal-appearing tissue, both of which can be probed with diffusion tensor imaging (DTI). We previously showed that, in an MS group with low disability levels, cervical cord fractional anisotropy (FA) and radial diffusivity (RD) were altered compared to controls1, while functional connectivity (FC) assessed with resting-state functional MRI (rs-fMRI) was unchanged2. However, the relationship between cord FC and MS pathology beyond focal lesions is unknown3. Therefore, we sought to investigate whether alterations in FC may be detectable in those patients with a higher degree of tissue damage as assessed with DTI.Methods
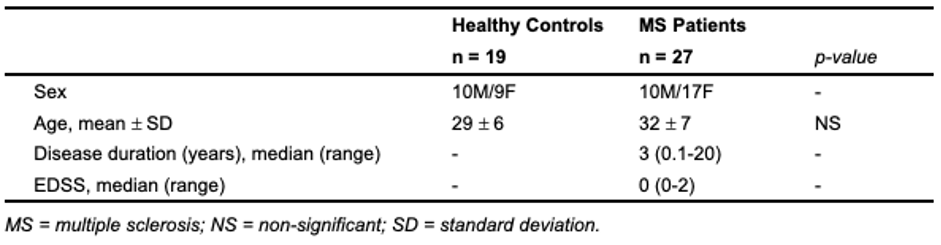
Twenty-seven participants with RRMS, with an Expanded Disability Status Scale (EDSS) ≤2 and known cervical cord involvement based on clinical MRI, and 19 healthy controls (HC) were included (Table 1). Informed consent was obtained.Participants were scanned on a 3T Philips Ingenia Elition using a 32-channel neurovascular coil with physiological monitoring. Acquisition was centered at C3/C4 and included: a T2*-weighted axial anatomical scan (multiecho FFE, TR/TE=700/8ms, α=28°, FOV=160x160 mm2, 14 slices, resolution: acquired 0.65x0.65x5mm3, reconstructed 0.31x0.31x5mm3), an ~8min resting-state functional run (3D axial multishot gradient echo, volume acquisition time=2.46s, TE=20ms, α=8°, FOV=150x150mm2, 14 slices, resolution: acquired 1x1x10mm3, reconstructed 0.59x0.59x5mm3, 200 dynamics, EPI factor=9), and a cardiac-triggered, single-shot EPI diffusion sequence (TR=5 beats (~4000ms), TE=77ms, SENSE (RL)=1.8, FOV=80x57.5x70mm3, 14 slices, resolution=1.1x1.1x5mm3, averages=3). A single-shell acquisition was used with 15 directions at b=750s/mm2. b=0s/mm2 images with reversed phase encoding were acquired for eddy current correction.
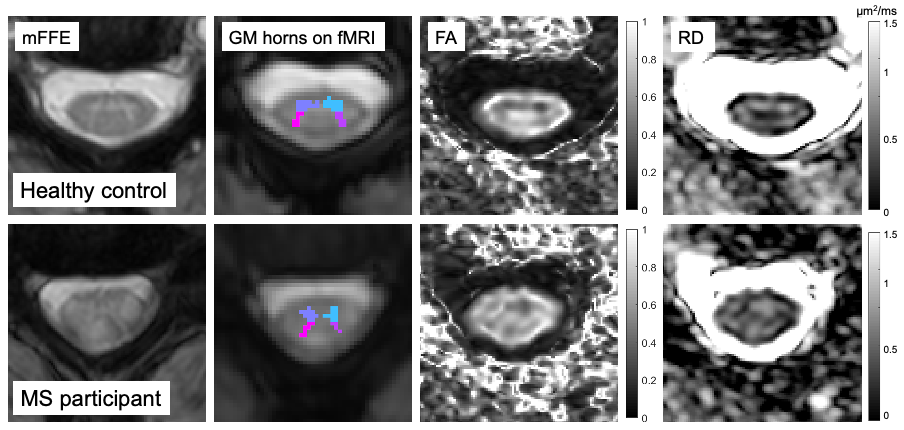
fMRI preprocessing included in-plane motion correction with SCT v4.0.04, nuisance regression (respiratory cycle, motion parameters, global and CSF signal) with AFNI-RETROICOR5, and band-pass filtering (0.01-0.10Hz). Grey matter (GM) regions of interest (ROIs) were created by segmenting the GM on the anatomical mFFE, and registering each image and mask to functional space. Slices outside the C3 and C4 levels, and ROIs≤4 voxels were excluded. Average time-series were obtained for each GM horn. Pearson correlation coefficients and corresponding Fisher z-scores (correcting for first-order autocorrelation) were computed within-slice between the ventral, and between the dorsal GM horns, and averaged across slices.
Diffusion data were corrected for B0 susceptibility distortions, motion, and eddy currents using TOPUP and EDDY in FSL6,7. FA and RD maps were created and median values computed within the central 10 slices (discarding top- and bottom-most slices due to distortions).
FA, RD, and FC indices (ventral and dorsal network z-scores) were compared between groups using Student’s t-test. In MS, ventral and dorsal z-scores were binned according to FA and RD (above/below the median for each variable) to form “low/high” tissue damage subgroups. Four one-way ANOVAs were used to assess the effect of group on the binned data. Post-hoc tests were conducted with Tukey’s method. Furthermore, within each group, correlations between DTI and FC metrics were computed using Pearson’s r.
Results
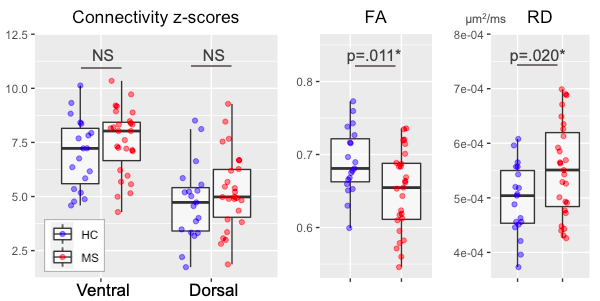
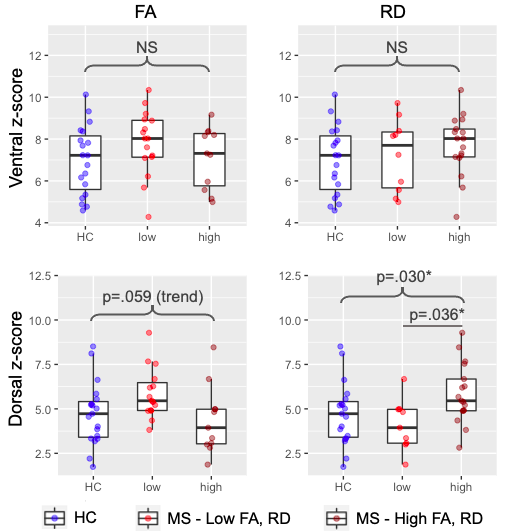
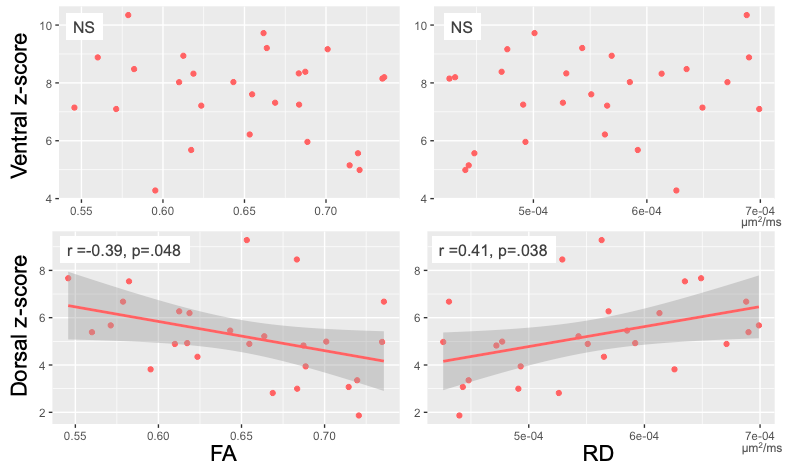
All included patients had cord lesions. FA was significantly lower (p=.011) and RD significantly higher (p=.020) in MS compared to controls (Figure 2). Ventral and dorsal z-scores did not differ between HC and MS (both p>.05, Figure 2). A one-way ANOVA showed an overall difference in the dorsal network when data were binned by low/high RD (p=.030). A post-hoc test showed a significant difference in dorsal z-scores between MS subgroups with low and high RD (p=.036; Figure 3).There were no correlations between DTI and FC indices in the control group (all p>.05, data not shown). In the MS group, there was no significant relationship between ventral network z-scores and either FA or RD. Dorsal z-scores in the dorsal network were correlated with lower FA (r=-0.39, p=.048) and higher RD (r=0.41, p=.038; Figure 4).
Discussion
Overall, patients with a higher degree of tissue damage assessed via DTI metrics displayed higher FC.It should be noted that connectivity of various networks, and separately, DTI metrics, are correlated within-subject. Significant effects were observed in the dorsal network only. While the same pattern was seen between DTI indices and ventral network, this association was not significant. It is possible that only the dorsal network, involved in sensory processing, may exhibit compensatory over-activation in reaction to tissue injury in order to preserve clinical function; or alternatively, that a resting-state paradigm may have greater sensitivity to detecting abnormalities of this particular network.
All included patients had cord lesions. As MS lesions have complex effects on local connectivity depending on their location within tracts and within-slice, further work is needed to examine the effect of pathology both within lesions and normal-appearing tissue on FC.
We found that FC and tissue damage were correlated in patients with low disability levels. Rs-fMRI may contribute to understanding the patterns that underlie clinical deficits, and help determine whether compensatory mechanisms may be at play, as is observed in the brain early in the disease course8,9. Future work will look at tissue and tract-specific DTI measures to further characterise the extent and location of tissue damage in relation to FC in this group, as well as assessing relationships with sensorimotor function.
Acknowledgements
The authors thank all study participants and the VUIIS MRI technologists. Dr. O'Grady is supported by a VUMC Faculty Research Scholars Award. This work was supported by funding from the Conrad Hilton Foundation, National MS Society, and NIH/NINDS 1R01NS109114-01 & and 5R01NS104149-02.References
1. O'Grady et al. (2020). Evaluation of DTI Indices in the Cervical Spinal Cord as Markers of Sensorimotor Impairment in MS Patients with Mild Disability [Poster]. ISMRM 28th Annual Meeting Proceedings.
2. Combes et al. (2020). Cervical cord resting-state fMRI shows preserved functional connectivity in low disability relapsing-remitting MS [Power pitch]. ISMRM 28th Annual Meeting Proceedings.
3. Conrad et al. (2018). Multiple sclerosis lesions affect intrinsic functional connectivity of the spinal cord. Brain, 141(6), 1650–1664. https://doi.org/10.1093/brain/awy083
4. De Leener et al. (2017). SCT: Spinal Cord Toolbox, an open-source software for processing spinal cord MRI data. NeuroImage, 145, 24–43. https://doi.org/10.1016/j.neuroimage.2016.10.009
5. Glover et al. (2000). Image-based method for retrospective correction of physiological motion effects in fMRI: RETROICOR. Magnetic Resonance in Medicine, 44(1), 162–167. https://doi.org/10.1002/1522-2594(200007)44:1<162::AID-MRM23>3.0.CO;2-E
6. Andersson et al. (2003). How to correct susceptibility distortions in spin-echo echo-planar images: Application to diffusion tensor imaging. NeuroImage, 20(2), 870–888. https://doi.org/10.1016/S1053-8119(03)00336-7
7. Andersson et al. (2016). An integrated approach to correction for off-resonance effects and subject movement in diffusion MR imaging. NeuroImage, 125, 1063–1078. https://doi.org/10.1016/j.neuroimage.2015.10.019
8. Basile et al. (2014). Functional connectivity changes within specific networks parallel the clinical evolution of multiple sclerosis. Mult. Scler. J. 20, 1050–1057. doi:10.1177/1352458513515082
9. Strik et al. (2020). Increased functional sensorimotor network efficiency relates to disability in multiple sclerosis. Mult. Scler. J. doi:10.1177/1352458520966292
Figures