3448
Feasibility of cervical spinal cord cross-sectional measurements from 3D T1w sagittal head MRI at 7T1Danish Research Centre for Magnetic Resonance, Centre for Functional and Diagnostic Imaging and Research, Copenhagen University Hospital Hvidovre, Hvidovre, Denmark, 2Dept. of Neurology, Copenhagen University Hospital Bispebjerg, Copenhagen, Denmark, 3Institute for Clinical Medicine, Faculty of Medical and Health Sciences, University of Copenhagen, Copenhagen, Denmark
Synopsis
Spinal cord atrophy is a highly relevant measure of disease progression in multiple sclerosis. Here, we assessed whether cord area measurements from head MRI scans at 7T are feasible with semi- and fully-automated tools. Although different tools can yield systematically different absolute cord areas, measurements were highly consistent within studies as well as across field strengths, if images with similar voxel sizes were used. At higher spatial resolution, the volume of partial signal voxels is reduced and smaller cord areas and diameters were measured than typically reported in literature.
Introduction
Spinal cord atrophy occurs at about 2% per year in multiple sclerosis (MS)1, making it a relevant marker of disease progression and a potential endpoint measure in MS clinical trials2-5. However, due to scan time limitations, dedicated cord assessments are often replaced by measurements from large field-of-view (FOV), sagittal head MRI scans that visualise the upper part of the cervical spinal cord. The cross-sectional area (CSA) at the C1/C2 cervical segment, which has been widely assessed, shows a moderately positive relationship with the extended disability status scale (EDSS) in MS6. Increased signal-to-noise ratio and improved spatial resolution are driving MS research toward 7T. However, head-neck coils are not yet widely available for 7T and enhanced susceptibility artifacts can lead to a significant signal drop in infratentorial brain regions, potentially hampering cord measurements. We assessed whether high spatial resolution MPRAGE scans at 7T provide reliable CSA measurements at C1/C2 and whether automatised tools, e.g. the spinal cord toolbox (SCT)7, can be employed. Finally, we compared CSA-estimates at 7T and 3T.Methods
7T data were collected in 46 MS patients (34 relapsing-remitting (RR)MS, 12 secondary-progressive (SP)MS, median EDSS 3) and 23 healthy controls (HC) on a Philips Achieva (Best, Netherlands) with a 32Rx/2Tx-channel head coil (Nova Medical, Wilmington, MA, USA) and motion correction8. Spinal cord segmentation was performed on 3D sagittal MPRAGE images (0.65 mm isotropic) after N4 bias-field correction with ANTs9. Using SCT version 4.3, the whole cord was segmented with sct_deepseg_sc and manual labels were placed relative to the C2/C3 intervertebral disc. Then, individual cord levels and their average spatial dimensions were determined. For comparison, CSA was also estimated using a semi-automated, in-house developed tool (LT, implemented in Matlab)10 that assesses CSA over five adjacent slices by intensity thresholding, following the method by Losseff5. A second 7T dataset, which included 17 Parkinson’s patients and HC, was assessed relative to 3T data (Prisma, Siemens, Erlangen, Germany, 64Rx-channel head coil). At 7T, segmentation was performed on lower resolution 3D MPRAGE images (0.85x0.85x1 mm3) and at 3T on a multi-parameter mapping T1w scan (1 mm isotropic). In addition to CSA, LR (left-right) and AP (anterior-posterior) diameters were assessed. Segmentation results were compared by Pearson’s correlations and group differences were determined by Kruskal-Wallis test.Results
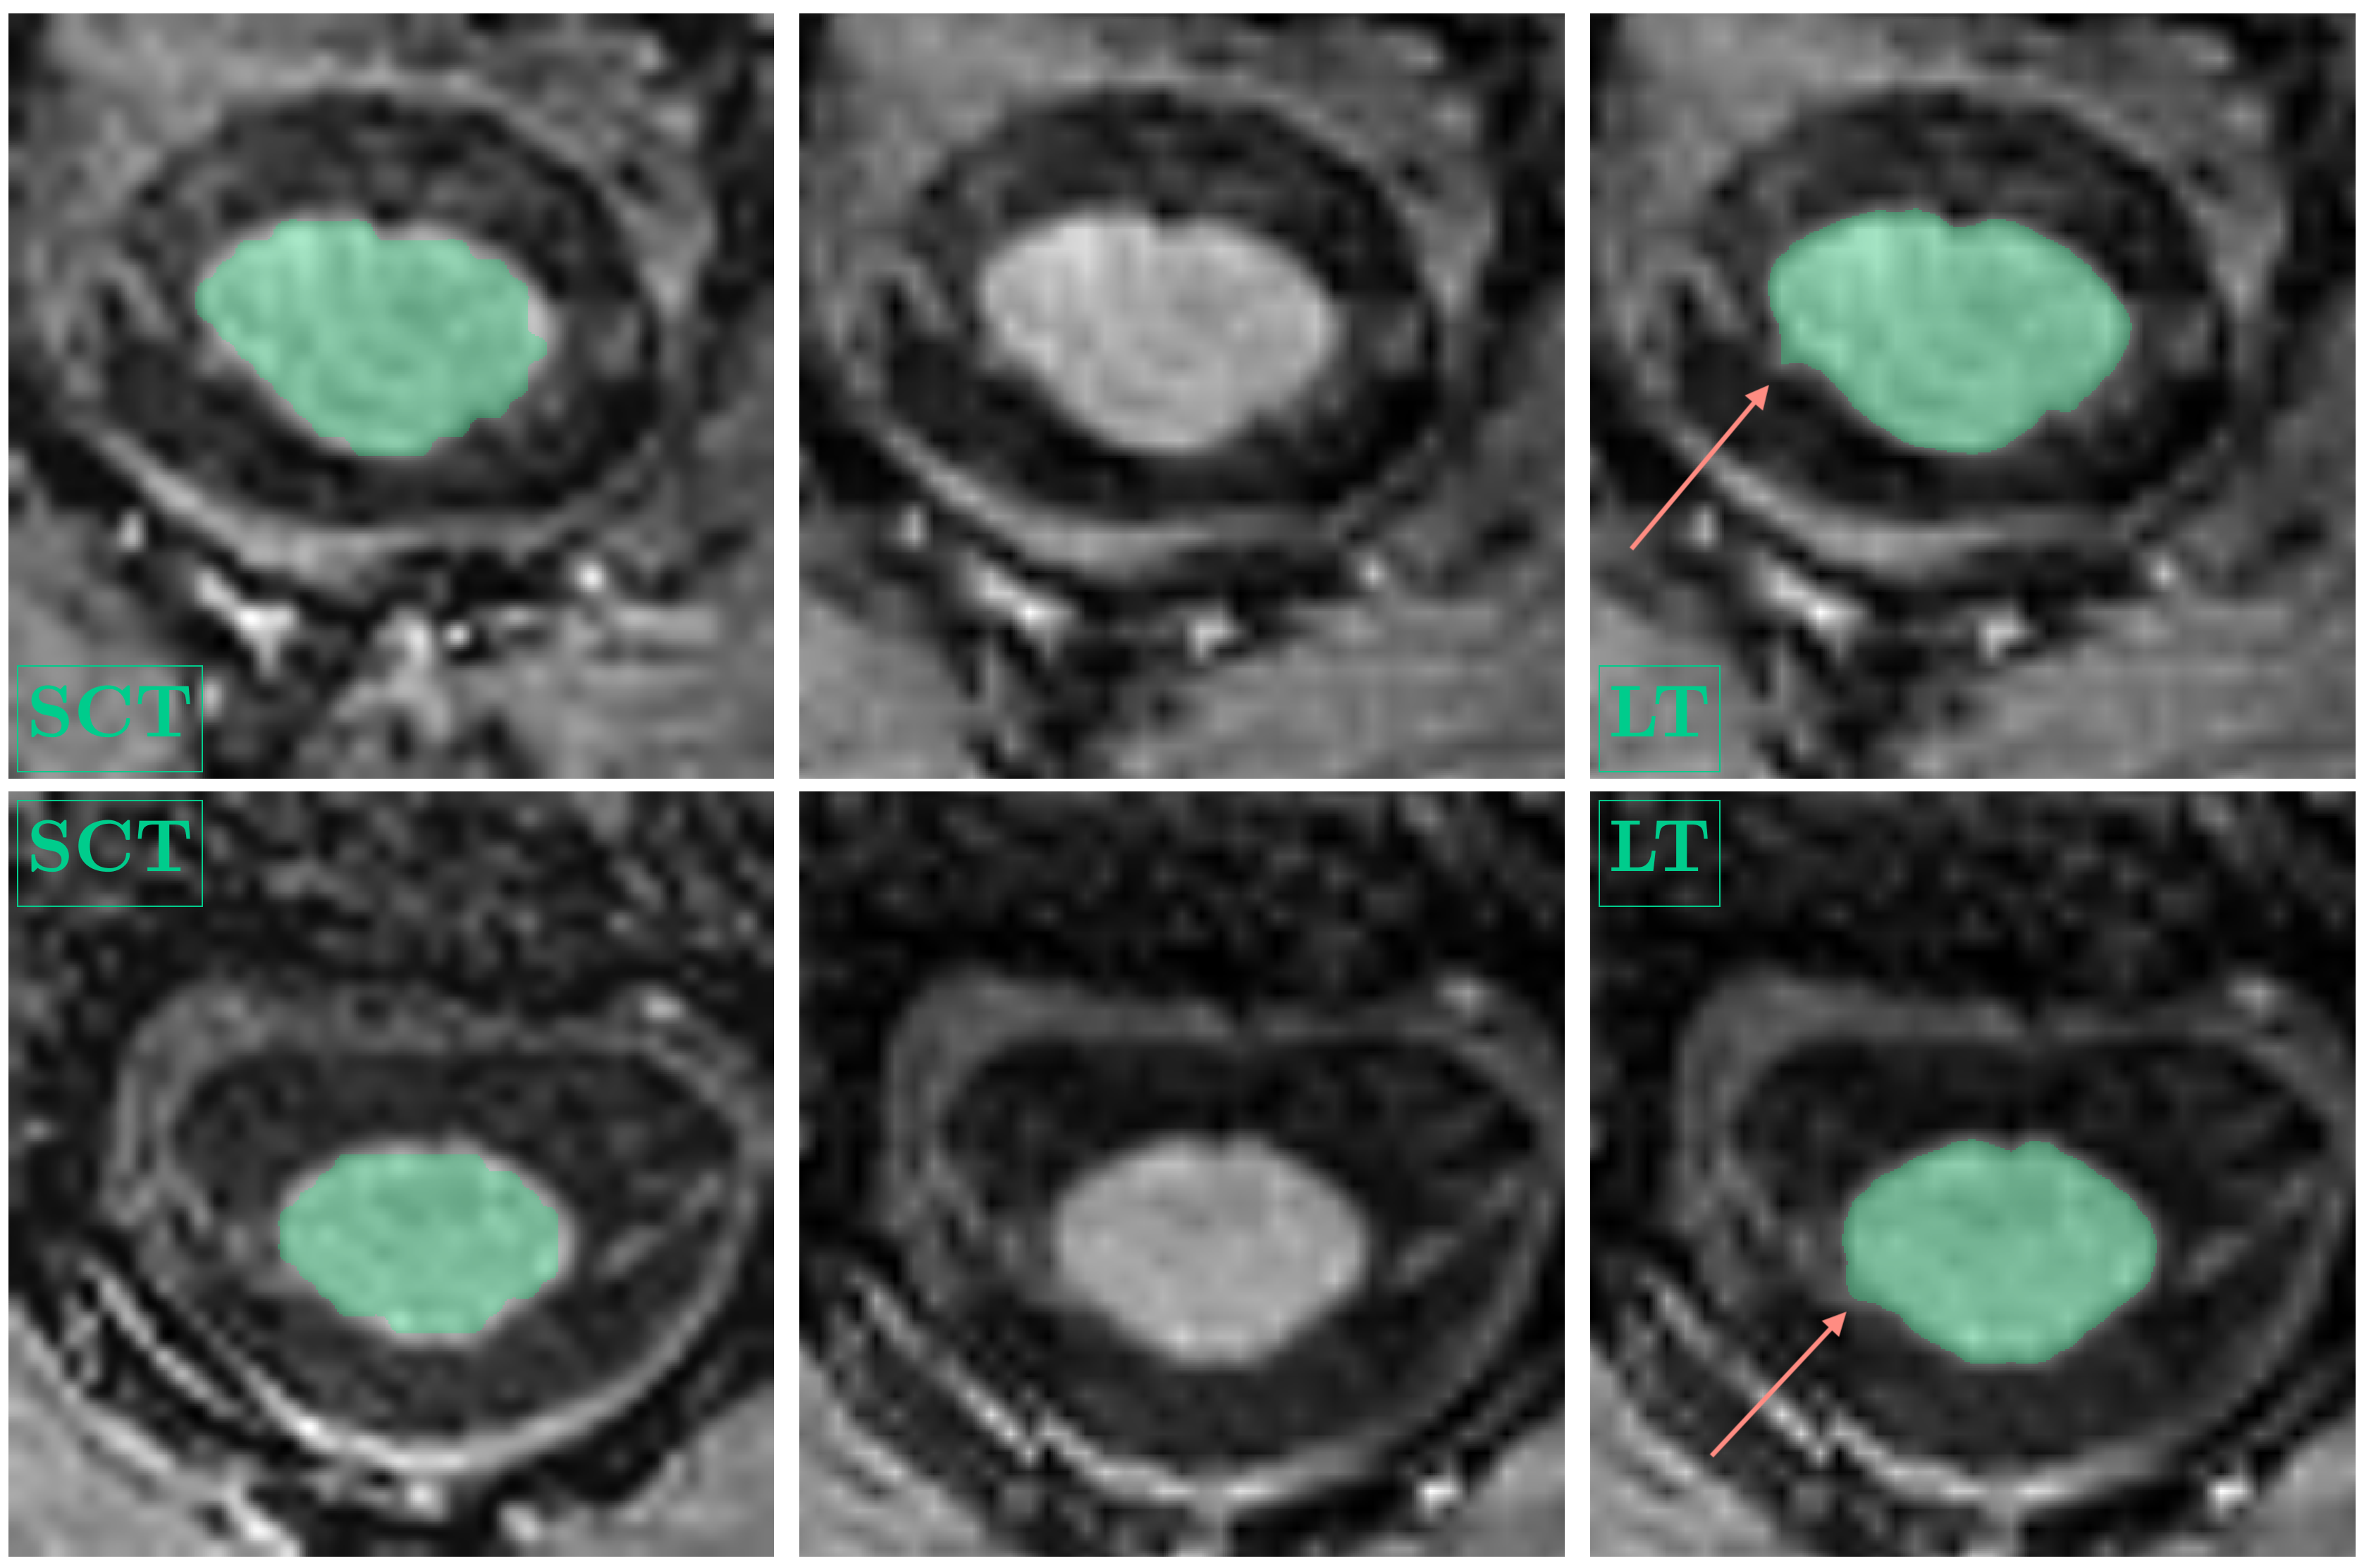
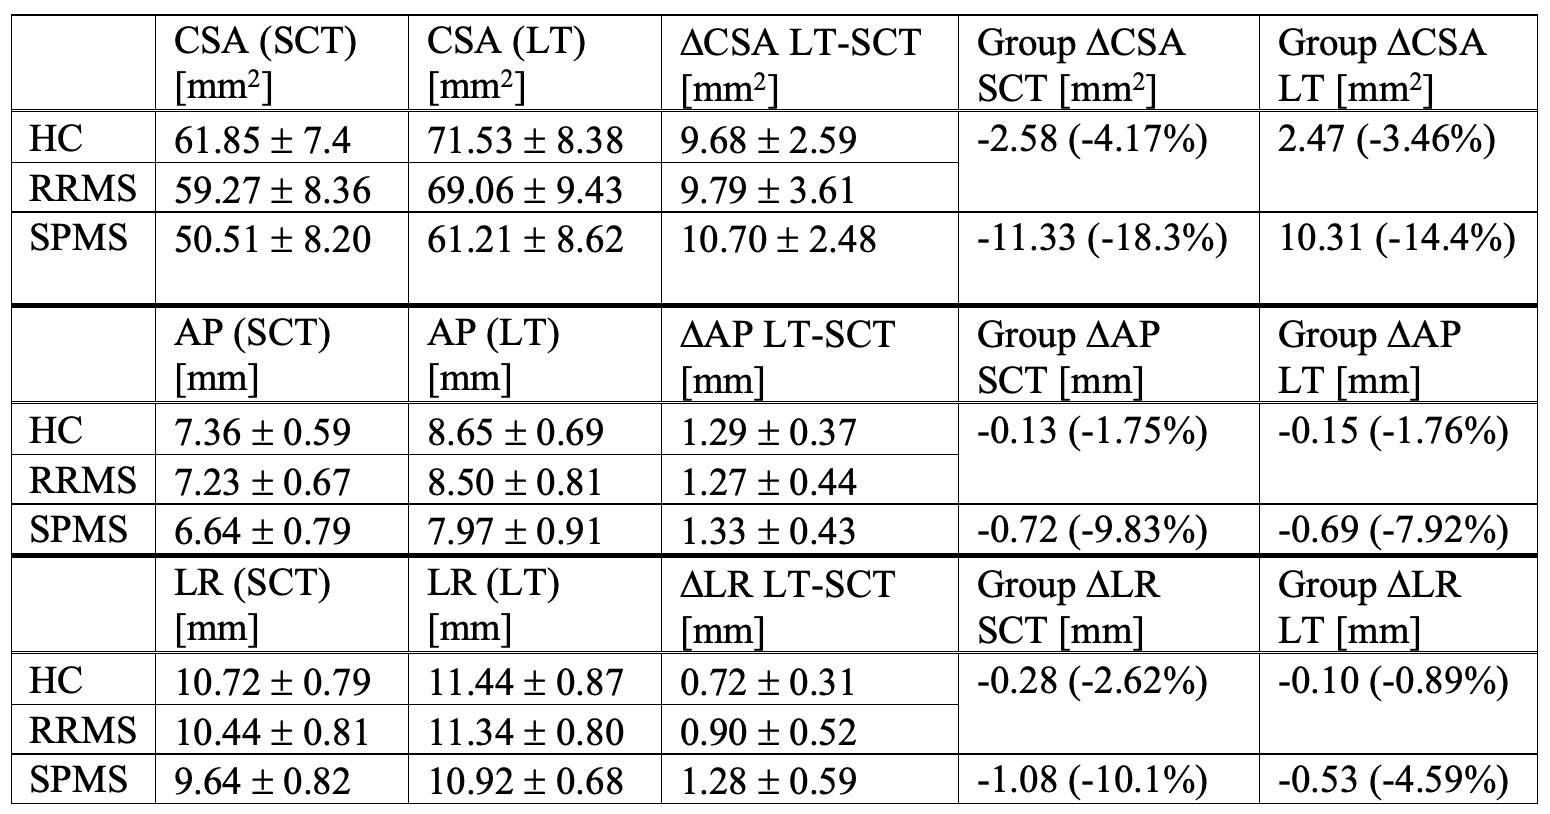
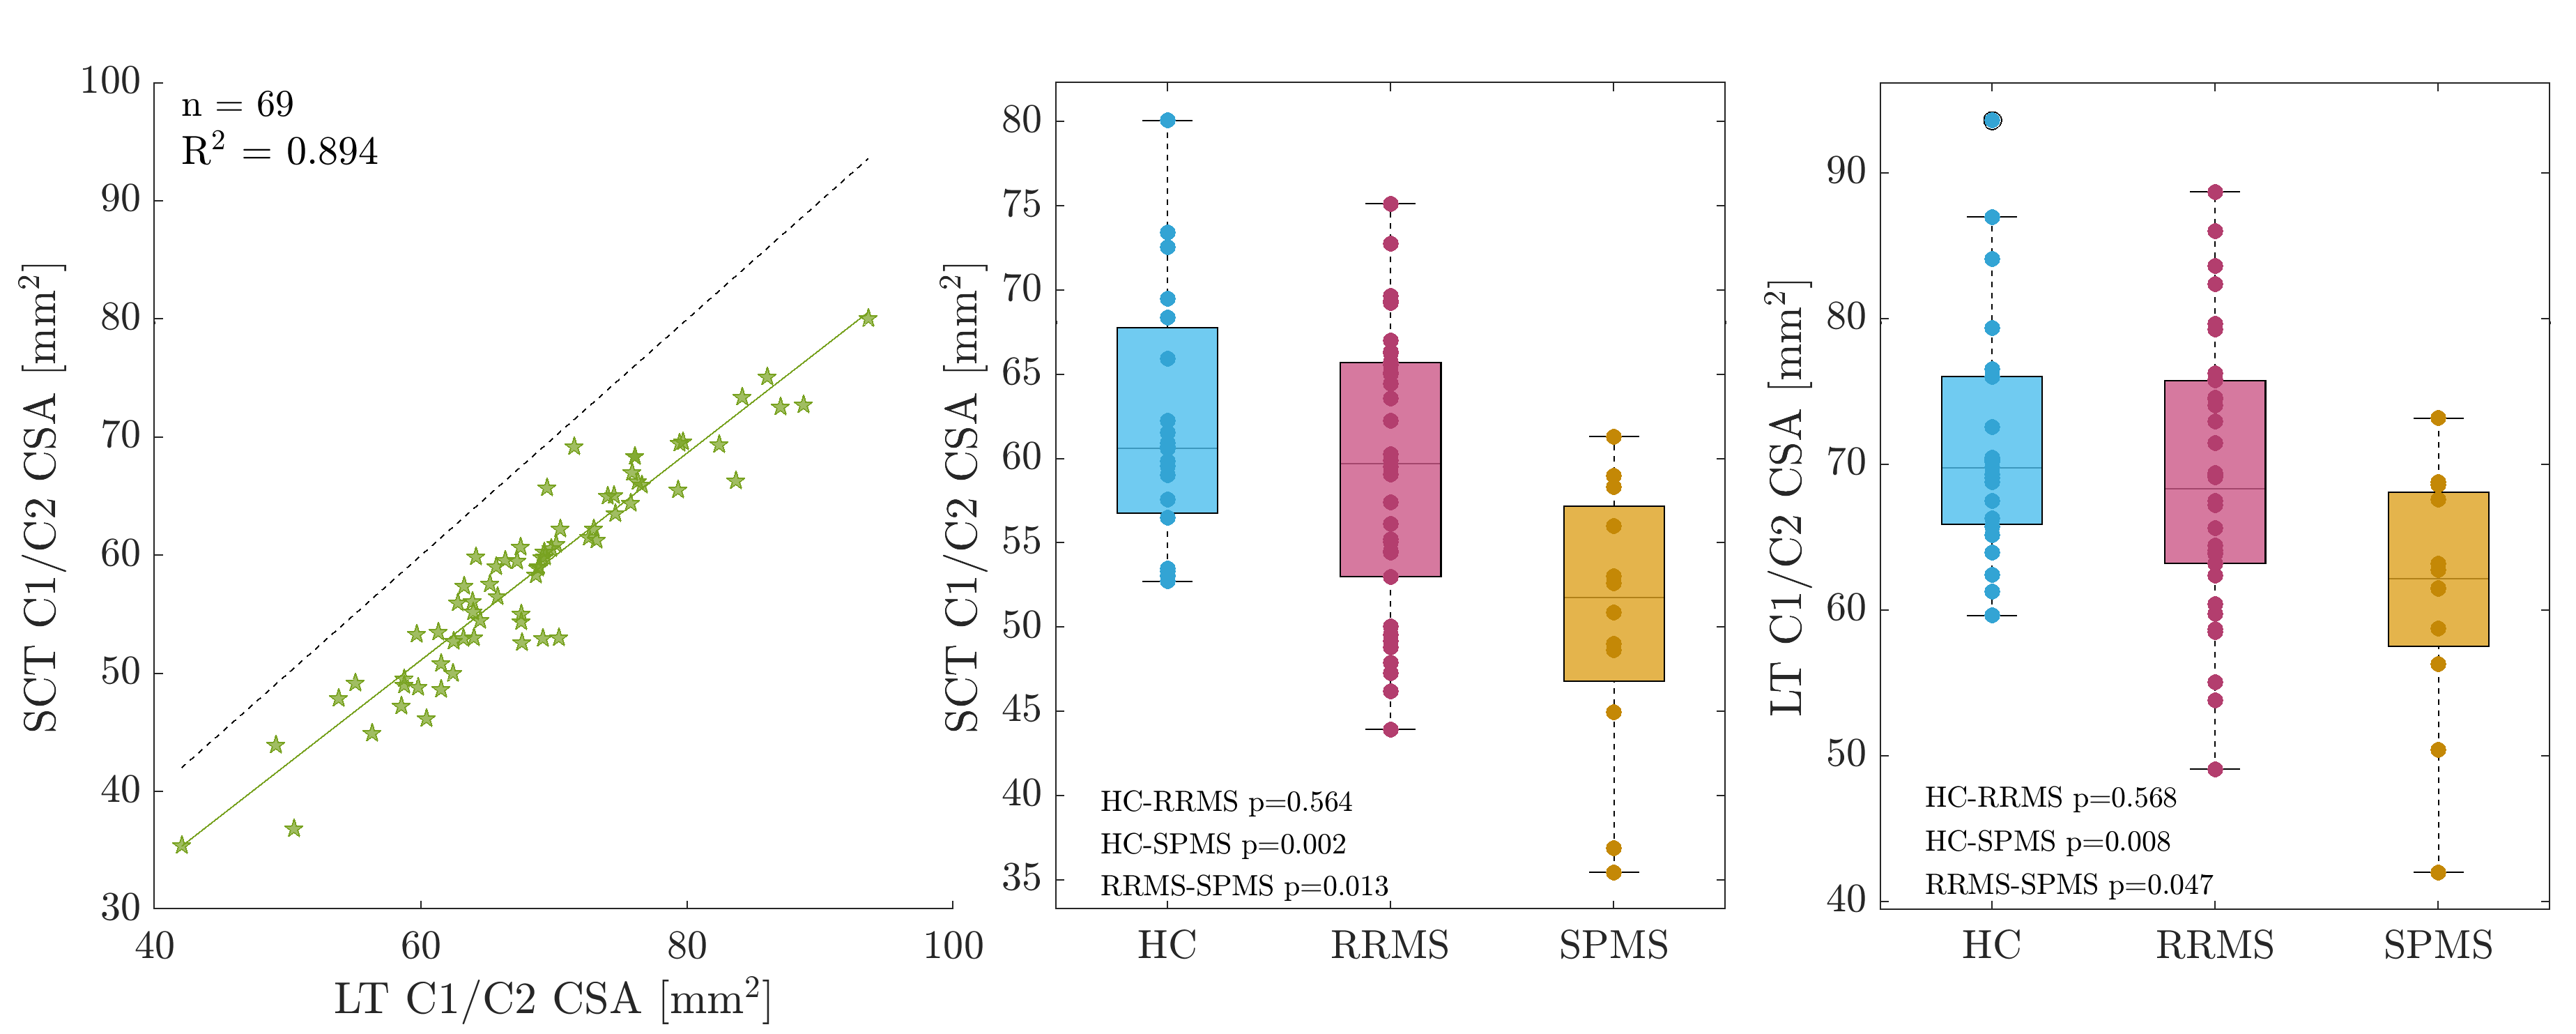
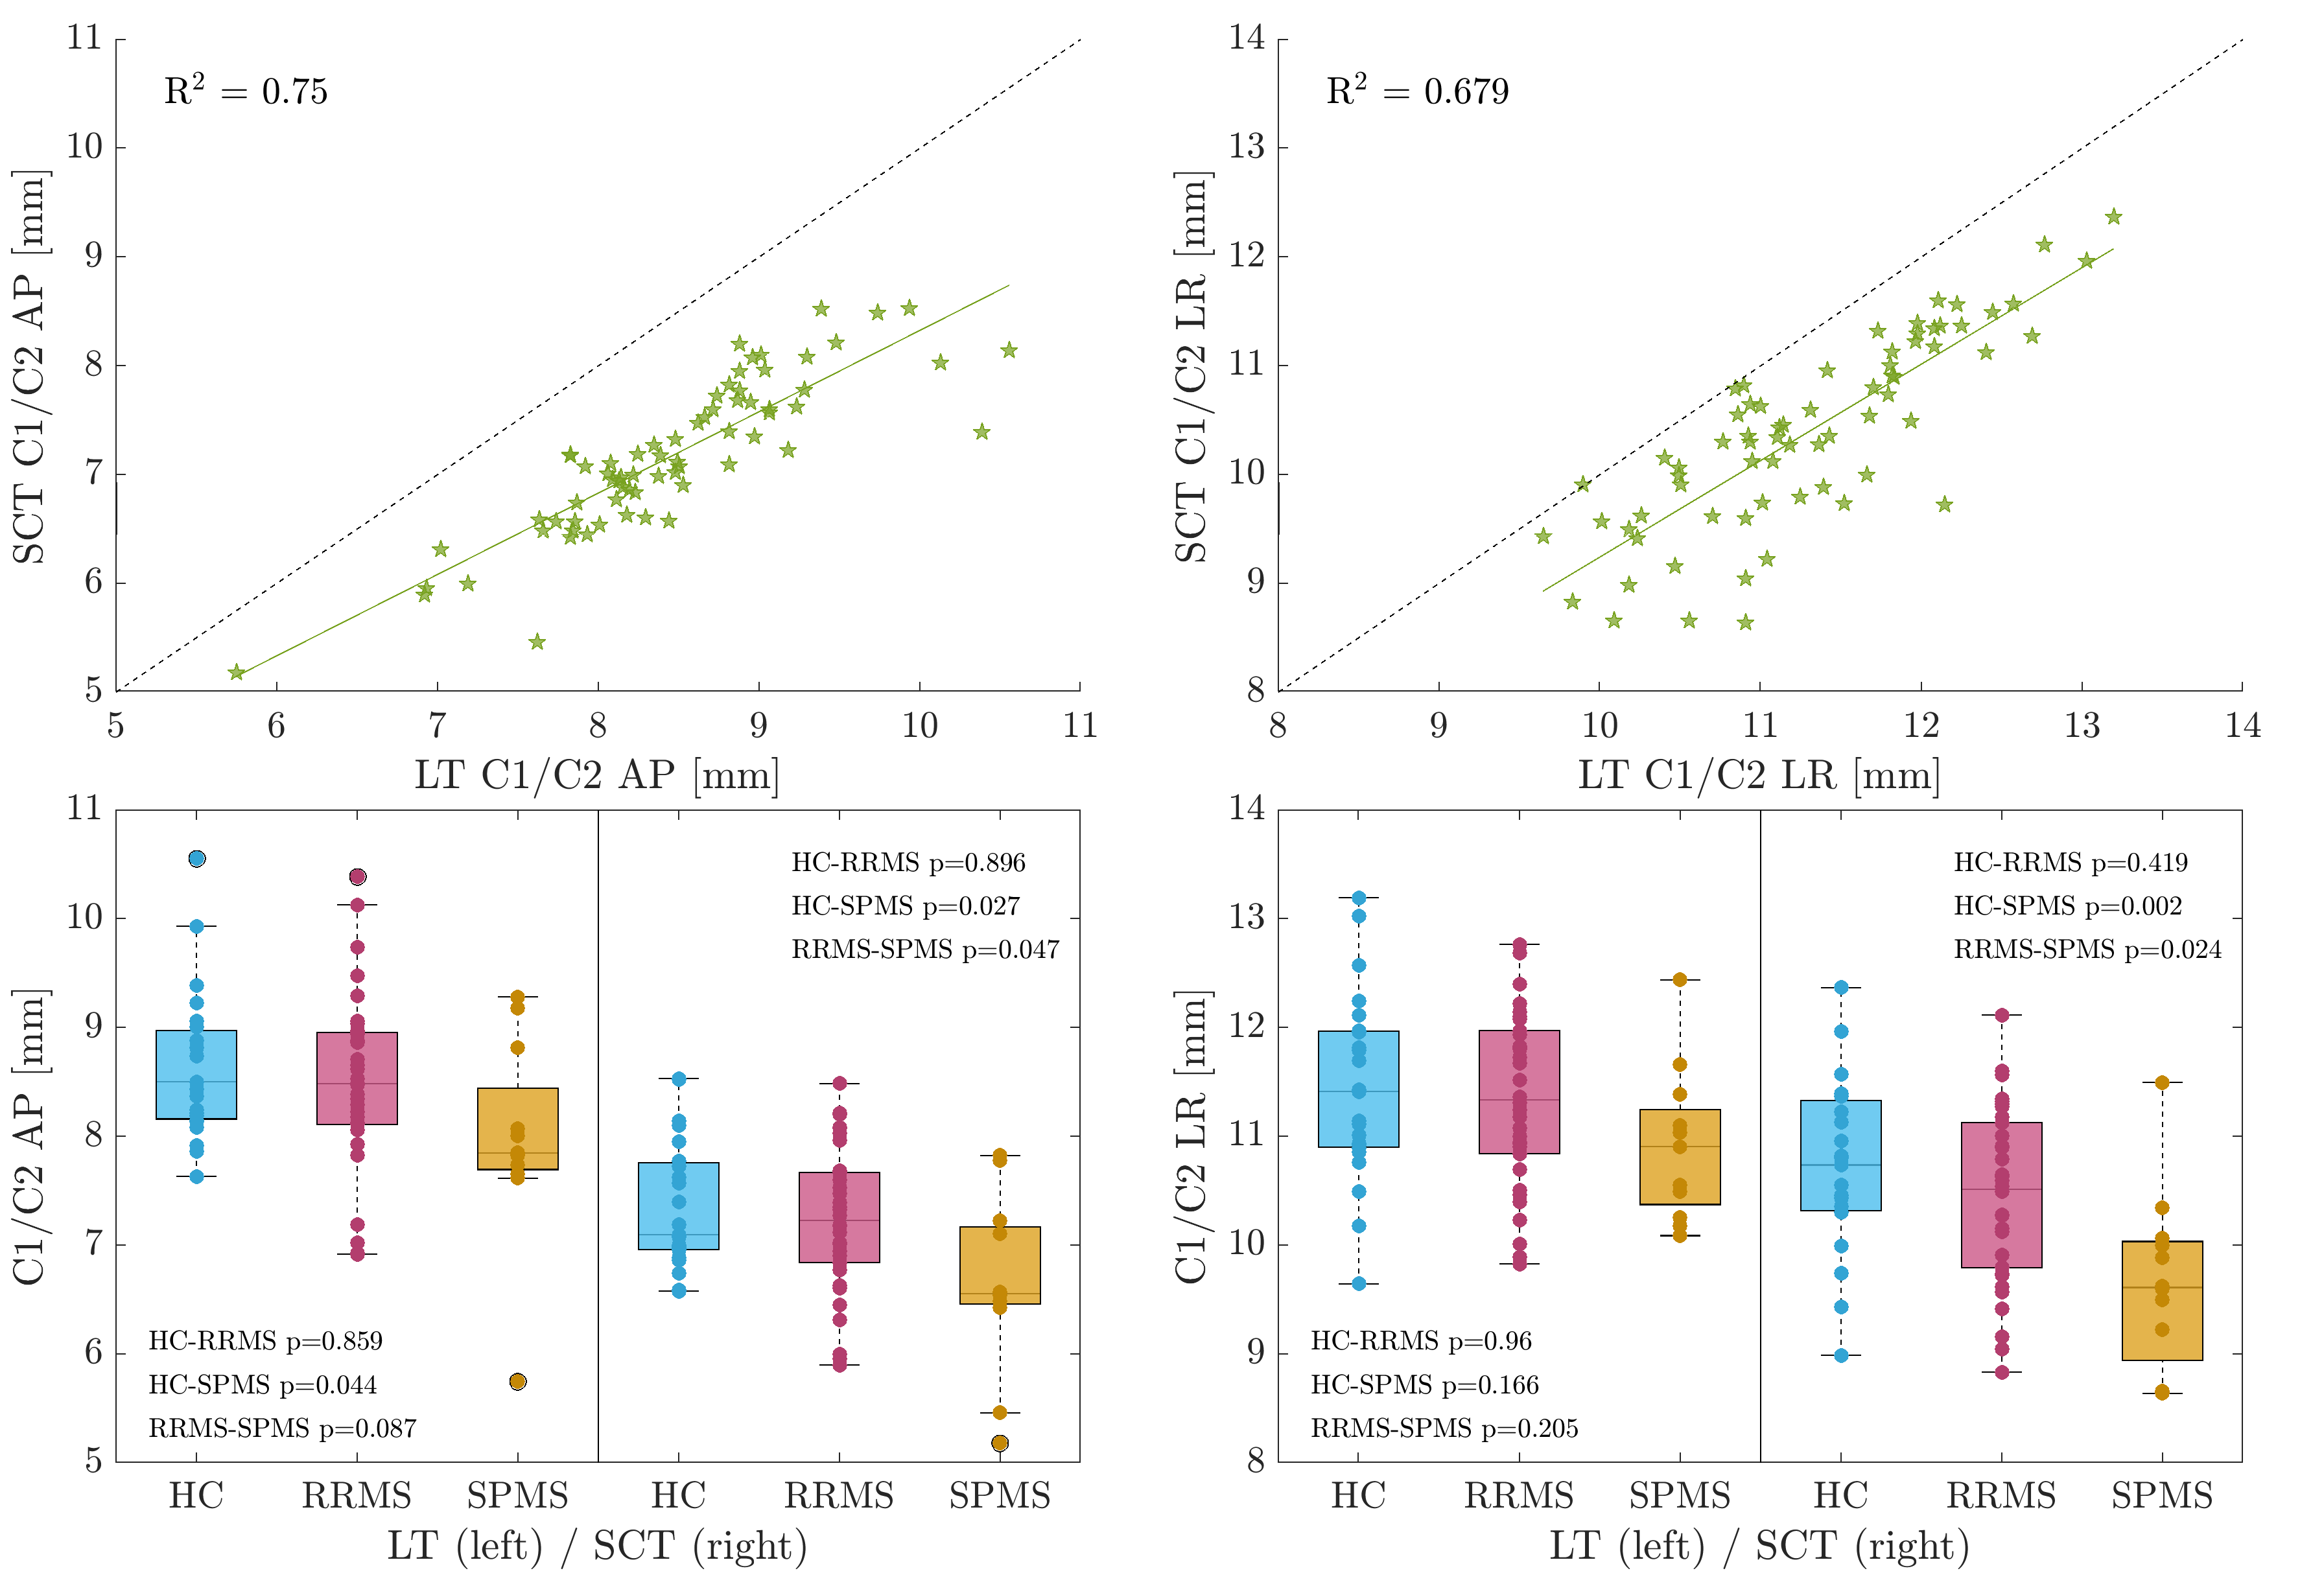
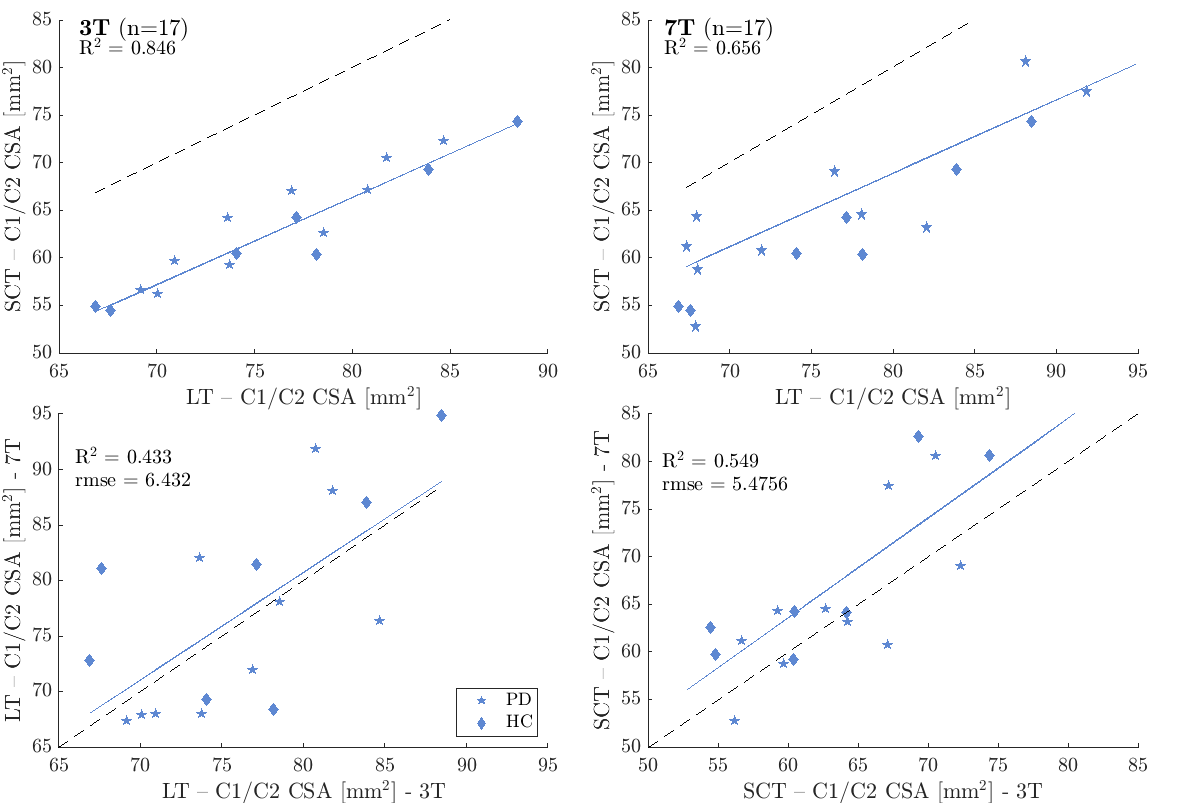
The mean CSA, RL and AP measurements for cohort 1 are summarised in Table 1 and examples are shown in Figure 1. 13/69 initial cord segmentations needed manual annotation. On average, all SCT-measured dimensions were smaller than LT-measured dimensions. Both reported smaller CSA than typically found in literature (e.g. HC mean SCT-CSA=61.9 mm2 and LT-CSA=71.5 mm2, literature 80 mm2 1,11). Nevertheless, measurements were highly correlated, and absolute mean CSA differences between groups were consistent and similarly significant (Figure 2). Likewise, SCT-obtained LR and AP diameters were smaller than with LT (Figure 3). AP group differences were consistent for both approaches. For LR, only SCT-measured group differences were significant. CSA measurements in the second cohort were also smaller with SCT compared to LT, but overall closer to literature values. CSA was not significantly different between field strengths (p > 0.1, Wilcoxon rank sum test) (SCT 3T=63.2 ± 6.2 mm2 – 7T=66.2 ± 8.8 mm2; LT 3T=76.3 ± 6.3 mm2 – 7T=77.3 ± 9.1 mm2) (Figure 4).Discussion
CSA estimates can vary due to differences in methodology and voxel resolutions. LT is intensity-dependent and known to segment up to 4.5-10% larger CSA1. In both of our datasets, LT-CSA was about 15% larger than SCT-measured CSA. We assessed C1/C2 as signal loss at lower C-spine levels becomes more frequent and cord motion and CSF flow increase10. The significant difference in CSA between RRMS and SPMS agrees with current literature12,13. Further, group differences in LT-estimated AP diameter, but not with LR, have been previously reported14. However, SCT-LR did differ between cohorts. This discrepancy may be due to the presence of nerve roots in the LR direction, which were captured with LT, but less so with the more conservative SCT segmentation (Fig. 1). Further work to validate and understand potential LR diameter group differences is needed. In trauma patients, AP and LR changes independently predict motor and sensory deficits10. With higher spatial image resolutions at 7T, the volume of partial signal voxels at the cord edge, and thereby CSA, are expected to be reduced. However, when we compared field strengths, there were no significant differences in CSA for either segmentation approach. Notably, mean CSA in cohort 2 was larger than for cohort 1 at 7T, despite older age. This was likely due to the different image voxel sizes. In cohort 2, the voxel size was still 72.3% of the 3T voxel volume, but for cohort 1 the MPRAGE voxel size was reduced to 27.5%.Conclusion
We found that large-FOV MPRAGE images can be used to produce reliable C1/C2 CSA estimates at 7T, especially if signal loss in the neck region can be minimised. At high spatial resolution, CSA may be smaller than typically reported as the amount of partial volume voxels is reduced. More work is needed to systematically assess the effect of voxel size, together with signal-to-noise ratio and field strength, to accurately determine CSA and diameters.Acknowledgements
This work was supported by the Danish Multiple Sclerosis Society [Grant numbers: A33409, A35202, A38506] and the Independent Research Fund Denmark [Grant number: 9039-00330A]. Data acquisition of the second cohort was funded by the Danish Council for Independent Research [Grant number: 7016-00226B], the Novo Nordisk Foundation [Grant number: NNF16OC0023090] and the Danish Parkinson’s Disease Association [Grant number: A289]. HL has received funding from the European Research Council (ERC) under the European Union’s Horizon 2020 research and innovation program [grant agreement No 804746]. The 7T scanner was donated by the John and Birthe Meyer Foundation and The Danish Agency for Science, Technology and Innovation [Grant no. 0601-01370B].References
1. Lin X, et al. Measurement of spinal cord atrophy in multiple sclerosis. J Neuroimaging 2004;14:20S-26S.
2. Kearney H, et al. Spinal cord MRI in multiple sclerosis – diagnostic, prognostic and clinical value. Nat Rev Neurol 2015;11:327-338.
3. Cawley N, et al. Spinal cord atrophy as a primary outcome measure in phase II trials of progressive multiple sclerosis. MSJ 2018;24(7):932-941.
4. Prados F, Barkhof F. Spinal cord atrophy rates. Ready for prime time in multiple sclerosis clinical trials? Neurology 2018;91(4).
5. Losseff NA, et al. Spinal cord atrophy and disability in multiple sclerosis. Brain 1996;119:701-708.
6. Xiaodong S, et al. Correlation between EDSS scores and cervical spinal cord atrophy at 3T MRI in multiple sclerosis: A systematic review and meta-analysis. Mult Scler Relat Disord 2020;37:101426.
7. De Leener B, et al. SCT: Spinal cord toolbox, an open-source software for processing spinal cord MRI data. NeuroImage 2017;145(A):24-43.
8. Andersen M, et al. Improvement in diagnostic quality of structural and angiographic MRI of the brain using motion correction with interleaved, volumetric navigators. PLoS ONE 2019;14(5):e0217145.
9. Tustison NJ, et al. N4itk: improved n3 bias correction. IEEE Trans Med Imaging 2010;29(3):1310-1320.
10. Lundell H, et al. Independent spinal cord atrophy measures correlate to motor and sensory deficits in individuals with spinal cord injury. Spinal Cord 2011;49:70-75.
11. Kearney H, et al. Improved MRI quantification of spinal cord atrophy in multiple sclerosis. JMRI 2014;39:617-623.
12. Bernitsas E, et al. Spinal cord atrophy in multiple sclerosis and relationship with disability across clinical phenotypes. Mult Scler Relat Disord 2015;4(1):47-51.
13. Liu C, et al. Three dimensional MRI estimates of brain and spinal cord atrophy in multiple sclerosis. J Neurol Neurosurg Psychiatry 1999;66:323-330.
14. Lundell H, et al. Spinal cord atrophy in anterior-posterior direction reflects impairment in multiple sclerosis. Acta Neurol Scand 2017;136(4):330-337.
Figures